Vol. 18, No. 10 pp. 739-744, 2017
A Study on Torsional Characteristics of the Car Body Types at Cornering Motion
Joon-Seong Lee
1*, Seong-Gyu Cho
21Dept. of Mechanical System Engineering, Kyonggi University
2Dept. of Mechanical Engineering, Graduate School, Kyonggi University
선회주행 시 차체의 비틀림 특성에 관한 연구
이준성1*, 조성규2
1경기대학교 기계시스템공학과, 2경기대학교 대학원 기계공학과
Abstract Elastic deformation and fatigue damage can cause the permanent deformation of a kart's frame during turning, affecting the kart's driving performance. A kart's frame does not contain any suspension ordifferential devices and, therefore, the dynamic behavior caused by torsional deformation when driving along a curve can strongly affect these two kinds of deformations. To analyze the dynamic behavior of a kart along a curved section, the GPS trajectory of the kart is obtained and the torsional stress acting on the kart-frame is measured in real time. The mechanical properties of leisure and racing karts are investigated by analyzing their material properties and conducting a tensile test. The torsional stress concentration and frame distortion are investigated through a stress analysis of the frame on the basis of the obtained results. Leisure and racing karts are tested in each driving condition using driving analysis equipment. The behavior of a kart when being driven along a curved section is investigated through this test. Because load movement occurs owing to centrifugal force when driving along a curve, torsional stress acts on the kart's steel frame. In the case of a leisure kart, the maximum torsional stress derived from the torsional fatigue limit wasfound to be 230 MPa, and the torsional fatigue limit coefficient was 0.65 when driving at a speed of 40 km/h. Furthermore, the driving elements during thecornering of a kart were measured based on an actual auto-test after installing a driving measurement system, and the driving behavior of the kart was analyzed by measuring its vertical displacement.
요 약 탄성변형과 피로손상은 카트의 주행성능에 영향을 미치는 것으로 카트 프레임에 영구변형을 유발할 수 있다. 카트프 레임은 현가장치와 다른 장치를 포함하지 않으므로 두 가지 변형에 결정적인 영향을 미칠 수 있는 코너주행 시 동적 거동은 비틀림 변형이 원인이 된다. 선회주행 시 카트의 동적 거동을 분석하기 위해 카트의 GPS추적이 실시간으로 이루어지고 카트 프레임에 작용하는 비틀림 응력값을 측정하였다. 레저카트와 레이싱카트의 재료물성치들은 인장실험을 통해 얻었다. 비틀림 응력집중과 프레임 변형은 얻어진 결과 값을 토대로 프레임의 응력해석을 통하여 파악하였다. 개발된 주행분석장치를 이용 하여 레저카트와 레이싱카트를 각 조건별로 실차실험을 수행하였고 이를 통한 코너에서 카트의 주행거동을 살펴보았다. 카 트가 곡선주행 시 원심력으로 인해 하중이동이 발생하였으며 카트프레임에 비틀림 응력이 발생하였다. 예를 들어 레저카드 의 경우, 40 km/h의 속도로 운전할 때 최대 비틀림 피로한도를 측정한 최대 비틀림응력은 230 MPa이며 비틀림 피로한도계수 는 0.65를 나타내었다. 뿐만 아니라 카트의 선회 시 운전요소들을 운전측정시스템을 인스톨한 실측장비에서 측정하였으며 카트의 운전거동은 수직변위에 의해 측정하였다.
Keywords : Deformation Analysis, Driving Condition, Dynamic Behavior, Fatigue Damage, Kart’s Frame, Tensile Test, Torsional Characteristics
This work was supported by Kyonggi University’s Graduate Research Assistantship 2016.
*Corresponding Author : Joon-Seong Leeg(Kyonggi Univ.) Tel: +81-31-249-9813 email: [email protected]
Received July 26, 2017 Revised (1st September 5, 2017, 2nd September 7, 2017) Accepted Octobet 13, 2017 Published October 31, 2017
1. Introduction
A kart is a medium-sized vehicle high-speed vehicle that is smaller than a sports utility vehicle; karts are used for both leisure and racing. Compared to a sports utility vehicle, a kart has a moderate construction costs and running, cost and it is more eco-friendly. However, it is necessary to improve the fatigue strength of a kart while maintaining low weight. In structures subjected to constantly fluctuating loads, the fatigue strength is influenced more by the stress and its direction than by the stiffness. In recent years, fatigue strength has been evaluated by experiments and by simulations using a finite element analysis program.
Jang H.T.[1]constructed a test system capable of applying various design loads in order to evaluate the structural safety of weak points of a kart while driving on a curve and analyzed the characteristics and shifts in load of the steering system. Ponzo[2] performed a structural analysis and test that considered the static and fatigue load of a kart frame. Vitale[3] proposed a kart model considering the overall parameters for the dynamic analysis of a kart. Kang[4] studied the vehicle behavior by analyzing the dynamic driving characteristic in which the minimum ground clearance of the railway vehicle is changed by load shift and driving mode shift of the frame when driving on curve. However, previous-studies did not consider the effect of changes in speed as well as the effects of various structural materials; therefore, these studies did not consider the complex effects of the dynamic load occurring when driving on a track. Therefore, in this study, the fatigue strength of a kart frame was evaluated by varying the actual dynamic stress at various driving speeds.
2. Type of Karts
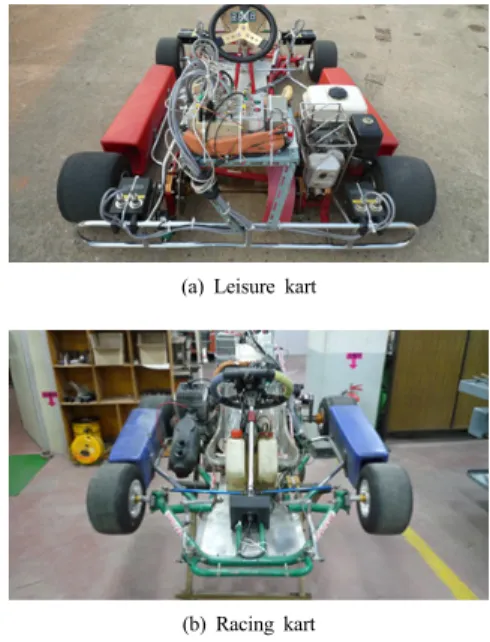
A kart consists of engine, chassis, and frame, as shown in Fig. 1. The frames structure is typically made of Fe and Mn; that of a racing kart may additionally
consist of Si and Cr, the static strength and stiffness of which has been evaluated in previous studies.
The fatigue strength of a frame has also been analyzed because it is subjected to complex fatigue loads of amplitudes and frequencies, such as the static load from the weight of the kart and the dynamic load during curving, braking,
(a) Leisure kart
(b) Racing kart Fig. 1. Type of karts
2.1 Mechanical Properties of Material A leisure kart’s frame is typically made of Mn alloy, which affords improved elongation rate with strength.
A racing kart’s frame is typically made of Si and Cr, which improved hardness and elastic limit. Table 1 lists the mechanical properties of each material. Table 2 lists the fatigue limit used in fatigue strength analysis; the torsional fatigue limit was calculated using the tensile test result and load effect.
% Fe Mn Si Cr
Leisure kart 98.30 1.70 - -
Racing kart 97.37 1.04 0.48 1.15
Table 1. Component of kart frames
Material Yield Strength
[MPa] Ultimate Strength [MPa] Elogation
[%]
Steel 431.3 447.2 6.4
Leisure kart 471.9 558.0 27.0
Racing kart 598.9 754.0 13.1
Table 2. Mechanical properties of materials
3. Measurement and Analysis
3.1 Load Condition and Stress Measurement Points
Before the actual dynamic stress measurement, the stress was measured under zero and full load conditions as shown in Tables 3 and 4. The weight of a leisure kart was 102kgf, 161kgf and that of a racing kart was 112kgf, 167kgf.
Fig. 2 shows the 26 and 30 measurement points selected in the leisure and racing kart, respectively, for structural analysis and static load measurements.
[kgf] FL FR RL RR Total
Tare 15.93 13.55 29.98 42.6 102.06
Load 32.47 23.3 45 60.4 161.57
Table 3. Weight of a leisure kart
[kgf] FL FR RL RR Total
Tare 15.5 29 36.5 50.5 112
Load 29 30.5 50.5 57 167
Table 4. Weight of a racing kart
(a) Leisure kart (b) Racing kart Fig. 2. Type of kart’s framesz
3.2 Measurement and Analysis Considering Driving Conditions
The torsional stress in each kart was measured at various driving speeds. Owing to the limitation of the test track, we measured the torsional deformations at various speeds under 50km/h while driving on the track. A constant speed was maintained when driving on the curve section. After eliminating the effects of noise, when driving one lap, the torsional deformation of the frame was measured and analyzed based on the following factors.
(1) The GPS trajectory, change in steering angle, and time required for completing the lap and to reach certain points.
(2) Torsional change analysis along the curve with time.
(3) Torsional change analysis along the curved with speed.
Fig. 3 shows the relationship between the speed and the steering angle while driving. To detect the curved sections, the point at which the steering angle began changing was selected as the starting point of the curve. The speed hardly changes with the steering angle, suggesting that the kart maintains s constant speed along the curved section.
Fig. 3. Speed-steering angle in 1-lap
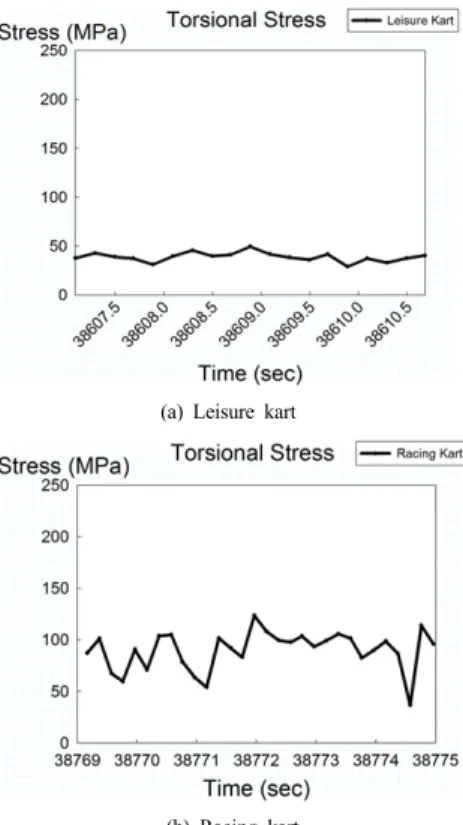
Fig. 4 shows the torsional stress of the frame with time while driving along an arbitrary curved section.
Section 1 Section 2
Section 3 Section 4
[MPa] Section 1 Section 2 Section 3 Section 4
20 km/h 36.746 ∼ 123.603 61.472 ∼ 118.115 49.366 ∼ 124.297 58.949 ∼ 118.368
30 km/h 3.063 ∼ 180.562 4.759 ∼ 187.689 5.108 ∼ 208.946 48.352 ∼ 163.783
40 km/h 27.915 ∼ 162.774 29.682 ∼ 193.492 51.632 ∼ 206.928 38.008 ∼ 202.449
Table 5. Torsional stress distribution acting on a racing kart’s frame on curved sections (a) Leisure kart
(b) Racing kart
Fig. 4. Torsional stress on curved section
The torsional stress of a leisure kart is smaller than and varies less than that of a racing kart when driving along a curve. Table 5 shows the torsional stress distribution acting on a racing kart’s frame on curved sections.
Fig. 5 shows the torsional stress acting on both types of karts; that acting on the racing kart is more than two times that acting on the leisure kart; the thick solid line indicates the maximum torsional stress of each type of kart at a certain speed.
Fig. 5. Torsional stress change for the speed
The dotted line indicates torsional stress data compensated after the measurement; the long and short dotted lines respectively indicate the racing and the leisure kart. In both cases, the torsional stress increases with speed.
4. Fatigue Strength Assessment of Kart Frame
4.1 Assessment method for fatigue strength The stress-life curve represents the relationship between the alternating stress (S) and the number of iterations (N) until a part is broken. A rotating bending test is used most commonly to obtain the data plotted in an S-N curve[5]. Log-log coordinates are used for the average S-N test data plotted on the S-N curve.
Materials have a certain endurance limit or fatigue limit (Se), below which they have infinite life. For industrial purposes, the limit has generally been considered as cycles.
Se (ksi) ≒ 0.5 × Su, Su ≤ 200 ksi
Se (ksi) ≒ 100 ksi, Su > 200 ksi (1)
The fatigue limit can be determined based on the tensile strength. The volume concept can be applied to fatigue test data obtained using a similar specimen. An axial load specimen has a more highly stressed volume because it does not have stress gradients. A fatigue limit ratio of 0.6 - 0.9 is obtained from the axial load and the rotation bending test. This test data may contain errors related to the eccentricity of the axial load.
Se (axial) ≒ 0.7Se (bending) (2)
Therefore, the following safety assessment is used.
A Fatigue limit ratio of 0.5 – 0.6 is obtained from the axial load and the rotation bending test. A theoretical value of 0.577 is given as the von Mises failure criterion. A reasonable estimate is obtained as follows.
Se (torsion) ≒ 0.577Se (bending) (3)
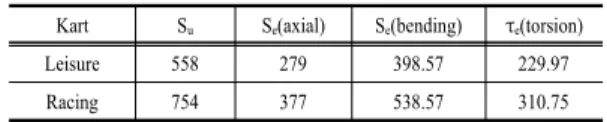
The torsional fatigue limit of kart frame can be obtained by applying these load effects. To predict the torsional stresses that affect the kart’s frame, the torsional fatigue limit was calculated based on the tensile test result and the load effect, as shown in Table 6. The torsional fatigue limit coefficient (K) is obtained as a ratio of the material's torsional fatigue limit to the measured torsional fatigue limit τ. For K ≤ 1, the actual acting torsional stress occurs in a smaller range than the endurance limit of the material. This does not causedt fatigue deformation and damage to the material, as a result of which its life can be infinite. On the other hand, for K > 1, damage is caused to the material by fatigue.
(4)
Kart Su Se(axial) Se(bending) τe(torsion)
Leisure 558 279 398.57 229.97
Racing 754 377 538.57 310.75
Table 6. Torsional stress distribution acting on a racing kart’s frame on curved section
4.2 Fatigue Stregth Evaluation
Table 7 shows the torsional stresses, measured torsional fatigue limit, and torsional fatigue limit coefficient (K) when driving at a speed of 40 km/h. Fig. 6 shows that the average torsional fatigue limit coefficient (K) tends to increase with the speed of the kart.
τe [MPa] 229.97
Section 1 2 3 4
τ 52.391 68.138 58.172 59.169
K 0.235 0.306 0.261 0.265
Table 7. Fatigue limit based on the stress (40km/h) (a) Leisure kart
τe [MPa] 229.97
Section 1 2 3 4
τ 162.774 193.492 206.928 202.449
K 0.524 0.623 0.666 0.651
(b) Racing kart
Fig. 6. Fatigue limit coefficient K based on the each speed
5. Conclusions
A Fatigue strength assessment was conducted based on measured results obtained when a kart was being driven on a track. Both leisure and racing karts showed lower torsional stress than the torsional endurance limit. Therefore, plastic deformation and fatigue damage did not occur in both karts when they were being driven along a curved section.
References
[1] Jang, H.T, “A Kinematic Analysis of Racing Kart Steering Mechanism”, Proc. of 1st KAIS Conference, pp.
1156-1158, 2010.
[2] C. Ponzo, F. Renzi, “Parametric Multi-Body Analysis of Kart Dynamics”, FISTA World Automotive Congress, Barcelona, Spain, May, 2004.
[3] E. Vitale, F. Frendo, E. Ghelard, A. Leoncini, “A Lumped Parameters Model for the Analysis of Kart Dynamics; the Role of Experimentation in the Automotive Product Development Process”, ATA 7th International Conference, Florence, May, 2001.
[4] Kang, G.H. and Kim, C.S., “Nonlinear Analysis of Rubber Bellows for the High Speed Railway Vehicle”, Journal of the Korea Academia-Industrial cooperation Society, Vol. 14, No. 8, pp. 3631-3637, 2013.
DOI: http://dx.doi.org/10.5762/KAIS.2013.14.8.3631 [5] Julie A. Bannantine, Jess J. Comer, James L, “Handrock,
Fundamentals of Metal Fatigue Analysis”, Prentice Hall, 1990.
Joon-Seong Lee [Regular member]
•Feb. 1988 : SungKyunKwan Univ.
MS
•Sep. 1995 : The University of Tokyo, Ph.D.
•July 1988 ~ July 1991 : Korea Military Academy, Faculty, Dept.
of Mechanical Eng., Professor
•March 1996 ∼ current : Kyonggi Univ. Dept. of Mechanical System Eng., Professor
<Research Interests>
Optimal Design, Neural Network, Integrity Evaluation
Seong-Gyu Cho [Associate member]
•Feb. 2016 : Kyonggi Univ. BS
•March 2016 ~ current : Kyonggi Univ. Graduate School, Dept. of Mechanical Eng.
<Research Interests>
3D Printing, Structural Analysis