1. IntroductIon
A Satellite Based Augmentation System (SBAS) is a Wide Area Differential Global Positioning System (WADGPS) that provides highly reliable and accurate positioning information to users. It has been regarded as an essential infrastructure in fields where high reliability is required such as airplane taking off and landing. The International Civil Aviation Organization (ICAO) designated a SBAS as an international standard for navigation safety and recommended all nations to comply with the SBAS.
The Wide Area Augmentation System (WAAS) in the
A Study of SBAS Position Domain Analysis Method: WAAS and EGNOS Performance Evaluation
Dong-Uk Kim
1, Deok-Hwa Han
1, Jung-Beom Kim
1, Hwi-Gyeom Kim
1, Chang-Don Kee
1†, Kwang-Sik Choi
2, Heon-Ho Choi
2, Eun-Sung Lee
21
Department of Mechanical and Aerospace Engineering and Institute of Advanced Aerospace Technology, Seoul National University, Seoul 151-744, Korea
2
Korea Aerospace Research Institute, Daejeon 305-806, Korea
ABStrAct
A Satellite Based Augmentation System (SBAS) is a system that provides positioning information with high and accurate reliability to users who require ensuring high safety such as airplane taking off and landing. A continuous performance evaluation on navigation safety facilities shall be performed to determine whether developed systems meet the required performance before and after the operation. In this paper, SBAS position domain analysis is discussed in relation to analysis items for performance evaluation. The performance evaluation on the SBAS in the position domain shall conduct analysis on accuracy, integrity, continuity, and availability, which are items in the required navigation performance (RNP). In the paper, position domain analysis was conducted with regard to the Wide Area Augmentation System (WAAS) in the USA and the European Geostationary Navigation Overlay Service (EGNOS), which were developed already and now under operation.
The analysis result showed that each of the systems satisfied the APV-I performance requirements recommended by the International Civil Aviation Organization (ICAO) with regard to daily data. It is necessary to verify using long-term data, whether the performance requirements in the RNP items are satisfied for system certification.
Keywords: SBAS, position domain performance, WAAS, EGNOS, RNP
USA, the European Geostationary Navigation Overlay Service (EGNOS) in Europe, and MTSAT Satellite based Augmentation System (MSAS) in Japan were developed and are now under operation, and the development of GPS Aided GEO Augmented Navigation (GAGAN) in India was completed and is now at an early stage of operation (Sin et al. 2014). South Korea has also started the development of Korea Augmentation Satellite System (KASS), which is a Korean-made SBAS initiated by the Ministry of Land, Infrastructure and Transport, and has aimed to provide the approach procedure with vertical guidance (APV-I) service of safety of life in 2022 (Nam 2015).
A SBAS, which is a navigation safety facility, requires a process of examination by certification authority regarding whether a developed system satisfies the required performance prior to system operation through the operation test and evaluation (OT&E) and its normal Received Oct 10, 2016 Revised Nov 11, 2016 Accepted Nov 12, 2016
†
Corresponding Author E-mail: [email protected]
Tel: +82-2-880-1912 Fax: +82-2-888-2069
operation is allowed only after approval from the authority.
A continuous performance evaluation is also required to be performed through offline monitoring (OM) even after system approval on whether the required performance is met or not. Han et al. (2016) proposed items to be analyzed and evaluated at the OT&E and OM as well as functions of element technologies for analysis on each item based on case studies on the WAAS and EGNOS developed and operated currently. Table 1 summarizes the element technologies to perform OT&E and OM. In the paper, position domain analysis method among the element technologies is introduced and performance evaluation on the position domain is performed through the performance analysis tool developed by our research team by utilizing the currently broadcast WAAS and EGNOS.
2. SBAS PoSItIon doMAIn AnALYSIS MEtHod
2.1 Required Navigation Performance (RNP)
Required Navigation Performance (RNP) refers to a standard of Performance Based Navigation (PBN) that shall
be satisfied by aircraft pilots or airlines over the designated air space. The ICAO published the SARPs (international standards and recommended practice), which are SBAS and RNP related standards. In the SARPs, required performances on items of accuracy, integrity, continuity, and availability are specified according to operation mode.
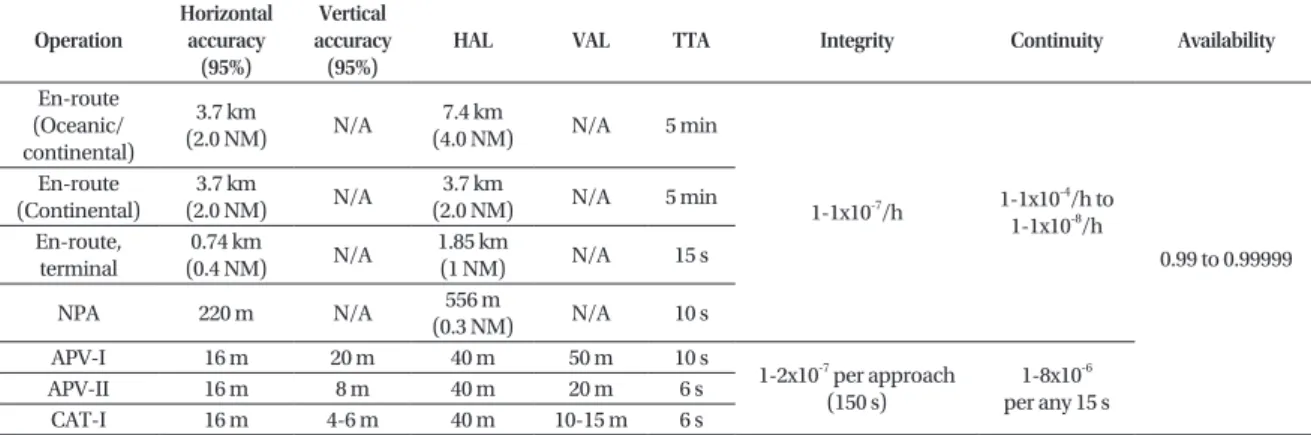
Table 2 presents the performance requirements for each operation mode specified in the ICAO SARPs. Among them, an SBAS is developed to satisfy the APV-I or higher performance requirements by which aircrafts can take off and land (ICAO 2006).
2.2 Position Error (PE) and Protection Level (PL)
SBAS users determine a position error (PE) and a protection level (PL) which is a confidence level of position error by using User Differential Range Error (UDRE) and Grid Ionospheric Vertical Error (GIVE), which are integrity information, and pseudorange residual calculated using the tropospheric delay correction model and correction information in relation to SBAS satellites and the ionosphere. A variance of pseudorange residual error for the calculation of a protection level can be expressed as presented in the following equation.
σ
range2= σ
2fit+ σ
UIRE2+ σ
air2+ σ
2tropo(1)
σ
2fitand σ
UIRE2are calculated through integrity information of satellite and the ionosphere, respectively, and σ
2tropoemploys a modeling value with regard to satellite elevation angle. σ
air2refers to a variance of multipath and noise of pseudorange measurement. σ
2rangecalculated via Eq. (1) refers to a standard deviation in the range domain, which needs a process of orthogonal projection into the position domain. An orthogonal projection into the position domain is conducted through the following process according to a geometric layout of satellites.
Table 1. Element technology for SBAS OT&E and OM.
Element Analysis list
CNMP analysis CNMP processing
CNMP validation analysis Range domain analysis UDRE bounding analysis
GIVE bounding analysis Range error bounding analysis Position domain analysis Position service accuracy analysis
Position service integrity analysis Position service continuity analysis Position service availability analysis
GEO analysis GEO signal analysis
GEO message analysis Loss of lock analysis
Ionospheric threat model analysis Threat model validation analysis
Table 2. Performance requirements in ICAO SARPs (ICAO 2006).
Operation Horizontal accuracy
(95%)
Vertical accuracy (95%)
HAL VAL TTA Integrity Continuity Availability
En-route (Oceanic/
continental)
3.7 km
(2.0 NM) N/A 7.4 km
(4.0 NM) N/A 5 min
1-1x10
-7/h 1-1x10
-4/h to 1-1x10
-8/h
0.99 to 0.99999 En-route
(Continental) 3.7 km
(2.0 NM) N/A 3.7 km
(2.0 NM) N/A 5 min
En-route,
terminal 0.74 km
(0.4 NM) N/A 1.85 km
(1 NM) N/A 15 s
NPA 220 m N/A 556 m
(0.3 NM) N/A 10 s
APV-I 16 m 20 m 40 m 50 m 10 s
1-2x10
-7per approach
(150 s) 1-8x10
-6per any 15 s
APV-II 16 m 8 m 40 m 20 m 6 s
CAT-I 16 m 4-6 m 40 m 10-15 m 6 s
( )
2 1 2
2 2
east EN EU ET
T EN north NU NT
EU NU up UT
ET NT UT T
d d d d
d d d d
G WG d d d d
d d d d
−
=
(2)
Matrix G in Eq. (2) refers to an observation matrix calculated with the elevation and azimuth of satellite, and matrix W refers to a weight matrix calculated from σ
range2.
[ cos sin cos cos sin 1 ]
i i i i i i
th
G El Az El Az El
i row of G
= − − −
= (3)
1
2 2
0 0
0 0
1/
0 0
i i
n
w
W w where w
w
σ
= =
(4)
Finally, Horizontal Protection Level (HPL) and Vertical Protection Level (VPL) of SBAS user can be calculated via Eq. (5). d
majorand d
uprefer to error uncertainties with regard to semi-major axis and vertical axis of the error ellipse. K
Hand K
Vdetermine a significance level of protection level, which is given to 6.0 and 5.33, respectively in the precision approach (PA) mode for aviation.
2 2 2 2 2
2 2
2H major
V up
east north east north
major EN
HPL K d VPL K d
d d d d
where d d
= ⋅
= ⋅
+ −
= + +
2 2 2 2 2
2 2
2H major
V up
east north east north
major EN
HPL K d VPL K d
d d d d
where d d
= ⋅
= ⋅
+ −
= + +
(5)
A position error of SBAS user can be calculated by orthogonal projection of ΔPR, which is a pseudorange residual calculated at the range domain, into position domain as shown in Eq. (6).
1
2 2
( )
(1) (2) (3)
T T
X G WG G W PR
HPE X X
VPE X
∆ =
−⋅ ∆
= ∆ + ∆
= ∆ (6)
The detailed algorithm about how to determine a position error and protection level of SBAS user is presented in the appendix of minimum operational performance standards DO-229D published by the Radio Technical Commission for Aeronautics (RTCA 2006) and the calculation algorithm is one of the main functions that should be included in the SBAS position domain analysis.
2.3 SBAS Position Domain Analysis Method
In order to verify whether an SBAS system satisfies the navigation performance requirements specified by the ICAO, analysis on accuracy, integrity, continuity, and availability defined as items in the RNP should be performed. We investigated the definition and analysis method about the four RNP items and outcome results through periodical performance analysis report provided by the WAAS and the EGNOS as well as ICAO SARPs (ICAO 2006), WAAS Performance Standard (FAA 2008), and EGNOS Safety of Life Document (ESSP 2014), which are official documents in relation to SBAS performance analysis (Han et al. 2016). In the present section, the definition and analysis method on the four RNP items (accuracy, integrity, continuity, and availability) are described.
Accuracy is an item that evaluates an error between real position and calculated position by the system and the requirement is defined as 95% accuracy with regard to horizontal and vertical positioning errors. In the position service accuracy analysis, thus, statistics of user's positioning error, in which correction information of SBAS is applied, is calculated, and whether daily horizontal and vertical 95% accuracy exceeds a value specified in the RNP performance requirement is verified.
Integrity is a basis that determines whether information provided by the system is reliable or not. It refers to a capability that provides alerts to users within an appropriate time when a problem occurs during system operation. In the position service integrity analysis module, whether a PE exceeds a PL is verified first. If a PL does not bound a PE appropriately, it indicates an occurrence of out-of- tolerance, in which whether an alert is triggered within a time-to-alert (TTA) that is an allowable time defined as user requirements should also be verified together. If an alert is not provided within a TTA even though out-of-tolerance occurs, it is thought that integrity event occurs. If a case where a PE is exceeded the alert limit (AL) that indicates a maximum allowable positioning error persists beyond the TTA, it is deemed that Hazardously Misleading Information (HMI) was generated. The occurrence of HMI is closely related to a frequency of integrity risk occurrence, which is the performance requirement of integrity specified in the ICAO. If an alert is failed within the TTA for users in case of HMI occurrence, it is deemed that integrity risk occurred.
Since this situation could incur serious risk to user safety,
the ICAO specified this as extremely low probability as
small as 10-7 level. Thus, by checking whether integrity risk
occurred or not through the HMI analysis along with the
check on whether integrity event occurred, the position
service integrity analysis module determined whether
the check result exceeds a value specified in the RNP
performance requirement.
Continuity refers to a capability that can operate a system continuously without unexpected interruption after initial operation of the system starts. Since verification on all systems including hardware should be performed in the item of continuity, continuity was excluded in the analysis items in this study.
Availability is an item that represents a time ratio that satisfies all performance requirements of accuracy, integrity, and continuity. However, since it is difficult to calculate a time ratio that satisfies performance requirements of all items in a short period of time, the WAAS and EGNOS specify that mean service availability where the PL is smaller than the AL for 24 hours is evaluated. Thus, the position service availability analysis module calculates daily mean service availability and verifies whether the calculated availability exceeds the value specified in the RNP performance requirements. Furthermore, a coverage in which the SBAS service can be provided is verified through availability analysis on grid users defined with regard to the service domain.
3. SBAS PoSItIon doMAIn AnALYSIS rESuLt
3.1 Analysis Data Selection
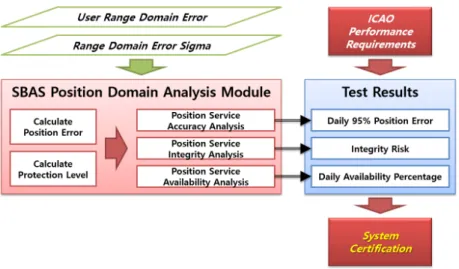
Fig. 1 shows a schematic diagram of the SBAS position domain analysis module developed by our research team.
In this study, PE and PL were calculated by projecting pseudorange residual and standard deviation calculated in the range domain analysis module into the position domain. Furthermore, performances of accuracy, integrity,
and availability of SBAS users were evaluated and then, whether the performances satisfy the ICAO performance requirements was analyzed. The EGNOS provides APV-I service, and the WAAS provides LPV-200 service, which is similar to APV-I but the vertical performance requirement was strengthened in. The present study analyzed whether both of the WAAS and EGNOS satisfied the APV-I performance requirements.
For data used to analyze the performance of SBAS position domain, currently available data used in the WAAS in the USA and the EGNOS data in Europe were selected.
The WAAS and EGNOS provide SBAS correction messages by the RINEX format through FTP servers. The date of the data used was August 15, 2016 and PE and PL were calculated through SBAS messages parsed in every one sec. Locations of WAAS and EGNOS users were assumed at (N40°, W100°) and (N50°, 0°) (refer to Fig. 2).
The purpose of the study is focused on presenting performance analysis method of each RNP item and case study on outputs rather than providing accurate performance analysis results in position domain. Thus, performance analysis results in the position domain were derived through daily data processing and whether the performance requirements were met or not was verified.
The results in this study do not represent a level of performance in real systems so it is necessary to perform the method proposed in this paper for a long-term basis to conduct system certification.
Since this study did not aim to calculate an accurate
position error, pseudorange residual errors were not
calculated from measurement data in a real receiver but
residual errors of satellite, the ionosphere, and tropospheric
delay errors that were corrected from real SBAS messages
were calculated directly to acquire a pseudorange residual
Fig. 1. SBAS position domain analysis module diagram.
error. For satellite-related residual errors, a satellite position calculated by broadcasting ephemeris was corrected into SBAS satellite correction and then the error was calculated based on a difference compared to that of the precise orbit coordinate. The ionospheric delay residual error was calculated by correcting slant ionospheric delay generated from the IONEX precise ionosphere data using SBAS ionosphere correction and then a residual error was calculated. The tropospheric delay residual error was corrected by correcting slant tropospheric delay generated from the Saastamoinen model using SBAS tropospheric model and then a residual error was calculated.
3.2 Position Service Accuracy Analysis Results
The position service accuracy analysis module aims to calculate statistics of a mean of user position error, standard deviation, RMS error, 95% cumulative error, 99% cumulative error, and maximum error, and show time-history graphs and histograms of horizontal and vertical position errors (HPE/VPE). It also verifies whether the calculated 95%
accuracy satisfies the ICAO performance requirements.
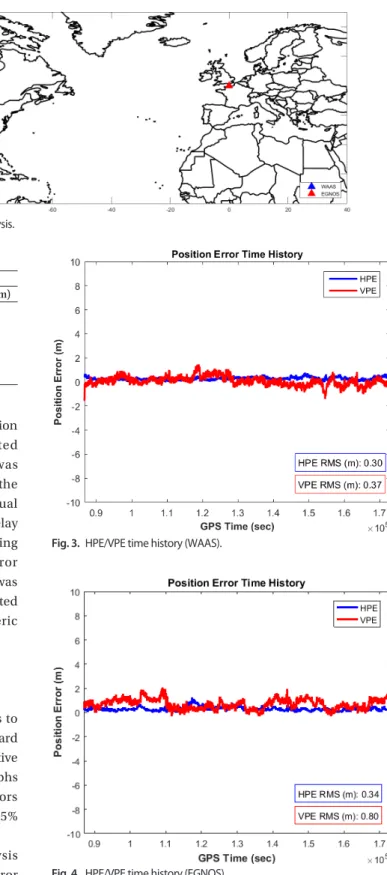
Table 3 presents the accuracy performance analysis results in the WAAS and EGNOS. A 95% cumulative error of WAAS users was calculated as horizontal 0.49 m and vertical 0.78 m while a 95% cumulative error of EGNOS users was calculated as horizontal 0.60 m and vertical 1.34 m, indicating both of them satisfied APV-I accuracy-related requirements in the corresponding analysis date.
Figs. 3 and 4 show HPE/VPE time histories in the WAAS and EGNOS, respectively. Figs. 5 and 6 show PE distribution histograms in the WAAS and EGNOS, respectively. 1 sigma- normalized PE is also depicted along with PE distribution.
Fig. 2. WAAS and EGNOS user location for performance analysis.
Table 3. Accuracy analysis results.
Accuracy WAAS EGNOS
Horizontal (m) Vertical (m) Horizontal (m) Vertical (m)
Mean
STD RMS 95%
99%
Maximum
0.276 0.119 0.301 0.489 0.589 0.783
0.080 0.366 0.375 0.783 1.047 1.561
0.294 0.164 0.337 0.602 0.848 1.208
0.691 0.403 0.800 1.340 1.653 2.085
Fig. 3. HPE/VPE time history (WAAS).
Fig. 4. HPE/VPE time history (EGNOS).
As the normalized PE distribution becomes narrower, the system is safer.
3.3 Position Service Integrity Analysis Results
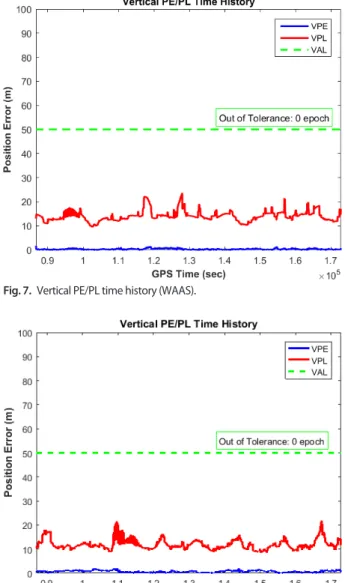
In the position service integrity analysis module, statistics of out-of-tolerance occurrence are calculated to verify whether a protection level bounds position error appropriately and whether an alert was generated to users within the TTA when out-of-tolerance occurs. Whether integrity risk occurs or not is also verified through HMI analysis.
Figs. 7 and 8 show PE/PL time histories in the WAAS and EGNOS, respectively, in which whether out-of-tolerance occurs or not can be verifiable intuitively. It was verified that out-of-tolerance did not occur in both of the systems.
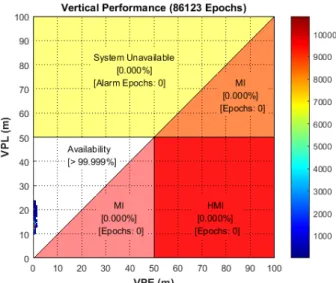
Figs. 9 and 10 show Stanford plots of the WAAS and
EGNOS, respectively. A Stanford plot expresses the number of epochs of corresponding (PE, PL) values using color pixels, with PE as the X axis and PL as the Y-axis. The use of Stanford plot is advantageous to verify whether frequencies of misleading information and HMI occurrence can be checked intuitively. Upon the occurrence of HMI, whether it is alarmed to users within the TTA time should also be analyzed. If an alert was not generated upon the occurrence of HMI, integrity risk occurs, so it is not possible to satisfy the integrity performance requirement. The analysis result showed that both of the WAAS and EGNOS had no integrity problem for 24 hours in the corresponding date.
3.4 Position Service Availability Analysis Results
The position service availability analysis module aims to calculate a user's 99% PL and mean service availability and Fig. 5. VPE distribution histogram (WAAS). Fig. 7. Vertical PE/PL time history (WAAS).
Fig. 6. VPE distribution histogram (EGNOS). Fig. 8. Vertical PE/PL time history (EGNOS).
evaluate availability of grid users within the SBAS service area, thereby displaying an availability coverage map. It also verifies whether the calculated service availability satisfies the performance requirements.
Table 4 presents the availability performance analysis results in the WAAS and EGNOS. We verified that both of the systems satisfied the APV-I availability performance requirements at the corresponding analysis date.
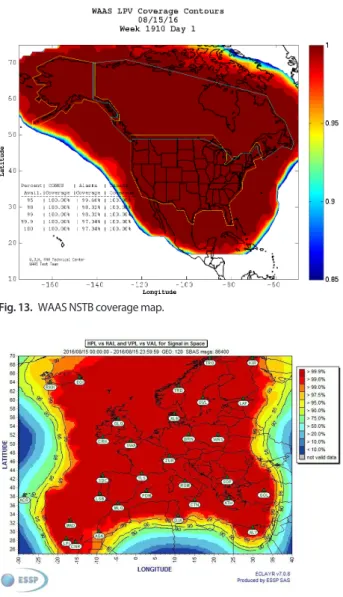
Figs. 11 and 12 show availability coverage maps in the WAAS and EGNOS, respectively. The coverage analysis produced results by evaluating users with a gap of 2.5°
in longitude and latitude respectively. Web sites of the
WAAS NSTB in the Federal Aviation Administration (FAA) in the USA and EGNOS User Support in the European Satellite Services Provider (ESSP) in Europe analyze daily service coverage map and provide the analysis results continuously. We verified whether correct coverage was calculated by comparing the coverage (refer to Figs. 13 and 14), provided by each institution at the corresponding date and availability coverage analyzed by the tool developed in the present study, and found that 99% coverage boundary was consistent.
4. concLuSIonS
This paper presented the RNP performance analysis items for SBAS position domain analysis and summarized analysis method and outcome results for each item. We also conducted performance analysis on users of the WAAS in the USA and EGNOS in Europe through the SBAS position domain analysis tool developed by our research team.
The analysis result showed that both of currently running WAAS and EGNOS satisfied APV-I accuracy, integrity, and availability performance requirements suggested by the ICAO.
Whether the RNP performance requirements are met or not daily does not mean a level of system performance.
Fig. 9. Stanford plot: vertical performance (WAAS).
Fig. 11. Availability coverage map (WAAS).
Fig. 12. Availability coverage map (EGNOS).
Fig. 10. Stanford plot: vertical performance (EGNOS).
Table 4. Availability analysis results.
Availability WAAS EGNOS