http://dx.doi.org/10.5468/ogs.2016.59.1.9 pISSN 2287-8572 · eISSN 2287-8580
Introduction
Recently the number and incidence of multiple pregnancy has been on the rise due to the delayed childbearing age and advancing assisted reproductive technology [1,2]. According to the 2013 Korea Institute for Health and Social Affairs data, the incidence of the multiple pregnancy increased from 2.02%
in 2003 to 3.29% by 2013 [3].
Twin pregnancy, in comparison to singletons, is associated with increased complication risks in both mother and neonates
Gestational age at delivery and neonatal outcome in uncomplicated twin pregnancies: what is the optimal gestational age for delivery according to chorionicity?
Hye-Jung Lee, Soo Hyun Kim, Kylie Hae-Jin Chang, Ji-Hee Sung, Suk-Joo Choi, Soo-young Oh, Cheong-Rae Roh, Jong-Hwa Kim
Department of Obstetrics and Gynecology, Samsung Medical Center, Sungkyunkwan University School of Medicine, Seoul, Korea
Objective
To investigate the neonatal outcome according to the gestational age at delivery and to determine the optimal timing for delivery in uncomplicated monochorionic and dichorionic twin pregnancies.
Methods
This is a retrospective cohort study of women with uncomplicated twin pregnancies delivered at or beyond 35 weeks of gestation from 1995 to 2013. The primary outcome was neonatal composite morbidity, which was defined as when either one or both twins have one or more of the followings: fetal death after 35 weeks gestation, admission to neonatal intensive care unit, mechanical ventilator requirement, respiratory distress syndrome and neonatal death. To determine the optimal gestational age for delivery according to chorionicity, we compared the neonatal composite morbidity rate between women who delivered and women who remained undelivered at each gestational week in both monochorionic and dichorionic twin pregnancies.
Results
A total of 697 twin pregnancies were included (171 monochorionic and 526 dichorionic twins). The neonatal composite morbidity rate significantly decreased with advancing gestational age at delivery and its nadir was observed at 38 and ≥39 weeks of gestation in monochorionic and dichorionic twins, respectively. However, the composite morbidity rate did not differ between women who delivered and women who remained undelivered ≥36 and ≥37 weeks in monochorionic and dichorionic twins, respectively.
Conclusion
Our data suggest that the optimal gestational age for delivery was at ≥36 and ≥37 weeks in uncomplicated monochorionic and dichorionic twin pregnancies, respectively.
Keywords: Delivery; Dichorionic; Gestational age; Monochorionic; Twins
Received: 2015.6.16. Revised: 2015.8.17. Accepted: 2015.8.25.
Corresponding author: Suk-Joo Choi
Department of Obstetrics and Gynecology, Samsung Medical Center, Sungkyunkwan University School of Medicine, 81 Irwon-ro, Gangnam- gu, Seoul 06351, Korea
Tel: +82-2-3410-3546 Fax: +82-2-3410-0630 E-mail: [email protected] http://orcid.org/0000-0002-8946-4789
Articles published in Obstet Gynecol Sci are open-access, distributed under the terms of the Creative Commons Attribution Non-Commercial License (http://creativecommons.
org/licenses/by-nc/3.0/) which permits unrestricted non-commercial use, distribution, and reproduction in any medium, provided the original work is properly cited.
Copyright © 2016 Korean Society of Obstetrics and Gynecology
including perinatal morbidity and mortality. Twin pregnancy itself is attributable to higher rates of preterm delivery, respi- ratory problem and low birth weight [4-6]. Gestational age at delivery is the single most important factor affecting the neonatal outcome and perinatal mortality in both singleton and twin pregnancies [7,8]. Preterm birth is a leading cause of death and complications in the neonatal period and poor out- comes in childhood [9]. The optimal duration for pregnancy maintenance appears to be shorter in twins, compared with singleton pregnancies [10]. Here the question rises—when is the optimal time to deliver in twin pregnancies? In the ab- sence of significant maternal or fetal complications, it is rea- sonable to continue the pregnancy for sufficient maturation in order to avoid neonatal complication. In another words, the ideal time for delivery of a pregnancy should be when the risk for neonatal morbidity and mortality is lowest but before the risk for stillbirth begins to substantially rise [11].
Although there have been many studies performed to de- termine the optimal delivery time for twin pregnancy, the results are controversial and unsatisfying [12,13]. In this study, we analyzed the neonatal outcome according to gestational age at delivery in uncomplicated twin pregnancies based on the Korean data in order to determine the optimal time for delivery in uncomplicated monochorionic and dichorionic twin pregnancies.
Materials and methods
This is a retrospective cohort study of women with twin pregnancies delivered at a tertiary referral hospital in Seoul, Korea from January 1995 to December 2013. The study was approved by institutional review board of Samsung Medical Center. All women with uncomplicated monochorionic and dichorionic twin pregnancies who delivered at our center after 35 weeks of gestation were included. Twin pregnancies com- plicated by twin-to-twin transfusion syndrome, monoamnionic twins, discordant twins, intrauterine fetal growth restriction, preterm labor, preterm premature rupture of membranes, placenta abruption, placenta previa, hypertension (gestational hypertension, preeclampsia, eclampsia, superimposed pre- eclampsia, and chronic hypertension), diabetes (gestational diabetes and overt diabetes), presence of other severe mater- nal medical diseases, fetal death before 35 weeks of gestation or chromosomal anomalies or major congenital malformation
in one or more of twins were excluded. Major fetal congenital malformation was defined as that requires medical or surgical treatment after birth. Discordant twin was defined as inter- twin weight discordance of more than 20%.
Maternal demographic characteristics included parity, use of assisted reproductive technology and chorionicity. Chorionicity was determined by early sonographic findings such as gesta- tional sac number, placental number, the presence of either
“twin-peak” or “T” sign and fetal gender and this was later confirmed through pathologic examination of the placenta.
All patients established an accurate gestational age through first trimester ultrasound. Pregnancy outcome included ges- tational age at delivery, mode of delivery, and indications for cesarean section.
Neonatal outcome measures were collected and analyzed, which included gender, birth weight, Apgar scores, fetal death in utero (FDIU), admission to neonatal intensive care unit (NICU), mechanical ventilator support, respiratory distress syndrome (RDS) and neonatal mortality. RDS was defined as the presence of respiratory grunting and retracting, an increased oxygen requirement (FiO2 >0.4) combined with ground-glass appear- ance and air bronchograms on chest X-ray. Neonatal composite morbidity was defined as having one or more of the following:
FDIU, NICU admission, RDS and neonatal mortality.
The unit of analysis for neonatal outcomes was the twin pair when either one or both twins have the outcome. The out- come was analyzed and compared according to gestational
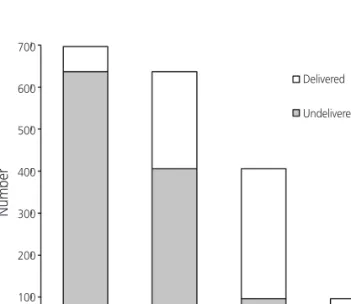
Fig. 1. Numbers of patients with uncomplicated twin pregnancies:
delivered and undelivered at each gestational week.
35 36 37 38 Delivered Undelivered 700
600 500 400 300 200 100
0
Gestational age (wk)
Number
age at delivery (35, 36, 37, 38, and ≥39 weeks) and chorionic- ity. The analysis of variance was used to compare continuous variables and the Jonckheere-Terpstra test was used to identify the trends. Proportions were compared using the chi-square test and linear-by-linear association was used to identify trends. To determine the optimal gestational age for delivery, we compared the neonatal composite morbidity rate between women who delivered and women who remained undelivered at each gestational weeks (Fig. 1). For example, the compari- son was done between 60 women who delivered at 35 weeks of gestation and 637 women who remained undelivered at 35 weeks and delivered at or beyond 36 weeks of gestation.
The comparison was repeated at each advancing gestational week. The results were considered statistically significant for P-value <0.05. Statistical analyses were conducted using IBM SPSS ver. 20 (IBM Corp., Armonk, NY, USA).
Results
A total of 1,695 women with twin pregnancies were recorded during the 19 years of study period. Among them, 998
(58.9%) pregnancies were excluded by the aforementioned criteria and 697 (41.1%) uncomplicated twin pregnancies were included in the final study population. Among them, 171 (24.5%) were monochorionic and 526 (75.4%) were di- chorionic twins.
Among the 697 women with uncomplicated twin preg- nancy, 60 (20 monochorionic and 40 dichorionic) delivered at 35 weeks of gestation, 231 (61 monochorionic and 170 dichorionic) delivered at 36 weeks of gestation, 310 (68 monochorionic and 242 dichorionic) delivered at 37 weeks of gestation, 79 (16 monochorionic and 63 dichorionic) delivered at 38 weeks and remaining 17 (6 monochorionic and 11 di- chorionic) delivered at ≥39 weeks of gestation.
The maternal characteristics and pregnancy outcome of twin pregnancies delivered at each gestational week are shown in Table 1. The five groups were similar in terms of maternal age, parity, and assisted reproductive technology performance.
However, the cesarean delivery rate decreased significantly as gestational age advanced, which was significantly less com- mon after 38 weeks of gestation. The rate of cesarean section due to previous cesarean section or uterine surgery decreased significantly with advancing gestational age at delivery, which
Table 1. Maternal characteristics and pregnancy outcome according to GA at delivery 35 wk
(n=60) 36 wk
(n=231) 37 wk
(n=310) 38 wk
(n=79) ≥39 wk
(n=17) P-valuea) P-valueb)
Age (yr) 32.8±4.7 31.8±3.8 31.9±3.4 31.8±3.9 30.1±3.2 0.113 0.237
Multiparity 23 (38.3) 59 (25.5) 79 (25.5) 16 (20.3) 5 (29.4) 0.181 0.098
ART 25 (41.7) 104 (45.0) 155 (50.0) 40 (50.6) 8 (47.1) 0.650 0.184
Chorionicity 0.205 0.143
Monochorionic 20 (33.3) 61 (26.4) 68 (21.9) 16 (20.3) 6 (35.3)
Dichorionic 40 (66.7) 170 (73.6) 242 (78.1) 63 (79.7) 11 (64.7)
GA at delivery (wk) 35.6±1.8 36.5±1.9 37.3±1.9 38.3±1.7 39.4±3.6 <0.001 <0.001
CS 59 (98.3) 227 (98.3) 289 (93.2) 62 (78.5) 9 (52.9) <0.001 <0.001
Indications for CS <0.001 <0.001
Previous CS or uterine surgery 8 (13.6) 25 (11.0) 36 (12.5) 1 (1.6) 0 (0)
Electivec) 24 (40.7) 89 (39.2) 72 (24.9) 21 (33.9) 3 (33.3)
Malpresentationd) 23 (39.0) 110 (48.5) 172 (59.5) 27 (43.5) 1 (11.1)
Failure to progress 1 (1.7) 2 (0.9) 8 (2.8) 13 (21.0) 4 (44.4)
Nonreassuring fetal status 3 (5.1) 1 (0.4) 1 (0.3) 0 (0) 1 (11.1)
Data are presented as mean±standard deviation or number (%).
GA, gestational age; ART, assisted reproduction techniques; CS, cesarean section.
a)Analysis of variance for continuous variables and chi-square test for categorical variables; b)Jonckheere-Terpstra test for continuous variables and linear-by-linear regression for categorical variables; c)When both twins had vertex presentation; d)When one or both twins had non-vertex presentation.
was significantly less common after 38 weeks of gestation.
The rate of elective cesarean section for co-vertex twins (when both twins had vertex presentation) was not significantly dif- ferent among the groups, but the rate of cesarean section for malpresentation twins (when one or both twins had non- vertex presentation) was significantly less common after 39
weeks of gestation. The rate of cesarean section due to failure to progress and nonreassuring fetal status significantly in- creased after 38 and 39 weeks of gestation, respectively.
The neonatal outcomes according to gestational age at delivery are described in Table 2. There were no differences in 1 minute Apgar score less than 4- and 5-minute Apgar score
Table 2. Neonatal outcome according to gestational age at delivery35 wk 36 wk 37 wk 38 wk ≥39 wk P-valuea) P-valueb)
All neonates (n=60) (n=231) (n=310) (n=79) (n=17)
Fetal death in utero 2 (3.3) 0 (0) 2 (0.6) 0 (0) 0 (0) 0.042 0.133
1-Minute Apgar score <4 0 (0) 4 (1.7) 4 (1.3) 0 (0) 1 (5.9) 0.290 0.681
5-Minute Apgar score <7 0 (0) 1 (0.4) 3 (1.0) 0 (0) 1 (5.9) 0.095 0.166
NICU admission 25 (43.1) 40 (17.3) 28 (9.1) 4 (5.1) 1 (5.9) <0.001 <0.001
Mechanical ventilator support 7 (11.7) 6 (2.6) 3 (1.0) 0 (0) 1 (5.9) <0.001 0.001
Respiratory distress syndrome 6 (10.0) 1 (0.4) 0 (0) 0 (0) 0 (0) <0.001 <0.001
Neonatal mortality 0 (0) 1 (0.4) 0 (0) 0 (0) 1 (5.9) <0.001 0.175
Perinatal mortality 2 (3.3) 1 (0.4) 2 (0.6) 0 (0) 1 (5.9) 0.031 0.657
Composite morbidityc) 29 (48.3) 39 (16.9) 31 (10.0) 4 (5.1) 1 (5.9) <0.001 <0.001
Monochorionic (n=20) (n=61) (n=68) (n=16) (n=6)
Fetal death in utero 1 (5.0) 0 (0) 0 (0) 0 (0) 0 (0) 0.108 0.093
1-Minute Apgar score <4 0 (0) 1 (1.6) 0 (0) 0 (0) 1 (16.7) 0.008 0.160
5-Minute Apgar score <7 0 (0) 1 (1.6) 1 (1.5) 0 (0) 1 (16.7) 0.077 0.157
NICU admission 7 (36.8) 15 (24.6) 9 (13.2) 2 (12.5) 1 (16.7) 0.151 0.027
Mechanical ventilator support 2 (10.0) 2 (3.3) 1 (1.5) 0 (0) 1 (16.7) 0.137 0.524
Respiratory distress syndrome 2 (10.0) 0 (0) 0 (0) 0 (0) 0 (0) 0.004 0.017
Neonatal mortality 0 (0) 1 (1.6) 0 (0) 0 (0) 1 (16.7) 0.008 0.160
Perinatal mortality 1 (5.0) 1 (1.6) 0 (0) 0 (0) 1 (16.7) 0.033 0.862
Composite morbidityc) 9 (45.0) 15 (24.6) 9 (13.2) 2 (12.5) 1 (16.7) 0.031 0.006
Dichorionic (n=40) (n=170) (n=242) (n=63) (n=11)
Fetal death in utero 1 (2.5) 0 (0) 2 (0.8) 0 (0) 0 (0) 0.366 0.474
1-Minute Apgar score <4 0 (0) 3 (1.8) 4 (1.7) 0 (0) 0 (0) 0.740 0.723
5-Minute Apgar score <7 0 (0) 0 (0) 2 (0.8) 0 (0) 0 (0) 0.669 0.603
NICU admission 18 (46.2) 25 (14.7) 19 (7.9) 2 (3.2) 0 (0) <0.001 <0.001
Mechanical ventilator support 5 (12.5) 4 (2.4) 2 (0.8) 0 (0) 0 (0) <0.001 <0.001
Respiratory distress syndrome 4 (10.0) 1 (0.6) 0 (0) 0 (0) 0 (0) <0.001 <0.001
Neonatal mortality 0 (0) 0 (0) 0 (0) 0 (0) 0 (0) - -
Perinatal mortality 1 (2.5) 0 (0) 2 (0.8) 0 (0) 0 (0) 0.366 0.474
Composite morbidityc) 20 (50.0) 24 (14.1) 22 (9.1) 2 (3.2) 0 (0) <0.001 <0.001
Data are presented as number (%).
NICU, neonatal intensive care unit.
a)Analysis of variance or chi-square test; b)Jonckheere-Terpstra test for continuous variables and linear-by-linear regression for categorical vari- ables; c)Defined as having one or more of the following: NICU admission, mechanical ventilator support, respiratory distress syndrome, neona- tal mortality and fetal death in utero.
less than 7 among all five groups. None of twins delivered at
≥37 weeks of gestation had RDS. There were 4 cases of FDIU, and 2 cases of neonatal mortality. The rate of FDIU, neonatal mortality and perinatal mortality was significantly different among five groups, but there was no statistically significant correlation with its rate and advancing gestational age.
In monochorionic twins, the rate of NICU admission, RDS and neonatal composite morbidity significantly decreased with advancing gestational age at delivery. The nadir of composite morbidity rate was observed at 38 weeks of gestation. There was one neonatal mortality case in a woman with monocho- rionic twin pregnancy who delivered at 40 weeks and 5 days by emergency cesarean section due fetal distress during spon- taneous labor. The first twin was healthy at birth and survived, but the second twin expired due to hypoxic encephalopathy.
In dichorionic twins, the rate of NICU admission, mechani- cal ventilator support, RDS and neonatal composite morbidity significantly decreased with advancing gestational age at de- livery. The nadir of composite morbidity rate was observed at
≥39 weeks of gestation, where there was no NICU admission, neonatal morbidity or mortality.
The results of the neonatal composite morbidity rate com- parison between women who delivered and women who remained undelivered at each gestational week are shown in Table 3. In monochorionic twins, the neonatal composite mor- bidity rate was significantly higher among twins delivered at 35 weeks’ gestation compared to those undelivered and were
born after 35 weeks. However, the neonatal composite mor- bidity rates were similar between delivered and undelivered cases at 36, 37, and 38 weeks of gestation. In dichorionic twins, the neonatal composite morbidity rate of twins deliv- ered at 35 and 36 weeks of gestation was higher than that of twins compared to those undelivered at this gestational week.
This composite morbidity difference became insignificant between delivered and undelivered groups at or beyond 37 weeks of gestation.
Discussion
In this study, we have reviewed the 697 cases of uncomplicat- ed twin pregnancies and investigated maternal and neonatal outcomes to determine the optimal delivery time in uncompli- cated twin pregnancies. Our results suggest that the optimal delivery time may be at or beyond 36 weeks for monochori- onic twins, and at or beyond 37 weeks for dichorionic twins, considering the similar neonatal composite morbidity after this period regardless of delivery.
Currently the optimal timing of delivery of twin pregnancy is still controversial, with some experts suggesting preterm or early-term delivery to avoid late stillbirth risk, while others sup- port maintaining pregnancy to decrease the prematurity re- lated neonatal morbidities [14]. Some studies have suggested that twins mature faster than singletons, and, therefore, may
Table 3. Neonatal composite morbidity of twins delivered versus undelivered at each gestational weekGA (wk) Delivered Undelivered OR (95% CI) P-value
All 35 29/60 (48.3) 75/637 (11.8) 7.010 (4.001–12.281) <0.001
36 39/231 (16.9) 36/406 (8.9) 2.088 (1.285–3.392) 0.003
37 31/310 (10.0) 5/96 (5.2) 2.022 (0.764–5.355) 0.149
38 4/79 (5.1) 1/17 (5.9) 0.853 (0.089–8.151) 1.000
Monochorionic 35 9/20 (45.0) 27/151 (17.9) 3.758 (1.418–9.554) 0.005
36 15/61 (24.6) 12/90 (13.3) 2.120 (0.913–4.920) 0.077
37 9/68 (13.2) 3/22 (13.6) 0.966 (0.237–3.938) 1.000
38 2/16 (12.5) 1/6 (16.7) 0.714 (0.053–9.700) 1.000
Dichorionic 35 20/40 (50.0) 48/486 (9.9) 9.125 (4.587–18.151) <0.001
36 24/170 (14.1) 24/316 (7.6) 2.000 (1.098–3.643) 0.022
37 20/242 (9.1) 2/74 (2.7) 3.600 (0.826–15.685) 0.069
38 2/63 (3.2) 0/11 (0) Not available 1.000
Values are presented as number (%).
GA, gestational age; OR, odds ratio; CI, confidence interval.