Korean Journal of Remote Sensing, Vol.35, No.6-4, 2019, pp.1373~1389
https://doi.org/10.7780/kjrs.2019.35.6.4.7 ISSN 1225-6161 ( Print )
ISSN 2287-9307 (Online)
Article
KOMPSAT-5 후방산란계수의 보정식 산출 및 적용을 통한 해상풍 산출 결과 개선
장재철 1)·박경애 2)†·양도철3)·이선구4)
Improvement of KOMPSAT-5 Sea Surface Wind with Correction Equation Retrieval and Application of Backscattering Coefficient
Jae-Cheol Jang
1)·Kyung-Ae Park
2)†·Dochul Yang
3)·Sun-Gu Lee
4)Abstract: KOMPSAT-5 is the first satellite in Korea equipped with X-band Synthetic Aperture Radar (SAR) instrument and has been operated since August 2013. KOMPSAT-5 is used to monitor the global environment according to its observation purpose and the availability of KOMPSAT-5 is also highlighted as the need of high resolution wind data for investigating the coastal region. However, the previous study for the validation of wind derived from KOMPSAT-5 showed that the accuracy is lower than that of other SAR satellites. Therefore, in this study, we developed the correction equation of normalized radar cross section (NRCS or backscattering coefficient) for improvement of wind from the KOMPSAT-5 and validated the effect of the equation using the in-situ measurement of ocean buoys. Theoretical estimated NRCS and observed NRCS from KOMPSAT-5 showed linear relationship with incidence angle. Before applying the correction equation, the accuracy of the estimated wind speed showed the relatively high root-mean-square errors (RMSE) of 2.89 m s
-1and bias of -0.55 m s
-1. Such high errors were significantly reduced to the RMSE of 1.60 m s
-1and bias of -0.38 m s
-1after applying the correction equation. The improvement effect of the correction equation showed dependency relying on the range of incidence angle.
Key Words: Sea surface wind, SAR (Synthetic Aperture Radar), Correction equation of backscattering coefficient, KOMPSAT-5
요약 : KOMPSAT-5는 우리나라 최초의 X 밴드 Synthetic Aperture Radar (SAR) 탑재 인공위성으로, 2013년 8월 부터 운영되고 있다. KOMPSAT-5는 운영 목적에 따라 지구환경 감시에 적극적으로 활용되고 있으며, 연안 환
Received December 12, 2019; Accepted December 19, 2019; Published online December 24, 2019
1)
서울대학교 과학교육과 박사과정생 (PhD Student, Department of Science Education, Seoul National University)
2)
서울대학교 지구과학교육과 정교수 (Professor, Department of Earth Science Education, Seoul National University)
3)
한국항공우주연구원 영상체계개발팀 선임연구원 (Senior Researcher, Satellite Operation and Application Center, Korea Aerospace Research Institute)
4)
한국항공우주연구원 위성활용부 책임연구원 (Principal Researcher, Satellite Application Devision, Korea Aerospace Research Institute)
†Corresponding Author: Kyung-Ae Park ([email protected])
This is an Open-Access article distributed under the terms of the Creative Commons Attribution Non-Commercial License
(http://creativecommons.org/licenses/by-nc/3.0) which permits unrestricted non-commercial use, distribution, and reproduction in
any medium, provided the original work is properly cited.
1. 서 론
해상풍은 복잡한 해양 현상을 분석하고 이해하는데 필수 요소 중 하나이다 . 특히 해양 대기 경계층에서의 대기 -해양 상호작용을 이해하기 위해서는 해상풍에 대 한 이해가 필요하다 (Cornillon and Park, 2001). 또한 기후 변화에 의한 해양 환경 변화가 해상풍에 따라 다르게 나 타나고(Xie et al., 2010), 기후 변화에 대한 관심이 증대되 면서 지속적이고 정확한 전세계 해상풍 관측의 필요성 이 꾸준히 강조되어 왔다(Graf et al., 1998).
1990년대 초부터 현재까지 전세계 연구기관에서는 European Remote Sensing-1/2 (ERS-1/2), NASA Scattero - meter (NSCAT), Quik Scatterometer (Quikscat), Advanced Scatteromter (ASCAT), Rapid Scatteromter (RapidScat)과 같은 산란계 (scatterometer)를 운영해왔고, 산란계를 활 용하여 약 25 km 공간 해상도의 바람장 자료를 산출하 여 전세계 바람장 감시에 기여하고 있다 (Ebuchi, 1999).
산란계 바람장 자료의 정확도는 풍속은 2 m s
-1, 풍향은 20° 안팎이며, 수치 예보 모델의 정확도를 높여주는 입 력 자료로 사용되었고(Liu et al., 1998), 대기-해양 상호작 용을 포함한 해양 현상 기작을 이해하는데 활용되었다 (Park et al., 2006). 하지만, 산란계 바람장 자료는 25 km의 낮은 공간 해상도로 인해 연안에서의 정확도 감소 및 결 측이 발생하고 , 작은 규모의 해양 현상 분석이 불가능 하다는 한계점을 보인다 (Tang et al., 2004; Rodriguez et al., 2009).
Synthetic Aperture Radar(SAR)는 능동 마이크로파 센서 로 대기에 의한 영향을 적게 받기 때문에 전천후 센서로 사용되고 있다 . 전세계 연구기관에서는 Shuttle Imaging
Radar with Payload C (SIR-C), ERS-1/2, RADARSAT-1/2, Envisat Advanced Synthetic Aperture Radar (ASAR), Advanced Land Observing Satellite-1/2 Phased Array L- band Synthetic Aperture Radar (ALOS-1/2 PALSAR), TerraSAR-X/Tandem-X (TS-X/TD-X), Costellation of small Satellites for the Mediterranean basin Observation (COSMO-SkyMed), Koean Multi-Purpose SATellite-5 (KOMPSAT-5), Sentinel-1A/B와 같이 SAR 탑재 인공 위성을 운영하면서 지속적으로 해양 환경을 감시하고 있다 (Jang and Park, 2019). 산란계는 낮은 공간 해상도 로 인한 한계점이 있었던 반면 , SAR는 관측 방법의 특 이성으로 인해 1 km 이하의 고해상도 바람장 산출이 가능하여 산란계의 한계점을 보완하는 것이 가능하다 (Thompson and Beal, 1998; Furevik and Korsbakken, 2000).
이러한 장점으로 인해 SAR 기반 해상풍 자료는 연안 해 양 환경 감시 (Li et al., 2007), 미규모의 바람장 구조 분석 을 통한 해양 대기 경계층에서의 상호작용 연구에 활용 되고 있다 (Li et al., 2013).
KOMPSAT-5 인공위성은 2013년 8월 22일에 발사된
우리나라 최초의 X-band (9.66 GHz) SAR 탑재 인공위
성으로, 관측 모드(mode)로는 고해상도(1 m), 표준(3 m),
광역(20 m) 관측 모드가 존재한다(Lee, 2010). 현재까지
KOMPSAT-5 영상 활용 해양 연구는 SAR 자료의 상대
적인 영상 세기(intensity)를 활용한 임계값 설정 또는 영
상 구조 특징 분석 (texture feature analysis)을 기반으로 한
기름 유출 탐지 연구 (Harahsheh, 2016), 해빙 탐지 연구
(Han et al., 2017), 선박 탐지 연구(Hwang et al., 2017; Kim
et al., 2018)가 진행되었으며, 후방산란계수(backscatteringcoefficient 또는 Normalized Radar Cross Section, NRCS)
경 감시를 위한 고해상도 해상풍의 필요성이 강조되면서KOMPSAT-5의 활용도도 부각되고 있다. 하지만, 기 존의 해상풍 정확도 검증 연구에서는 다른SAR 탑재 인공위성 기반 해상풍에 비해 정확도가 낮은 것으로 나타 났다. 따라서 본 연구에서는 KOMPSAT-5 기반 해상풍의 정확도 개선을 위한 후방산란계수 보정식을 산출하 였고, 보정식의 개선 효과를 해양 부이 자료를 활용하여 검증하였다. 18장의 미국 서부와 하와이 연안을 관측 한KOMPSAT-5 자료와 해양 부이 자료를 활용하여 후방산란계수 보정식을 산출하였고, 산출한 후방산란계수 보정식은18장의 한반도 연안을 관측한 KOMPSAT-5 자료에 적용하여 해상풍을 산출하였다. 이론적으로 산출 된 후방산란계수와KOMPSAT-5에서 관측된 후방산란계수는 입사각에 따른 1차 함수 관계식을 따르는 것으 로 나타났다. 보정식을 적용하기 전에는 2.89 m s-1의 상대적으로 큰 평균 제곱근 오차와-0.55 m s-1의 편차를 보 였다. 보정식을 적용한 후에는 각각 1.60 m s-1, -0.38 m s-1로 개선되었다. 입사각의 범위에 따라 후방산란계수 보 정식의 개선 효과는 다르게 나타났다.절대값을 활용한 연구로는 후방산란계수 산출식 검증 (Yang et al., 2018) 및 해상풍 산출 정확도 검증(Jang et al., 2018) 연구에 불과하다. 특히 KOMPSAT-5 기반 해상풍 산출 정확도 검증 결과는 2.41-2.74 m s
-1로 , 다른 SAR 인 공위성 기반 해상풍 검증 결과에 비해 부정확한 것으로 나타났다(Jang and Park, 2019). 정확한 해상풍 산출을 위 해서는 정밀한 후방산란계수 산출이 필수적이고 , 이를 위해서는 KOMPSAT-5에 적합한 후방산란계수 보정식 이 필요하다 .
육지 환경에서는 단일 산란(single scattering)보다는 이중 산란 (double bounce scattering), 다중 산란(multiple scattering), 체적 산란(volume scattering)이 주를 이루지만, 해양 환경에서는 단일 산란이 주를 이루기 때문에 SAR 자료의 후방산란계수 절대값이 작아 후방산란계수의 절대적인 정확도를 평가하기에 적합하다 .
따라서 본 연구에서는 KOMPSAT-5 후방산란계수
결과의 보정식을 산출하고 그에 따른 정확도 개선 결과 를 평가하기 위해 1) 미국과 한반도 연안 환경을 관측한 KOMPSAT-5 표준 촬영 모드 자료를 수집하고, 2) 육지 화소 제거, 스펙클 잡음(speckle noise) 감소, 선박 탐지를 포함한 전처리 과정을 적용하고 , 3) 미국 연안 관측 자 료를 활용하여 이론적인 후방산란계수를 추정하고 , 4) KOMPSAT-5 후방산란계수와 이론적인 후방산란계수 를 비교하여 보정식을 산출하고, 5) 한반도 연안을 관측 한 KOMPSAT-5 자료를 기반으로 보정식 적용 전과 후 의 해상풍 산출 정확도를 평가하고자 한다 .
2. 연구 해역 및 자료
1) 연구 해역
본 연구에서는 KOMPSAT-5 자료에 적합한 후방산
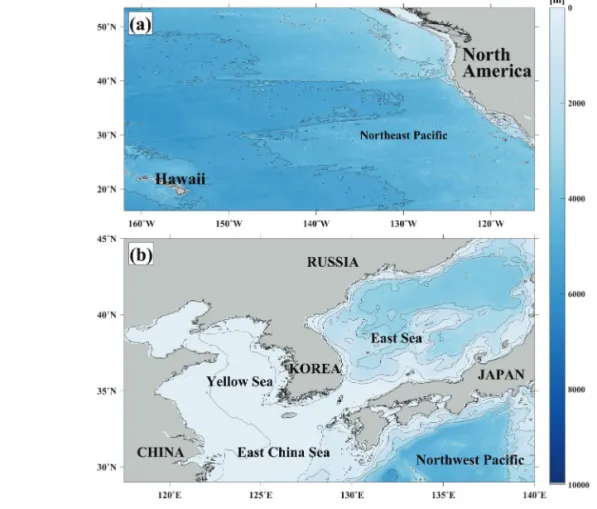
Fig. 1. Location of study area for (a) calculating the correction equation of backscattering
coefficient and (b) validation of the equation with contours of the water depth (m),
respectively.
란계수 보정식을 산출하기 위한 연구해역으로 VV 편파 관측 자료가 다수 수집된 미국 연안을 선정하였다 (Fig.
1(a)). 미국 연안 관측 자료를 기반으로 산출된 후방산란 계수 보정식의 정확도를 검증하기 위해 본 연구에서는 추가적으로 한반도 주변 연안을 연구 해역으로 선정하 였다 (Fig. 1(b)).
한반도는 황해 , 동해, 동중국해에 둘러싸여 있으며, 한류와 난류의 영향이 계절에 따라 뚜렷하게 변한다 . 또 한 44 m 미만의 얕은 수심과 강한 조류를 갖는 황해와 다르게 동해는 3000 m 이상의 수심이 존재하는 등 한반 도 주변 해역은 다양한 해양 특성 및 많은 해양 부이를 가지고 있어 인공위성 산출물의 정확도를 검증하기에 적합한 지역이기 때문에 해상풍 정확도 검증을 위한 연 구지역으로 선정하였다 (Jang et al., 2019).
2) 실측 자료
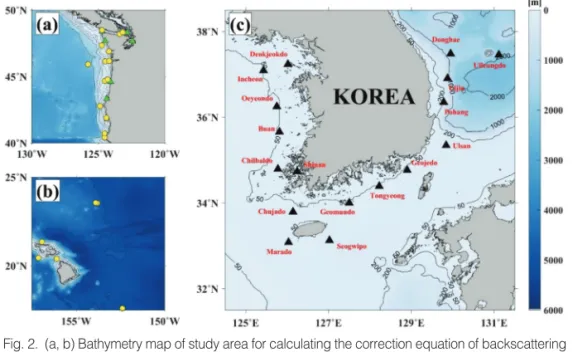
KOMPSAT-5 자료를 기반으로 산출된 해상풍의 정 확도를 평가하기 위해서 해양 환경을 감시하는 해양 부 이 실측 자료를 활용하였다 . 하와이 부근 연안과 미국 서부 연안의 해양 부이 자료는 National Oceanic and Atmospheric Administration (NOAA)의 National Centers
for Environmental Information (https://www.nodc.noaa.
gov/BUOY/)에서 관리하고 있으며(Fig. 2(a)-2(b)), 설치 된 센서에 따라 기온, 기압, 습도, 풍속, 풍향, 해수면 온 도 등을 포함한 기상 성분을 0 m에서 5.0 m에서 관측한 다 (NDBC, 2009). 한반도 연안 해양 부이 자료는 기상청 에서 관리하는 해양기상부이 자료를 활용하였으며 (Fig.
2(c)), 기온, 기압, 습도, 풍속, 풍향, 해수면 온도 등을 포 함한 기상 성분을 0.1 m에서 4.4 m 높이에서 관측한다.
본 연구에서는 연구 해역을 관측한 KOMPSAT-5 표준 촬영 모드 자료와 일치점 자료를 생성하면서 일치점 자 료 생성 시기에 풍속, 풍향, 기압, 기온, 습도, 해수면 온 도를 모두 관측한 해양 부이 자료를 선별하였다 .
3) SAR 자료
해양 부이 자료를 활용하여 산출한 이론적인 후방 산란계수와 KOMPSAT-5 영상으로부터 계산된 후방 산란계수를 비교하여 후방산란계수 보정식을 산출하 기 위해서 미국 연안을 관측한 KOMPSAT-5 VV 편파 자료를 선별하여 수집하였다(Table 1). 미국 연안 관측 KOMPSAT-5 자료 수집 기간은 2017년 4월 30일부터 2017년 10월 31일까지이고, 총 18장의 KOMPSAT-5 표
Fig. 2. (a, b) Bathymetry map of study area for calculating the correction equation of backscattering
coefficient with contours of the water depth (m), which the yellow circles and the green triangles
represent the locations of the moored buoys and Coastal Marine Automated Network stations,
respectively, and (c) bathymetry map of study area for validation of the correction equation
with contours of the water depth (m), which the black triangles indicate the location of Korea
Meteorological Administration (KMA) ocean meteorological buoy stations.
Table 1. Characteristics of the KOMPSAT-5 observing the west coastal region of North America and the northeast coastal region of Hawaii (observation date and time, beam mode, look direction, and orbit) used for calculating correction equation of backscattering coefficient
Scene no. Product center time (UTC) Beam mode Look Orbit
1 30 April 2017 13:49:38 UTC ES-08 Right Ascending
2 2 August 2017 04:09:04 UTC ES-03 Right Descending
3 19 August 2017 13:52:22 UTC ES-06 Right Ascending
4 31 August 2017 02:23:13 UTC ES-07 Right Descending
5 1 September 2017 02:19:50 UTC ES-09 Right Descending
6 3 September 2017 02:13:02 UTC ES-14 Right Descending
7 13 September 2017 14:02:32 UTC ES-13 Right Ascending
8 30 September 2017 02:16:23 UTC ES-12 Right Descending
9 30 September 2017 02:16:23 UTC ES-12 Right Descending
10 26 October 2017 02:23:49 UTC ES-08 Right Descending
11 26 October 2017 04:05:33 UTC ES-07 Right Descending
12 28 October 2017 02:16:19 UTC ES-12 Right Descending
13 28 October 2017 02:17:02 UTC ES-13 Right Descending
14 28 October 2017 02:18:21 UTC ES-06 Right Descending
15 29 October 2017 16:05:55 UTC ES-07 Right Ascending
16 30 October 2017 02:10:14 UTC ES-18 Right Descending
17 31 October 2017 02:06:07 UTC ES-19 Right Descending
18 31 October 2017 02:06:44 UTC ES-17 Right Descending
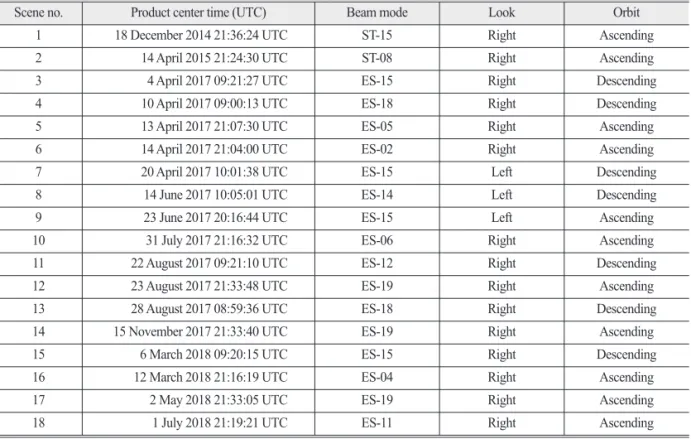
Table 2. Characteristics of the KOMPSAT-5 observing the coastal region around the Korean Peninsula (observation date and time, beam mode, look direction, and orbit) used for calculating correction equation of backscattering coefficient
Scene no. Product center time (UTC) Beam mode Look Orbit
1 18 December 2014 21:36:24 UTC ST-15 Right Ascending
2 14 April 2015 21:24:30 UTC ST-08 Right Ascending
3 4 April 2017 09:21:27 UTC ES-15 Right Descending
4 10 April 2017 09:00:13 UTC ES-18 Right Descending
5 13 April 2017 21:07:30 UTC ES-05 Right Ascending
6 14 April 2017 21:04:00 UTC ES-02 Right Ascending
7 20 April 2017 10:01:38 UTC ES-15 Left Descending
8 14 June 2017 10:05:01 UTC ES-14 Left Descending
9 23 June 2017 20:16:44 UTC ES-15 Left Ascending
10 31 July 2017 21:16:32 UTC ES-06 Right Ascending
11 22 August 2017 09:21:10 UTC ES-12 Right Descending
12 23 August 2017 21:33:48 UTC ES-19 Right Ascending
13 28 August 2017 08:59:36 UTC ES-18 Right Descending
14 15 November 2017 21:33:40 UTC ES-19 Right Ascending
15 6 March 2018 09:20:15 UTC ES-15 Right Descending
16 12 March 2018 21:16:19 UTC ES-04 Right Ascending
17 2 May 2018 21:33:05 UTC ES-19 Right Ascending
18 1 July 2018 21:19:21 UTC ES-11 Right Ascending
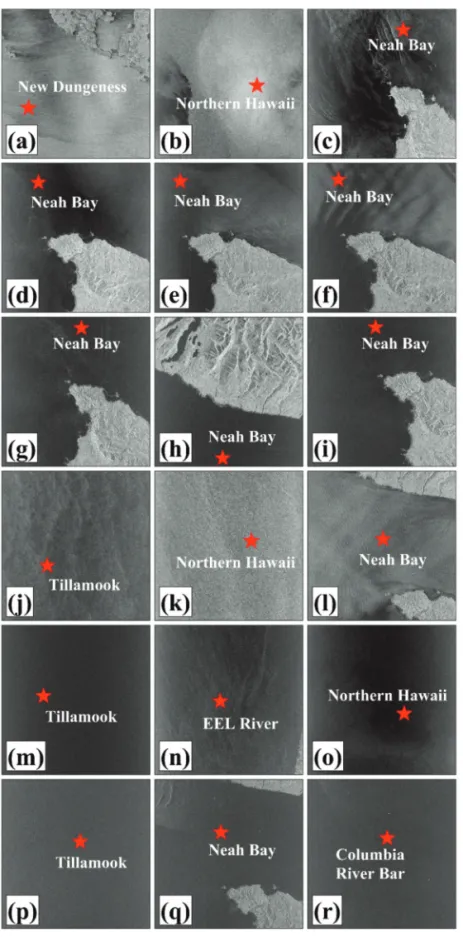
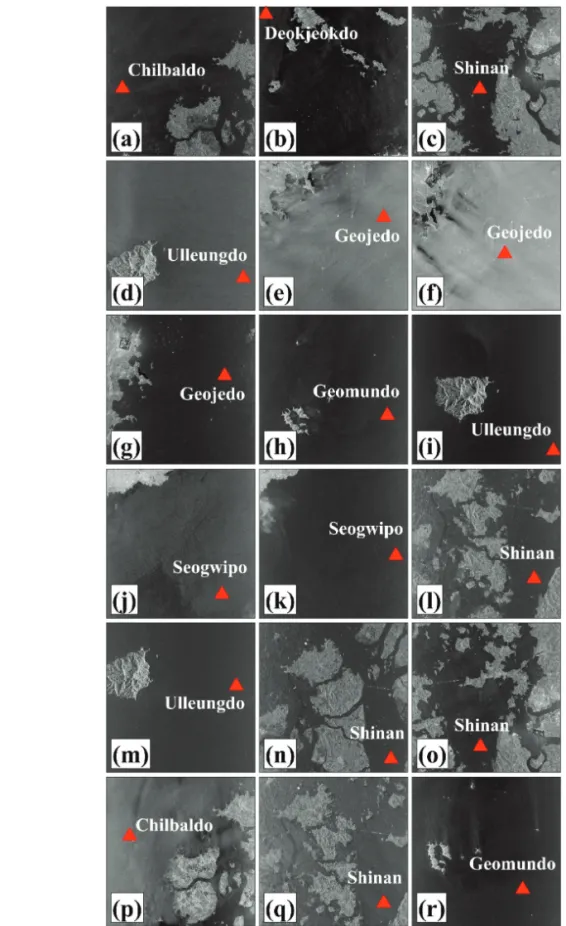
Fig. 3. A series of KOMPSAT 5 VV pol images used for calculating the correction
equation of backscattering equation, where (a) to (r) correspond to the
images listed in Table 1 and the red stars represent the buoy stations for
retrieval of theoretical backscattering coefficient.
Fig. 4. A series of KOMPSAT 5 VV pol images used for validation of the correction
equation, where (a) to (r) correspond to the images listed in Table 2 and
the red stars represent the buoy stations for the validation of the estimated
wind speed.
준 관측 모드 자료를 수집하였으며 , 6개의 해양 부이와 일치점 자료를 생성하였다 (Fig. 3). 미국 해양 부이자료 를 기반으로 산출된 KOMPSAT-5 후방산란계수 보정식 을 검증하기 위해 한반도 연안을 관측한 KOMPSAT-5 VV 편파 자료를 선별하여 추가 수집하였다(Table 2).
한반도 연안 관측 KOMPSAT-5 자료 수집 기간은 2014 년 12월 18일부터 2018년 7월 1일까지이고, 총 18장의 KOMPSAT-5 표준 관측 모드 자료를 수집하였으며, 7개 의 해양 부이와 일치점 자료를 생성하였다 (Fig. 4). 표준 관측 모드 자료의 관측 폭 (swath width)과 공간 해상도는 각각 약 30 km과 3 m로, 관측 입사각의 범위에 따라 달 라지며, 고해상도 관측으로 인해 관측 폭이 좁아 한 장 의 KOMPSAT-5 자료에 1개의 해양 부이가 일치점으로 생성되었다.
4) 모델 해상풍 자료 및 고도 자료
같은 지점을 다른 입사각으로 여러 번 관측하는 산란 계와는 다르게 SAR 자료로부터 해상풍을 산출하기 위 해서는 풍향 정보가 필요하다. 풍향 정보를 산출하는 방 법으로는 SAR 영상 기반 산출 방법(Lenher et al., 1998;
Vachon and Dobson, 2000; Koch, 2004), 사중 편파(quad polarized) 자료 기반 산출 방법(Zhang et al., 2015), 외부 자료 입력 방법을 활용하는 것이 가능하다. 하지만, SAR 영상에 대기에 의한 바람 줄무늬 (wind streak)가 형성되 지 않을 경우 , SAR 영상 기반 방법은 유효하지 않고, 바 람 줄무늬가 형성되는 경우는 극히 일부에 불과하다 . 또 한 KOMPSAT-5 자료는 단일 편파 자료이기 때문에 본 연구에서는 약 70 km 공간 해상도의 European Centre for Medium-Range Weather Forecasts (ECMWF) 재분석 자료 를 입력 자료로 사용하여 풍향 정보를 산출하였다 . SAR 영상 내 해양 화소만 추출하기 위해 육지 화소를 제거 하였고 , 30 m 공간 해상도의 Shuttle Radar Topography Mission (SRTM) Digital Elevation Model (DEM) 자료를 활용하였다 .
3. 연구 방법
1) SAR 자료 복사 보정(radiometric calibration)
본 연구에서 활용한 KOMPSAT-5 자료에 적용된 영
상 처리 프로그램 버전 [K5-SARP2017 / TAS-I-R131- 2017.1.3-CW64OIV2 - 2017.05.14]로, 이 영상 처리 프로 그램 버전의 후방산란계수 변환식은 다음과 같다 :
σ
01st[dB] = 10 log
10[ ∑N{i,j}∈D (1)
{( (I
i,j× RF)
2+ (Q
i,j× RF)
2) sin(θ
i,j) } ]
N은 도메인 D에 속하는 화소의 수, CALCO는 calibration
constant, RF는 rescaling factor이다. δ
S는 이며 ,
c는 빛의 속도, BWrg는 range focusing bandwidth를 의미 한다. δ
a는 azimuth instrument geometric resolution, ρ
C와
ρL은 각각 column spacing과 line spacing을 가리키고, I
i,j와
Qi,j는 각각
i번째 row, j번째 column 화소의 실수부와허수부를 의미한다 . θ
i,j는
i번째 행, j번째 열 화소의 국지 입사각 (local incidence angle)이며, 산출식은 다음과 같다 :
θ[deg] = GIM × GIMRF
– GIM
off(2)
GIM은 GIM layer의 DN 값 , GIMRF는 GIM layer의 rescaling factor, GIM
off는 GIM layer의 offset을 의미하고, 계산에 필요한 모든 변수는 KOMPSAT-5 자료에 포함 되어 있다 .
2) 자료 처리
SAR 자료로부터 정확한 해상풍을 산출하기 위해서 는 전처리 과정을 통해 SAR 영상의 품질을 개선해야 한다 . 본 연구에서는 SAR 영상 내 육지 화소를 제거하 기 위해 SRTM DEM 자료를 활용하였다. 스페클 잡음 은 SAR 영상의 품질을 저하시키고, 주변 화소에 영향을 주기 때문에 SAR 영상을 분석하기 전에 반드시 제거하 는 과정을 거쳐야 하고 (Lee, 1986; Singh and Shree, 2016), 본 연구에서는 가장 널리 사용되는 low-pass 필터 중 하 나인 boxcar 필터를 적용하였다(Mastin, 1985; Smith, 1996). Boxcar 필터는 계산의 부담이 적으면서 스페클 잡음을 효율적으로 제거하기 때문에 SAR 영상을 활용 한 해상풍 산출 연구에 적극적으로 활용되고 있다 (Zhang et al., 2012; Zhang et al., 2017). SAR 영상에서 해양 은 단일 산란이 주를 이루지만 , 선박은 이중 산란, 다중 산란 , 체적 산란이 주도적으로 발생하고, 해양 화소에 비해 극명하게 큰 에너지가 수신되기 때문에 해상풍 산 출의 오차 요인으로 작용할 수 있다 (Xi et al., 2017). 따라
CALCO N(δaδS
)
2·BW
c rg서 본 연구에서는 SAR 영상 내 선박 화소를 제거하기 위해 가장 널리 사용되는 방법 중 하나인 일정 오탐지 율(Constant False Alarm Rate, CFAR) 알고리즘을 적용 하였다(Crisp, 2004; Wang et al., 2008).
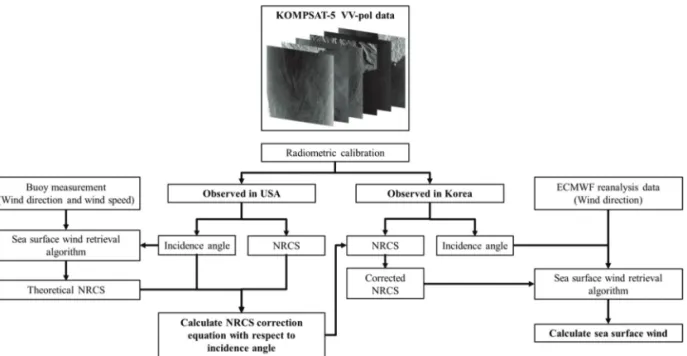
본 연구에서는 KOMPSAT-5 영상을 관측 지역에 따 라 영상 보정식 산출을 위한 자료와 보정식을 검증하기 위한 자료로 분류하여 활용하였다 (Fig. 5). 영상 보정식 을 산출하기 위해 KOMPSAT-5 영상과 일치점을 생성 한 해양 부이 자료로부터 풍향과 풍속 정보를 추출하고 , KOMPSAT-5 영상에서 그 위치에 해당하는 입사각과 후방산란계수를 계산하였다 . 일치점 데이터베이스를 생성한 풍향 , 풍속, 입사각을 해상풍 산출 알고리즘에 입력하여 이론적인 후방산란계수를 계산하고 , 이를 관 측된 후방산란계수와 비교하여 입사각에 따른 후방산 란계수 보정식을 산출하였다 . 산출된 후방산란계수 보 정식을 검증하기 위한 한반도 관측 KOMPSAT-5 영상 과 일치점을 생성한 해양 부이 자료로부터 풍속 정보를 추출하고 , KOMPSAT-5 영상에서 그 위치에 해당하는 입사각과 후방산란계수를 계산하고 , ECMWF 재분석 바람장 자료에서 풍향 정보를 추출하였다 . 일치점 데이 터베이스를 생성한 후방산란계수를 보정식에 적용한 후 , 보정된 후방산란계수, 입사각, 풍향을 해상풍 산출 알고리즘에 적용하여 해상풍을 산출하였다 .
3) 해상풍 산출
SAR 자료를 활용하여 해상풍을 산출하는 경우, 일반 적으로 산란계 관측값을 기반으로 개발된 경험식인 GeophysicalModelFunction(GMF)를활용한다. 본연구에 서 사용한 X-band GMF는 X-band Model 2 (XMOD2)로, TS-X/TD-X 자료와 National Data Buoy Center (NDBC) 에서 제공하는 해양 부이 자료와의 비교를 통해서 개발 된 경험식으로 다음과 같다 (Li and Lehner, 2014):
σ
0= B
0(c, U
10, θ) [1 + B
1(c, U
10, θ) cosφ +
B2(c, U
10, θ)cos2φ]
p(3)
σ0은 NRCS, U
10은 해수면 기준 10-m 중성(neutral) 풍속,
θ는 입사각, φ는 레이더에 대한 상대적인 풍향을 의미하고 , B
0, B
1, B
2, c, p는 계수로, U
10과
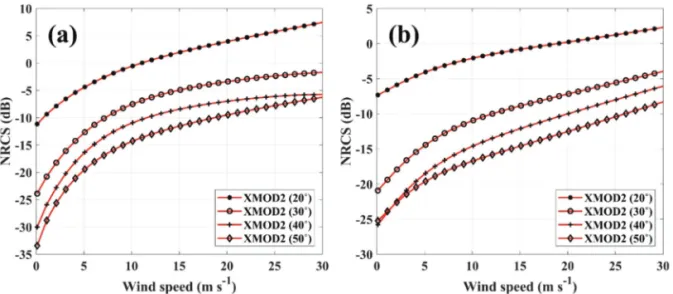
θ에 따라 달라진다.Fig. 6(a)와 6(b)는 각각 상대 풍향이 0°와 90°일 때, XMOD2에 의해 계산된 입사각에 따른 풍속과 NRCS의 분포를 나타낸다 . 상대 풍향이 0°일 때 20 m s
-1이상의 강한 풍속 조건에서는 입사각이 30°와 40°에서는 NRCS 가 포화되는 것으로 나타났고 , 20°와 50°에서는 선형 관 계로 나타났다 . 상대 풍향이 90°일 때 입사각에 상관없 이 20 m s
-1이상의 강한 풍속 조건에서는 NRCS와 풍속 이 선형 관계로 나타났다.
Fig. 5. Flow diagram for calculating the correction equation of backscattering coefficient based on in-situ measurement
and validation of the correction equation compared with in-situ measurement.
4) 10-m 풍속 변환
인공위성 관측 자료를 기반으로 산출된 해상풍은 해 수면 기준 10-m 중성 바람을 의미하지만, 정확도 평가 를 위해 사용하는 해양 부이 실측 해상풍은 3.6 m에서 5.0 m 범위의 높이에서 측정된다. 따라서 KOMPSAT-5 자료로부터 산출한 해상풍과 정확도 기준 자료로 사용 되는 실측 해상풍이 의미하는 높이를 통일하기 위해 본 연구에서는 대기-해양 경계층을 잘 모의하는 것으로 알 려진 Liu-Katsaros-Businger (LKB) 모델을 사용하여 실 측 해상풍의 높이를 10 m로 변환하였다(Liu et al., 1979;
Liu and Tang, 1996).
LKB 모델은 풍속, 기온, 습도의 측정 높이와 해수면 온도 , 기온, 습도, 기압, 풍속을 입력값으로 활용하여 특 정 높이에서의 중성 바람을 추정하도록 설계되었고 , 다 음과 같다:
= (4)
u와 us는 각각 구하고자 하는 높이와 기준 높이에서의 풍속이고, u
*은 마찰 속도를 가리킨다. z와 z
u는 각각 구 하고자 하는 높이와 풍속의 관측 높이를 가리키고 , k는 Von Karman 상수로 본 연구에서는 0.4를 대입하였다 (Paulson, 1970). Ψ
u는 유체의 특성을 나타내는 안정도 변수로, Businger-Dyer 모델을 통해 계산된다(Businger et
al., 1971; Dyer, 1974).4. 연구 결과
1) KOMPSAT-5 후방산란계수 보정식 산출
기존의 KOMPSAT-5 기반 해상풍 연구에서는 후방 산란계수의 정확도로 인해 해상풍의 검증 결과가 NOAA의 기준인 2.0 m s
-1을 만족시키지 못했다 . 본 연 구에서는 이를 해결하기 위해 미국 서부 연안을 관측한 KOMPSAT-5 자료와 해양 부이 일치점 자료를 활용하 여 후방산란계수의 오차 특성을 분석하였다 (Fig. 7). Fig.
7(a)는 이론적으로 추정한 후방산란계수와 KOMPSAT- 5에서 관측된 후방산란계수를 비교한 결과로, 뚜렷한 오차 특성을 보이지 않았다. 하지만, 입사각과 비교하였 을 때 이론적 후방산란계수와 관측된 후방산란계수는 1차 함수를 따르는 것으로 나타났고, 본 연구에서 보이 지 않았지만 , 한반도 관측 KOMPSAT-5 자료에서도 동 일한 특성이 나타났다 (Fig. 7(b)). 이와 같은 오차 특성을 기반으로 본 연구에서는 다음과 같은 후방산란계수 보 정식을 제안하였다 :
σ0Corr
= σ
0+ a × θ + b (5)
σ0Corr는 보정된 후방산란계수 , σ
0는 KOMPSAT-5 후 방산란계수 , θ는 입사각을 가리키며, a와 b는 상수로, 각 각 -0.2058, 9.5742로 추정되었다.
Fig. 7(c)은 본 연구에서 산출한 후방산란계수 보정 식 적용 후의 결과이다 . 보정하기 전에는 이론적으로
u – usu*
ln ( ) – Ψ
uk zzu
Fig. 6. Distribution of the estimated NRCS as a function of wind speed at a given relative wind direction (a) 0° and (b)
90° with each incidence angle (°).
산출된 후방산란계수와 관측된 후방산란계수의 차이 가 -5.5258 dB에서 5.6650 dB사이의 범위로 나타났지만 (Fig. 7(a)), 보정식을 적용한 후에는 -5.1203 dB에서 3.8900 dB사이의 범위로 나타나 보정된 후방산란계수가 이론 적으로 산출된 후방산란계수에 좀더 근접한 것으로 나 타났다 (Fig. 7(c)).
2) 한반도 연안 관측 KOMPSAT-5 보정 결과
Fig. 8는 미국 서부 연안 관측 KOMPSAT-5 자료로부 터 산출한 후방산란계수 보정식을 한반도 연안 관측
KOMPSAT-5 자료에 적용한 결과이다. 후방산란계수 보 정식 검증을 위해 미국 연안을 관측한 KOMPSAT-5 자 료로부터 산출한 보정식을 활용하였다 . 보정식을 적용 하기 전에는 이론적으로 산출된 후방산란계수와 관측된 후방산란계수의 차이가 -4.8343 dB에서 6.0931 dB사이의 범위로 나타났다 (Fig. 8(a)). 그에반해보정식을 적용한후 에는 이론적으로 산출된 후방산란계수와 관측된 후방산 란계수의 차이가 -4.1210 dB에서 3.1437 dB사이의 범위로 나타나 보정식을 적용하기 전보다 이론적으로 산출된 후방산란계수와 유사한 분포를 보였다 (Fig. 8(b)).
Fig. 7. (a) Scatter plot of theoretical NRCS by in-situ measurement and observed NRCS (σ^0) by KOMPSAT-5 in the west coastal region of North America and northeast coastal region of Hawaii, (b) comparison of residuals (theoretical NRCS - observed NRCS) with respect to incidence angle, where the blue line represents a least-squared fit to a linear function, and (c) scatter plot of theoretical NRCS by in-situ measurement and corrected NRCS by the correction equation.
Fig. 8. (a) Scatter plot of theoretical NRCS by in-situ measurement and observed NRCS (σ
0) by
KOMPSAT-5 in the coastal region around the Korean Peninsula and (b) scatter plot of theoretical
NRCS by in-situ measurement and corrected NRCS by the correction equation derived from
matchup data of North America and Hawaii.
3) 풍속 정확도
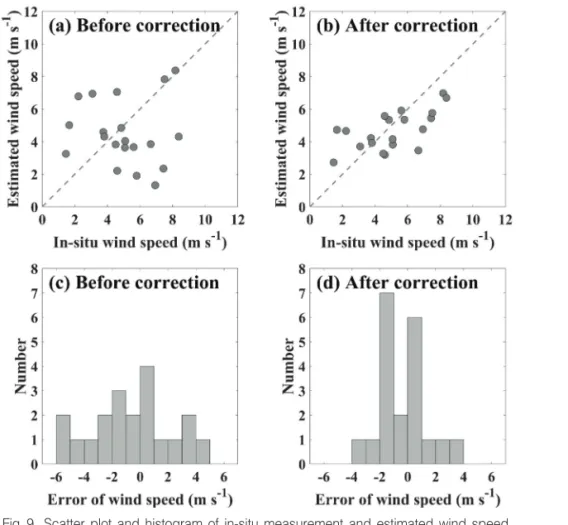
일반적으로 SAR 영상을 활용하여 해상풍을 산출할 때 , 실측 풍향 정보를 입력 자료로 사용하지 못하는 경 우가 일반적이다. 따라서 본 연구에서는 ECMWF 재분 석 바람장 자료를 풍향 입력 자료로 활용하여 해상풍을 산출하였다. 정확도 평가 기준 자료로는 LKB 모델을 적 용한 기상청 해양기상부이 실측 자료를 사용하였고 , 보 정식을 적용하기 전과 적용한 후의 정확도 결과를 비교 하였다 (Fig. 9). 보정식을 적용하기 전에는 실측 풍속과 산출된 풍속이 상관관계가 없는 것으로 나타났지만 , 보 정식을 적용한 후에는 양의 상관관계를 보이는 것으로 나타났다 (Fig. 9(a)-9(b)). 풍속 오차의 경우, 보정식을 적 용하기 전에는 -5.61 m s
-1에서 4.57 m s
-1의 범위를 보였 지만 , 보정식을 적용한 후에는 -3.20 m s
-1에서 3.07 m s
-1의 범위로 , 오차가 개선된 것으로 나타났다(Fig. 9(c)-9(d)).
Table 3은 후방산란계수 보정식 적용 전과 후에 따른
정확도 평가 결과를 정리한 것이다 . 보정식을 적용하기 전에는 2.89 m s
-1의 평균 제곱근 오차 (root-mean-square error, RMSE)와 -0.55 m s
-1의 음의 편차 (bias)가 나타났다.
편차를 보정한 정확도인 표준 편차는 2.84 m s
-1, 상관계 수는 -0.04, 산란 지수는 0.56으로 나타나 상관성이 낮은 것으로 나타났다. 그에 반해 보정식을 적용한 후에는
Fig. 9. Scatter plot and histogram of in-situ measurement and estimated wind speed derived from (a, c) original KOMPSAT-5 NRCS and (b, d) corrected KOMPSAT-5 NRCS in the coastal region around the Korean Peninsula.
Table 3. Accuracy (root-mean-square error (RMSE), bias, standard deviation (STD), correlation coefficient (Corr.), and scatter index) of the estimated wind speed derived from KOMPSAT-5 data before and after application of the correction equatio
Before correction After correction
RMSE 2.89 1.60
Bias -0.55 -0.38
STD 2.84 1.56
Corr. -0.04 0.63
5catter Index 0.56 0.31
1.60 m s
-1의 평균 제곱근 오차와 -0.38 m s
-1의 음의 편차 , 1.56 m s
-1의 표준편차 , 0.63의 상관계수, 0.31의 산란 지 수가 나타나 보정식을 적용하기 전에 비해 정확도와 상 관계수가 모두 개선된 것으로 나타났다 .
4) 해상풍 산출 예시
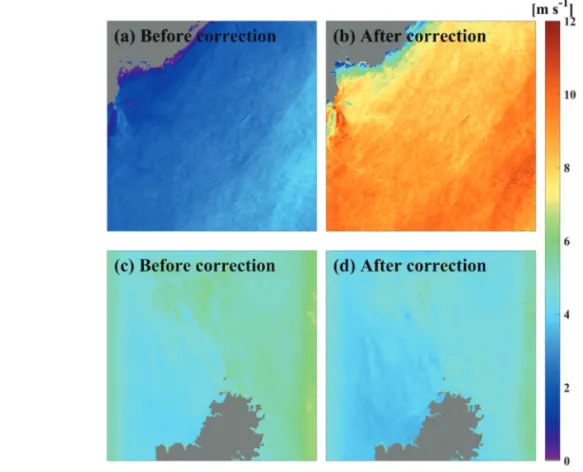
후방산란계수 보정식 적용 효과를 공간적으로 분석하 기 위해 본 연구에서는 부산 연안을 관측한 KOMPSAT-5 영상을 활용하였다 . Fig. 10(a)-10(b)는 2017년 8월 5일 21UTC에 관측한 KOMPSAT-5 자료로, 입사각은 19.1°
에서 22.4°까지의 범위로 나타났다. 후방산란계수 보정 식으로 인해 약 6 dB이 증가되어 기존 자료에 비해 최대 9.2 m s
-1가 증가된 해상풍으로 추정하였다 . Fig. 10(c)- 10(d)는 2017년 6월 3일 09UTC에 관측한 KOMPSAT-5 자료로 , 입사각은 50.1°에서 51.7°까지의 범위로 나타 났다 . 후방산란계수 보정식으로 인해 약 1 dB이 감소되 어 기존 자료에 비해 최대 1.9 m s
-1가 감소된 해상풍으로
추정하였다 . 특히 보정식을 적용하지 않은 KOMPSAT-5 자료에서는 입사각이 50°에서 51° 부근에서 SAR 영상 의 특성과 다르게 입사각이 높은 영역과 낮은 영역이 모 두 높은 후방산란계수를 보였다 (Fig. 10(c)). 하지만, 후방 산란계수 보정식을 통해서 입사각이 낮은 부분과 높은 부분 모두 높은 후방산란계수를 보이는 KOMPSAT-5 영상 오류를 완화된 것을 확인하였다 (Fig. 10(d)).
5. 요약 및 결론
기존의 KOMPSAT-5 기반 해상풍 정확도 검증 연구 에서는 2 m s
-1이상의 평균 제곱근 오차를 보이는 것으 로 나타나 후방산란계수의 정확도에 대한 문제가 제기 되었다. 이를 해결하기 위해 본 연구에서는 후방산란계 수 보정식을 제안하였고, 이에 대한 검증을 위해 기상 청 해양기상부이 자료와 비교하였다. 보정식의 객관성
Fig. 10. Distribution of estimated wind speed derived from original KOMPSAT-5
NRCS and corrected KOMPSAT-5 NRCS in the coastal region around the
Korean Peninsula on (a, b) 5 August 2017 at 21 UTC and (c, d) 3 June 2017
at 09 UTC.
및 범용성을 위해 보정식을 산출하기 위한 자료는 미국 연안에 위치하는 NOAA NDBC 해양 부이 자료와 일치 점 자료를 생성한 KOMPSAT-5 영상을 수집하였다. 해 양 부이 실측 자료를 기반으로 추정한 이론적 후방산란 계수와 KOMPSAT-5로부터 관측된 후방산란계수의 상 관 관계에 따라 KOMPSAT-5 후방산란계수 보정식을 제안하였다 . 제안된 후방산란계수 보정식을 검증하기 위한 자료는 한반도 연안에 위치하는 기상청 해양기상 부이 자료와 일치점을 생성한 KOMPSAT-5 영상을 활 용하였다.
해상풍을 산출하기에 앞서 보다 정확한 SAR 영상 분 석을 위해 연안 해양 화소에 영향을 주는 육지 화소를 제거하였고, 영상의 질을 저하시키는 스페클 잡음을 boxcar 필터를 적용하여 제거하였으며, 주변 해양 화소 의 후방산란계수에 영향을 주는 선박 화소를 일정 오탐 지율 알고리즘을 적용하여 제거하였다 . 인공위성 기반 해상풍의 기준 고도는 해수면 기준 10 m이지만, 해양 부 이의 해상풍 측정 고도는 3.6 m에서 5.0 m이므로 LKB 모델을 적용하여 10-m 중성 바람으로 변환하였다. 해양 부이 실측 자료의 풍속 , 풍향 자료와 KOMPSAT-5 자료 의 입사각을 XMOD2에 입력하여 이론적 후방산란계 수를 계산하여 관측된 후방산란계수와 비교하였고 , 입 사각에 따른 1차 함수 관계를 보이는 것으로 나타났다.
입사각에 따른 1차 함수 보정식을 한반도 연안 관측 KOMPSAT-5 자료에 적용하여 후방산란계수를 보정하 였으며 , 보정된 후방산란계수와 입사각, ECMWF 재분 석 바람장의 풍향 정보를 XMOD2에 입력하여 해상풍을 산출하였다. 후방산란계수 보정식을 적용하기 전에는 평균 제곱근 오차와 편차, 상관계수가 각각 2.89 m s
-1, -0.55 m s
-1, -0.04로 나타났지만, 보정식을 적용한 후에는 각각 1.60 m s
-1, -0.38 m s
-1, 0.63으로 나타나 정확도가 대 폭 개선되었다 .
후방산란계수 보정식의 개선 효과를 공간적인 형태 로 분석하기 위해 부산 연안을 관측한 KOMPSAT-5 영 상을 활용하였다 . 입사각이 낮은 영역에서는 기존의 KOMPSAT-5 자료에 비해 보정식을 통해 후방산란계수 가 증가한 것으로 개선되었고 , 해상풍이 최대 9.2 m s
-1가 증가한 것으로 나타났다 . 입사각이 높은 부분에서는 그 와 반대로 원시자료에 비해 후방산란계수를 감소시키 는 것으로 나타났다 . 특히 50°부근의 입사각으로 관측
한 KOMPSAT-5 영상에서는 기존의 SAR 자료와는 다 르게 입사각이 높은 영역과 낮은 곳에서 높은 후방산란 계수를 보이는 영상 오류가 존재하였지만 , 보정식을 적 용한 후에는 그와 같은 영상 오류가 개선되는 것으로 나 타났다 .
기존의 KOMPSAT-5 해상풍 연구에서는 SAR 관측 방법의 특이성에 의한 레인지 (range) 모호성(ambiguity) 과 이산적 및 불연속적 , 연안에서의 물결 모양의 특징 을 포함하고 있는 국지 입사각의 분포 특성과 같이 영 상 자체 특성을 해상풍 산출의 잠재적 오차 요인으로 제 시하였고, 그에 따라 KOMPSAT-5 후방산란계수의 처리 기법 개발 및 보완의 필요성을 강조하였다. 본 연구에 서 제안한 후방산란계수 보정식은 18개의 일치점 자료 를 기반으로 생성된 것이기 때문에 모든 KOMPSAT-5 영상에 적용하기에는 한계가 있다 . 하지만, 후방산란계 수에 입사각에 따른 오차 특성이 존재한다는 것을 규명 하였고 , 적은 일치점을 활용하여 계산한 보정식을 활용 하더라도 해상풍의 정확도를 대폭 개선하는 것이 가능 하다는 것을 확인하였다 . 후방산란계수 보정식의 정밀 도 및 범용성 개선을 위해서는 광대한 데이터베이스를 기반으로 한 KOMPSAT-5 후방산란계수 보정식 산출 에 대한 추가 연구가 필요하고 , 추후 KOMPSAT-5 후 방산란계수 보정식에 대한 추가 연구가 진행될 경우 , KOMPSAT-5 기반 해상풍의 정확도가 다른 SAR 탑재 인공위성 기반 해상풍의 정확도에 도달할 것으로 기대 된다 .
작은 규모의 해양 현상이 발생하는 연안에서는 고해 상도 바람장 자료의 필요성이 더 강조되고 있다. 그에 따라 전세계 연구기관에서는 다양한 SAR 탑재 인공위 성을 운영하고 있고, SAR 자료 기반 고해상도 바람장 자료를 지속적으로 생산해오고 있다. 그에 따라 다양한 SAR 센서, 전처리 방법, 풍향 정보 추출 방법, GMF 등 을 중심으로 SAR 자료 기반 해상풍 연구가 오랫동안 수 행되어 왔고 , 환경 조건에 따른 정확도 연구 뿐만 아니 라 해상풍의 지역적 특성도 규명하였다 . 이러한 연구들 을 통해 SAR 자료 기반 해상풍의 최적화가 진행된다면 고해상도 바람장 자료의 정확도가 향상되고 다양한 목 적으로 사용될 것으로 기대된다 .
본 연구에서는 KOMPSAT-5 기반 해상풍의 정확도
개선을 위해 해양 부이 실측 자료를 활용한 후방산란
계수 보정식을 산출하여 보정식의 개선 효과를 평가하 였다 . 또한 후방산란계수 보정식을 통해 KOMPSAT-5 자료의 입사각에 따른 영상 오차를 보정하는 것이 가능 하였다 . KOMPSAT-5 후방산란계수 보정식 및 해상풍 의 정확도를 향상시키기 위해서는 연안 환경을 관측하 는 부이를 활용한 집중적인 관측이 필요하고 , SAR 자료 기반 해상풍 산출 알고리즘의 입력 자료로 활용되는 VV 편파 기반 관측이 보다 활발하게 이루어져야 할 것 이다 .
사 사
본 연구는 기상청 “기상·지진 See-At 기술개발연구사 업(KMI2018-05110)”의 지원을 받아 수행되었습니다.
References
Businger, J.A., J.C. Wyngaard, Y. Izumi, and E.F.
Bradley, 1971. Flux-profile relationships in the atmospheric surface layer, Journal of the
Atmospheric Sciences, 28(2): 181-189.Cornillon, P. and K. Park, 2001. Warm core ring velocities inferred from NSCAT, Geophysical
Research Letters, 28(4): 575-578.Crisp, D.J., 2004. The state-of-the-art in ship detection
in synthetic aperture radar imagery (No. DSTO- RR-0272), Defence Science And TechnologyOrganization, Canberra, Australia.
Dyer, A., 1974. A review of flux-profile relationships,
Boundary-Layer Meteorology, 7(3): 363-372.Ebuchi, N., 1999. Statistical distribution of wind speeds and directions globally observed by NSCAT,
Journal of Geophysical Research: Oceans, 104(C5): 11393-11403.
Furevik, B.R. and E. Korsbakken, 2000. Comparison of derived wind speed from synthetic aperture radar and scatterometer during the ERS tandem phase, IEEE Transactions on Geoscience and
Remote Sensing, 38(2): 1113-1121.
Graf, J.E., W.Y. Tsi, and L. Jones, 1998. Overview of QuikSCAT mission-a quick deployment of a high resolution, wide swath scanning scatterometer for ocean wind measurement, Proc. of IEEE
Southeastcon ’98 ‘Engineering for a New Era’,Orlando, FL, Apr. 24-26, pp. 314-317.
Han, H., S.H. Hong, H.C. Kim, T.B. Chae, and H.J.
Choi, 2017. A study of the feasibility of using KOMPSAT-5 SAR data to map sea ice in the Chukchi Sea in late summer, Remote Sensing
Letters, 8(5): 468-477.Harahsheh, H.A., 2016. Oil Spill Detection and Monitoring of Abu Dhabi Coastal Zone Using KOMPSAT-5 SAR Imagery, Proc. of XXIII International Society
for Photogrammetry and Remote Sensing Congress,Prague, Czech Republic, Jul. 12-19, vol. XLI- B8, pp. 1115-1121.
Hwang, J.I., S.H. Chae, D. Kim, and H.S. Jung, 2017.
Application of Artificial Neural Networks to Ship Detection from X-Band Kompsat-5 Imagery,
Applied Sciences, 7(9): 961.Jang, J.-C. and K.-A. Park, 2019. Oceanic Application of Satellite Synthetic Aperture Radar -Focused on Sea Surface Wind Retrieval-, Journal of
Korean Earth Science Society, 40(5): 447-463(in Korean with English abstract).
Jang, J.-C., K.-A. Park, and D. Yang, 2018. Validation of Sea Surface Wind Estimated from KOMPSAT-5 Backscattering Coefficient Data, Korean Journal
of Remote Sensing, 34(6): 1383-1398 (in Koreanwith English abstract).
Jang, J.-C., K.-A. Park, A.A. Mouche, B. Chapron, and J.-H. Lee, 2019. Validation of Sea Surface Wind from Sentinel-1A/B SAR Data in the Coastal Regions of the Korean Peninsula, IEEE Journal
of Selected Topics in Applied Earth Observations and Remote Sensing, 12(7): 2513-2529.Kim, S.-W., D.-H. Kim, and Y.K. Lee, 2018. Operational
ship monitoring based on integrated analysis of
KOMPSAT-5 SAR and AIS data, Korean Journal
of Remote Sensing, 34(2): 3327-3338 (in Koreanwith English abstract).
Koch, W., 2004. Directional analysis of SAR images aiming at wind direction, IEEE Transactions on
Geoscience and Remote Sensing, 42(4): 702-710.Lee, J.S., 1986. Speckle Suppression and Analysis for Synthetic Aperture Radar Images, Optical
Engineering, 25(5): 255636.Lee, S.R., 2010. Overview of KOMPSAT-5 program, mission, and system, Proc. of 2010 International
Geoscience and Remote Sensing Symposium,Honolulu, HI, Jul. 25-30, pp. 797-800.
Lehner, S., J. Horstmann, W. Koch, and W. Rosenthal, 1998. Mesoscale wind measurements using recalibrated ERS SAR images, Journal of
Geophysical Research: Oceans, 103(C4): 7847-7856.
Li, X., W. Zheng, W.G. Pichel, C.Z. Zou, and P.
Clemente-Colón, 2007. Coastal katabatic winds imaged by SAR, Geophysical Research Letters, 34(3).
Li, X., J.A. Zhang, X. Yang, W.G. Pichel, M. DeMaria, D. Long, and Z. Li, 2013. Tropical cyclone morphology from spaceborne synthetic aperture radar, Bulletin of the American Meteorological
Society, 94(2): 215-230.Li, X.M. and S. Lehner, 2014. Algorithm for sea surface wind retrieval from TerraSAR-X and TanDEM- X data, IEEE Transactions on Geoscience and
Remote Sensing, 52(5): 2928-2939.Liu, W.T., K.B. Katsaros, and J.A. Businger, 1979. Bulk parameterization of air-sea exchanges of heat and water vapor including the molecular constraints at the interface, Journal of the Atmospheric Sciences, 36(9): 1722-1735.
Liu, W. T. and W. Tang, 1996. Equivalent neutral
wind. JPL Publication 96-17, Jet PropulsionLaboratory, Pasadena, CA, USA.
Liu, W.T., W. Tang, and P.S. Polito, 1998. NASA
scatterometer provides global ocean-surface wind fields with more structures than numerical weather prediction, Geophysical Research Letters, 25(6):
761-764.
Mastin, G.A., 1985. Adaptive filters for digital image noise smoothing: An evaluation, Computer
Vision, Graphics, and Image Processing, 31(1):103-121.
National Data Buoy Center, 2009. Handbook of
automated data quality control checks and procedures, National Oceanic and AtmosphericAdministration, National Data Buoy Center, Mississippi, USA.
Park, K., P. Cornillon, and D.L. Codiga, 2006.
Modification of surface winds near ocean fronts:
Effects of Gulf Stream rings on scatterometer (QuikSCAT, NSCAT) wind observations, Journal
of Geophysical Research: Oceans, 111(C3).Paulson, C.A., 1970. The mathematical representation of wind speed and temperature profiles in the unstable atmospheric surface layer, Journal of
Applied Meteorology, 9(6): 857-861.Rodriguez, E., R.W. Gaston, S.L. Durden, B. Stiles, M.
Spencer, L. Veilleux, R. Hughes, D.E. Fernadez, S.C. Chan, S. Veleva, and R.S. Dunbar, 2009. A scatterometer for XOVWM, the extended ocean vector winds mission, Proc. of 2009 IEEE Radar
Conference, Pasadena, CA, May 4-8, pp. 1-4.Singh, P. and R. Shree, 2016. Analysis and effects of speckle noise in SAR images, Proc. of 2016
2nd Fall International Conference on Advances in Computing, Communication, and Automation (ICACCA), Bareilly, India, Sep. 30-Oct. 1, pp.1-5.
Smith, D.M., 1996. Speckle reduction and segmentation of Synthetic Aperture Radar images, International
Journal of Remote Sensing, 17(11): 2043-2057.Tang, W., W.T. Liu, and B.W. Stiles, 2004. Evaluation
of high-resolution ocean surface vector winds
measured by QuikSCAT scatterometer in coastal
regions, IEEE Transactions on Geoscience and
Remote Sensing, 42(8): 1762-1769.Thompson, D.R. and R.C. Beal, 1998. Mapping mesoscale and submesoscale wind fields using synthetic aperture radar, Proc. of 1998 International
Geoscience and Remote Sensing Symposium,Seattle, WA, Jul. 6-10, vol. 3, pp. 1382-1384.
Vachon, P.W. and F.W. Dobson, 2000. Wind retrieval from RADARSAT SAR images: Selection of a suitable C-band HH polarization wind retrieval model, Canadian Journal of Remote Sensing, 26(4): 306-313.
Wang, C., M. Liao, and X. Li, 2008. Ship detection in SAR image based on the alpha-stable distribution,
Sensors, 8(8): 4948-4960.Xi, Y., H. Lang, Y. Tao, L. Huang, and Z. Pei, 2017.
Four-component model-based decomposition for ship targets using polsar data, Remote Sensing, 9(6): 621.
Xie, T. and W. Perrie, 2010. Comparison of high winds retrieved from RADARSAT 2 SAR data with in situ buoy data and QuikScat wind vectors,
Proc. of SeaSAR 2010 - The 3rd InternationalWorkshop on Advances in SAR Oceanography from Envisat and ERS, Frascati, Italy, Jan. 25-29,