Factors affecting metabolic syndrome by lifestyle
N
am-K
yuNK
i1, 2), H
ae-K
agL
ee3), J
ae-H
waNC
Ho2)*, S
eoN-C
HiLK
im4), N
aK-S
aNgK
im5)1)
Department of Radiology, Korea Medical Institute, Republic of Korea
2)
Department of International Radiological Science, Hallym University of Graduate Studies:
427 Yeoksam-ro, Gangnam-gu, Seoul 135-841, Republic of Korea
3)
Department of Computer Science and Engineering, Soonchunhyang University, Republic of Korea
4)
Department of Biomedical Engineering, Keimyung University, Republic of Korea
5)
Department of Radiological Science, Songho College, Republic of Korea
Abstract. [Purpose] The aim of this study was to explore lifestyle factors in relation to metabolic syndrome so as to be able to utilize the results as baseline data for the furtherance of health-care and medical treatment. [Subjects and Methods] This study was conducted with patients who visited a health care center located in Seoul and had abdominal ultrasonography between 2 March 2013 and 28 February, 2014. Heights, weights, and blood pressures were measured by automatic devices. Three radiologists examined the patients using abdominal ultrasonography for gallstone diagnosis. The statuses of patients with regard to smoking, alcohol, coffee, and physical activities were explored for the lifestyle investigation. For investigating baseline demographics, we first used descriptive statistics.
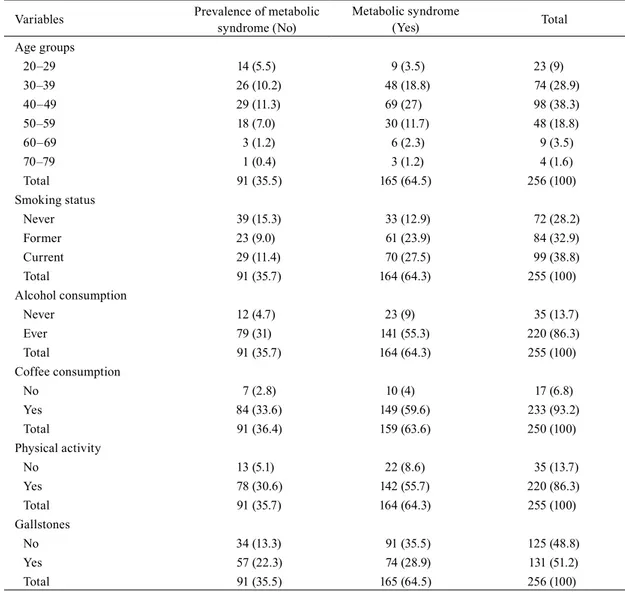
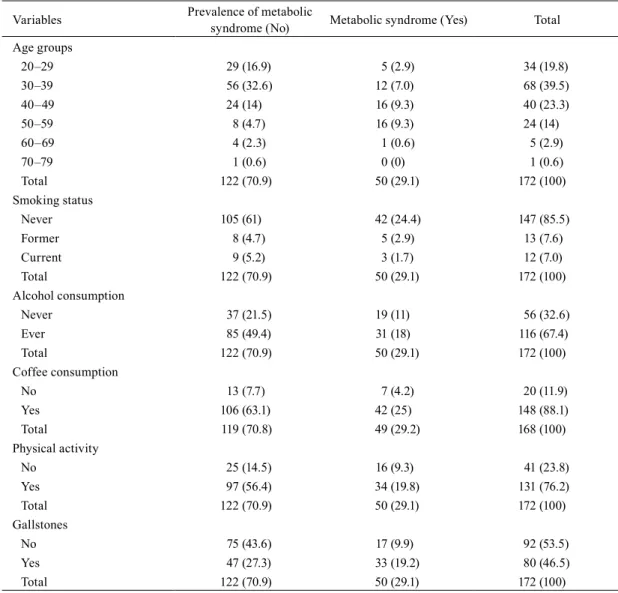
We then used the χ
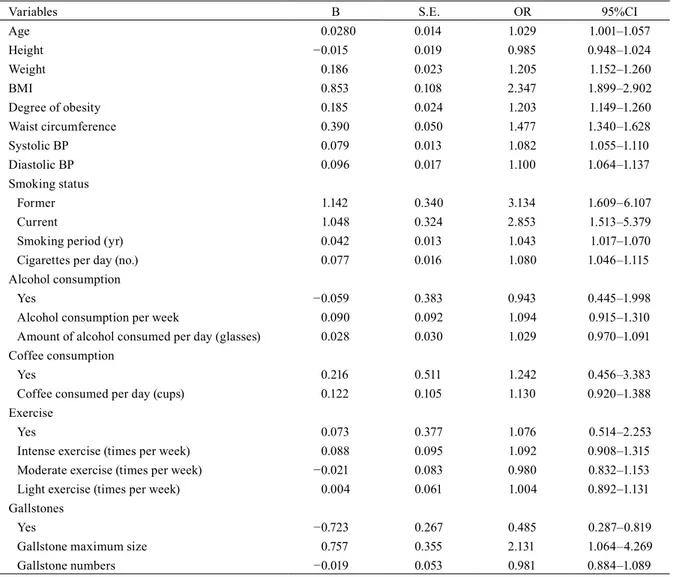
2test to analyze lifestyles and gallstone prevalence with regard to the presence of metabolic syndrome. Lastly, logistic regression analysis was conducted to discover the risk factors of metabolic syndrome.
[Results] For men, body mass index, maximum gallstone size, and waist circumference were revealed as risk factors for metabolic syndrome, in descending order of the degree of risk. For females, gallstone presence was the most significant risk factor, followed by waist circumference. [Conclusion] Metabolic disease mainly presents itself along with obesity, and we should become more focused on preventing and treating this disease. A large-scale prospective study is needed in the future, as the cause of nonalcoholic steatohepatitis remained unclear in this study.
Key words: Metabolic syndrome, Gallstone, Lifestyle
(This article was submitted Aug. 25, 2015, and was accepted Oct. 5, 2015)
INTRODUCTION
Recent data in 2014 from the National Statistical Office demonstrated that malignancy, cerebrovascular disease, cardio- vascular disease, pneumonia, and diabetes were, in order, the most common causes of death
1). Metabolic syndrome was reported to be a cause of mortality related to these diseases
2–9). Furthermore, westernized diets and lifestyle habits have caused the obesity rate grow in Korea. The mean prevalence rate of obesity in Organization for Economic Cooperation and Development (OECD) countries is 53.5%, more than half of the population. The prevalence in Korea is 33.7%, which is much lower than that in western countries. However, when we look at the annual rate of increase, obesity in Korea has continuously increased. In 2008, the obesity prevalence was 35.3% in males and 25.2% in females; in 2011, it was 35.1%
in males and 27.1% in females; and in 2012, it was 36.3% in males and 28% in females; these rates are based on the BMI value of 25 kg/m
2as an index
10). Obesity is known as major factor for chronic disease, and it can also affect quality of life and reduce life expectancy
11).
Gallstones are common, and the prevalence of gallstones is around two times higher in females in western countries
12). The prevalence rate becomes higher with age, so in the elderly population, it finally reaches approximately 30% in people in their 70s regardless of gender. Currently, abdominal ultrasonography is most widely used for the diagnosis of gallstones, as it is cost-effective. Gallstone presence without symptoms is common, and it is supposed that it may be closely related to
J. Phys. Ther. Sci. 28: 38–45, 2016