Nitrous Oxide Emissions from Red Pepper,
Chinese Cabbage, and Potato Fields in Gangwon-do, Korea
Youngho Seo, Gunyeob Kim
1*, Kijin Park, Kyunghi Kim, and Yeong-Sang Jung
2Gangwon Agricultural Research & Extension Services, Chuncheon 200-150, Korea
1
National Academy of Agricultural Science, RDA, Suwon 441-707, Korea
2
Kangwon National University. Chuncheon 200-701, Korea
(Received: August 12 2013, Accepted: November 18 2013)
The level of nitrous oxide (N
2O), a long-lived greenhouse gas, in atmosphere has increased mainly due to anthropogenic source, especially application of nitrogen fertilizers. Quantifying N
2O emission from agricultural field is essential to develop national inventories of greenhouse gases (GHGs) emission. The objective of the study was to develop emission factor to estimate direct N
2O emission from agricultural field in Gangwon-do, Korea by measuring N
2O emissions from potato (Solanum tuberosum), red pepper (Capsicum annum L.), and Chinese cabbage (Brassica campestris L.) cultivation lands from 2009 to 2012. Accumulated N
2O emission was 1.48±0.25 kg N
2O-N ha
-1for red pepper, 1.27±0.27 kg N
2O-N ha
-1for potato, 1.49±0.06 kg N
2O-N ha
-1for Chinese cabbage cultivated in spring, and 1.14±0.22 kg N
2O-N ha
-1for fall Chinese cabbage.
Emission factor of N
2O calculated from accumulated N
2O emission, nitrogen fertilization rate, and background N
2O emission was 0.0051±0.0016 kg N
2O-N kg
-1N for cropland in Gangwon province. More extensive study is deserved to be conducted to develop N
2O emission factor for upland crops in Korea through examining the emission factors from various regions and crops because N
2O emission is influenced by many factors including climate characteristics, soil properties, and agricultural practices.
Key words: Chinese cabbage, Greenhouse gas, Nitrous oxide, Potato, Red pepper
N
2O emission factors, kg N
2O-N kg N
-1, for Chinese cabbage, red pepper, and potato from 2009 to 2012.
Crop 2009 2010 2011 2012 Mean±SD
Red pepper 0.00676 0.00548 0.00640 0.00545 0.00602±0.00066
Potato 0.00800 0.00616 0.00702 0.00541 0.00665±0.00112
CC, S 0.00405 0.00422 0.00483 0.00447 0.00439±0.00034
CC, F 0.00308 0.00226 0.00387 0.00355 0.00319±0.00070
1)
*Corresponding author : Phone: +82312900240, Fax: +82332486905, E-mail: [email protected]
§
Acknowledgement: This study was carried out with the support of “Cooperative Research Program for Agricultural Science &
Technology Development (Project No. PJ009315052013)”, Rural Develop- ment Administration, Republic of Korea.
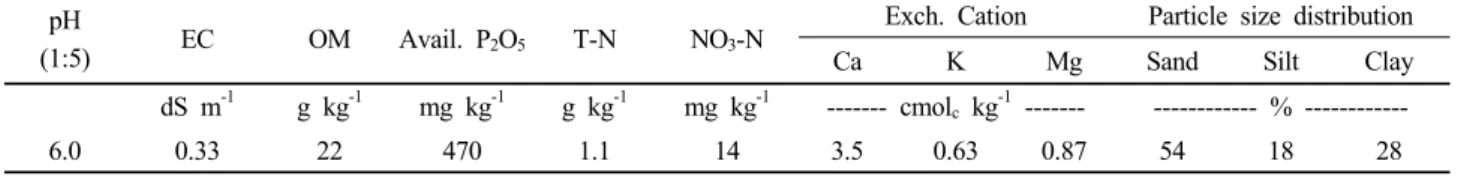
Table 1. Selected physico-chemical characteristics of the field used in the study.
pH
(1:5) EC OM Avail. P
2O
5T-N NO
3-N Exch. Cation Particle size distribution
Ca K Mg Sand Silt Clay
dS m
-1g kg
-1mg kg
-1g kg
-1mg kg
-1--- cmol
ckg
-1--- --- % ---
6.0 0.33 22 470 1.1 14 3.5 0.63 0.87 54 18 28
Introduction
Atmospheric nitrous oxide (N
2O) level has increased at a rate of 0.2~0.3% per year (Saggar et al., 2009). The concentration of N
2O in atmosphere was 314 ppbv in 1998 (IPCC, 2001), while 285 ppbv before 1700 (Stauffer and Neftel, 1988).
Park et al. (2012) concluded that rise in N
2O concentration in atmosphere was mainly due to an increased application of nitrogen fertilizers by investigating trends and seasonal cycles in the isotopic composition of nitrous oxide from 1940 to 2005. Nitrous oxide has approximately 300 times the global warming potential of carbon dioxide (CO
2) based on a 100 yr time horizon (IPCC, 2007).
Nitrous oxide is produced in agricultural soils after amending nitrogen fertilizers and manure compost through both nitrification and denitrification by the microbial activity (Freney, 1997;
Singh and Tyagi, 2009). Nitrification is an oxidation process of ammonia produced from nitrogen fertilizer or compost to nitrate under aerobic condition, and denitrification is a reduction process of nitrate to N
2O and N
2under anaerobic condition. Nitrous oxide emission from agricultural soils is significantly determined by N application rate, soil organic carbon content, soil pH, texture, crop type, and the type of fertilization source (Stehfest, 2008).
In Korea, N
2O estimates have been based on Intergovernmental Panel on Climate Change (IPCC) emission factor methodology due to absence of country-specific emission factor for N
2O.
The default value for N
2O emission factor has been changed from 0.0125 to 0.01 of N applied to the cropped soils (IPCC, 2006), which means that 1% of unvolatilized N inputs are produced in the soil as direct N
2O emission. Country-specific emission factor can be more representative of soil, climate, and agricultural practices in Korea, resulting in more accurate and lesser uncertainty than the default factor. Many developed countries have used their own N
2O emission factor; 0.0062 kg N
2O-N kg
-1N for all fertilized upland fields in Japan (Akiyama et al., 2006), 0.01~0.015 kg N
2O-N kg
-1N for Sweden (Swedish Environmental Protection Agency, 2006), 0.01 kg N
2O-N kg
-1N for chemical fertilizers and 0.02 kg N
2O-N kg
-1N for animal manure in the Netherlands (Netherlands Environmental Assessment Agency, 2006), and 0.003 kg N
2O-N kg
-1N for rain fed upland in dry region and 0.021 kg N
2O-N kg
-1N for horticultural crops in Australia (Australian Greenhouse Office, 2006).
This study was conducted in order to assess N
2O emissions
from potato (Solanum tuberosum), red pepper (Capsicum annum L.), and Chinese cabbage (Brassica campestris L.) cultivation land in Gangwon-do, Korea and to provide information for developing Korea-specific N
2O emission factor.
Materials and Methods
Crop cultivation Three crops including potato (Solanum tuberosum), red pepper (Capsicum annum L.), and Chinese cabbage (Brassica campestris L.) were cultivated at the Gangwon-do Agricultural Research & Extension Services field in Chuncheon (N 37° 57’ 15.9” E 127° 46’ 26.6”), Korea from 2009 to 2012. The crops were transplanted on Apr. 29, 2009, May 5, 2010, May 3, 2011, and May 11, 2012. Chinese cabbage was cultivated twice a year, spring and fall, and the other crops were grown once a year. Chinese cabbage in fall was transplanted on Aug.
26, 2009, Sep. 5, 2010, Aug. 23, 2011, and Sep. 5, 2012.
The soil in the field is classified to Yonggye series (fine loamy, mixed, mesic Typic Dystrudepts) and the selected physic-chemical properties of the soil are provided in Table 1. Fertilizers were applied based on standard fertilization rate of the three crops; N-P
2O
5-K
2O = 320-78-198 kg ha
-1for Chinese cabbage, 190-112-149 kg ha
-1for red pepper, and 137-33-114 kg ha
-1for potato. All the fertilizers were applied before planting potato. For Chinese cabbage, 52%
of nitrogen was applied before transplanting and 48% was split twice during cultivation. For red pepper, 54% of the fertilizers were applied before transplanting and the rest 46% was split three times during cultivation. Potato was harvested on July 10, 2009, July 27, 2010, July 18, 2011, and July 24, 2012. For Chinese cabbage, the harvesting dates were June 30, 2009, Nov. 16, 2009, July 1, 2010, Nov. 25, 2010, July 28, 2011, Nov. 23, 2011, July 10, 2012, and Nov. 20, 2012. The treatments were arranged in a randomized block design with three replicates. The plot size of each replicate was 18 m
2.
Collection and analysis of nitrous oxide Gas samples
were collected using static chambers, the most commonly
used tools worldwide for the greenhouse gas research (Kim
et al., 2006; Kim et al., 2008; Saggar et al., 2009; Kim
et al., 2010; Seo et al., 2012; Yang et al., 2012a; Yang et
al., 2012b; Yang et al., 2012c), twice a week from just
Fig. 1. Mean air temperature during the study period compared with normal data (1981~2010).
Fig. 2. Mean air temperature during the study period compared with normal data (1981~2010).
after transplanting the crops to next growing season in the following year. Parkin (2008) reported that gas sampling at 1-4 days intervals resulted in cumulative N
2O emissions with a precision of ±10% compared with ±14% for 3-7 days intervals. The level of nitrous oxide in the gas samples was determined by a gas chromatography (Varian GC 450) equipped with an electron capture detector (ECD). Flux of N
2O was calculated using the following equation (Shin et al., 2003; Kim et al., 2008; Kim et al., 2010; Seo et al., 2012):
F = ρ·V·A
-1·Δc·Δt
-1·273·T
-1where F is N
2O flux (mg m
-2h
-1), ρ is the gas density of N
2O (1.96 mg m
-3), V is the volume of the chamber (m
3), A is the area of the chamber (m
2), Δc·Δt
-1is the average increase of gas concentration in the chamber, and T is mean temperature in the chamber (℃) plus 273. For the greenhouse gas flux measurements using chamber, linear regression is less sensitive to chamber deployment time and analytical precision than other methods and has small detection limit thresholds (Parkin et al., 2012). Emission factor is calculated by dividing accumulated N
2O emission from cultivated plots by unvolatilized portion of the applied nitrogen.
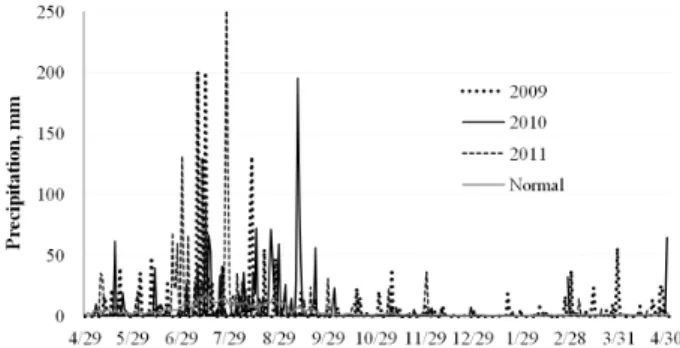
Climatic condition Mean air temperature and precipitation during the study period are shown in Fig. 1 and Fig. 2, respectively. The mean air temperature in 2009, 2010, and 2011 was 10.3℃, 10.3℃, and 10.8℃, respectively, which is 0.4~0.9℃ below the normal data (1981~2010), 11.2℃.
The annual precipitation in 2009, 2010, and 2011 was 1,789 mm, 1,634 mm, and 1,851 mm, respectively, which is about 300-500 mm higher than the normal data, 1,325 mm.
Results and Discussion
Emission rates of N
2O for red pepper were less than 35.5 g N
2O-N ha
-1d
-1in 2009, 19.8 g N
2O-N ha
-1d
-1in 2010, 26.9 g N
2O-N ha
-1d
-1in 2011, and 26.3 g N
2O-N ha
-1d
-1in 2012 (Fig. 3). For potato, the highest N
2O emissions rate was 29.5 g N
2O-N ha
-1d
-1in 2009, 16.3 g N
2O-N ha
-1d
-1in 2010, 28.5 g N
2O-N ha
-1d
-1in 2011, and 30.7 g N
2O-N ha
-1d
-1in 2012. Most of N
2O emission occurred during first three months for the two crops. Chinese cabbage cultivated in fall showed different N
2O emission pattern from the emission pattern for spring cultivation. Nitrous oxide emission rates markedly increased immediately after transplanting the crop in fall, up to 98.3 g N
2O-N ha
-1d
-1in 2009, 79.2 g N
2O-N ha
-1d
-1in 2010, 60.3 g N
2O-N ha
-1d
-1in 2011, and 64.8 g N
2O-N ha
-1d
-1in 2012 compared with 53.3 g N
2O-N ha
-1d
-1, 37.4 g N
2O-N ha
-1d
-1, 37.5 g N
2O-N ha
-1d
-1, and 40.8 g N
2O-N ha
-1d
-1, respectively for each spring cultivation probably because of greater activity of microorganisms by relatively high temperature and precipitation at transplanting (Fig. 1 and 2). The N
2O emission rates, however, sharply decreased after the peak emission and even reach almost zero in late fall and winter possibly because of decreasing temperature and soil inorganic- nitrogen level. Kim et al. (2008) reported that relative contribution of inorganic-nitrogen and soil temperature to N
2O emission was 24~51% and 26~36%, respectively for red pepper cultivation.
Accumulated N
2O emission for red pepper was 1.83 kg
N
2O-N ha
-1in 2009, 1.31 kg N
2O-N ha
-1in 2010, 1.46
kg N
2O-N ha
-1in 2011, and 1.31 kg N
2O-N ha
-1in 2012
(Fig. 4), 1.66 kg N
2O-N ha
-1in 2009, 1.13 kg N
2O-N
ha
-1in 2010, 1.23 kg N
2O-N ha
-1in 2011, and 1.04 kg
N
2O-N ha
-1in 2012 for potato, 1.51 kg N
2O-N ha
-1in 2009,
1.41 kg N
2O-N ha
-1in 2010, 1.53 kg N
2O-N ha
-1in 2011,
and 1.52 kg N
2O-N ha
-1in 2012 for spring cultivated
Chinese cabbage, and 1.22 kg N
2O-N ha
-1in 2009, 0.82 kg
N
2O-N ha
-1in 2010, 1.34 kg N
2O-N ha
-1in 2011, and 1.17 kg
N
2O-N ha
-1in 2012 for fall Chinese cabbage. In 2012,
the gas samples were collected until Nov. 22, resulting in
shorter analysis duration, 196 days than the other three
years, 317~370 days. It needs to be noted very low N
2O
emission in winter due to low temperature and residual
nitrogen from 2009 to 2011 (Fig. 3). Cantarel et al. (2011)
reported significant increase in N
2O emissions with increase
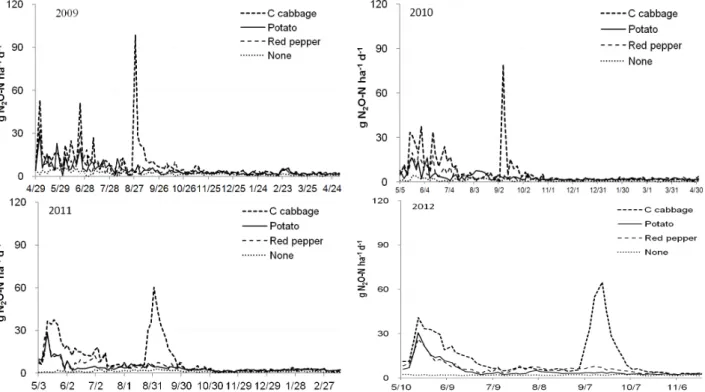
Fig. 3. N
2O emission patterns of Chinese cabbage, red pepper, and potato from 2009 to 2012. Chinese cabbage was cultivated twice a year, spring and fall, while once a year for red pepper and potato.
Fig. 4. Accumulated N
2O emission from cultivation of Chinese cabbage, red pepper, and potato from 2009 to 2012. CC, S and CC, F denote Chinese cabbage cultivated in spring and fall, respectively. Error bars indicate standard deviation.
in temperature and Kim et al. (2008) showed that mineral nitrogen level in soil greatly affected N
2O emission. Kim et al. (2010) reported that N
2O emission from soybean field was influenced by soil inorganic nitrogen (66%), soil moisture
(19%), and temperature (15%). In addition, Akiyama et
al. (2006) developed N
2O emission factor for Japan based
on data measuring over 90 days by assuming that most
N
2O resulted from fertilizer application is emitted in less
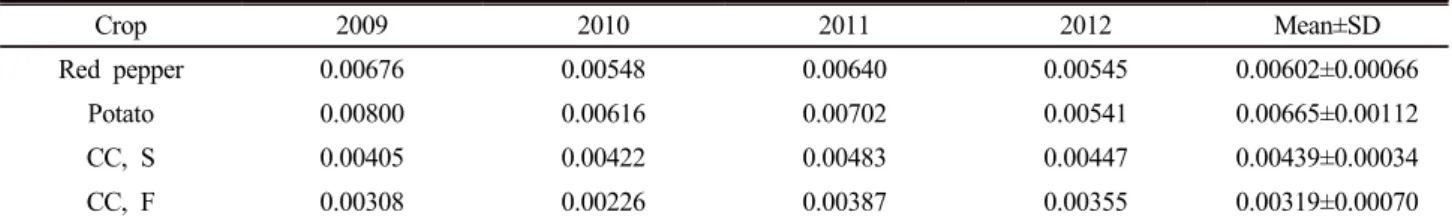
Table 2. N
2O emission factor
†, kg N
2O-N kg N
-1, for Chinese cabbage, red pepper, and potato from 2009 to 2012. CC, S and CC, F denote Chinese cabbage cultivated in spring and fall, respectively.
Crop 2009 2010 2011 2012 Mean±SD
Red pepper 0.00676 0.00548 0.00640 0.00545 0.00602±0.00066
Potato 0.00800 0.00616 0.00702 0.00541 0.00665±0.00112
CC, S 0.00405 0.00422 0.00483 0.00447 0.00439±0.00034
CC, F 0.00308 0.00226 0.00387 0.00355 0.00319±0.00070
†