JDCS
Vol. 18, No. 8, pp. 1671-1676, Dec. 2017프라이버시 보존 데이터 수집을 지원하기 위한 시뮬레이션 툴 개발
김 대 호 · 김 종 욱* 상명대학교 컴퓨터과학과
Development of Simulation Tool to Support Privacy-Preserving Data Collection
Dae-Ho Kim · Jong Wook Kim*
Department of Computer Science, Sangmyung University, Seoul 110-743, Korea
[요 약]
빅데이터 시대의 도래로 다양한 데이터들이 발생되고 있다. 많은 산업 부분에서는 이러한 데이터들을 수집하여 분석하고자 한 다. 하지만 사용자 정보 수집은 직접적인 개인정보 유출을 초래할 수 있다. 구글(Google) 사에서 제안한 지역 차분 프라이버시 기 법은 데이터 변조를 통해 사용자 정보 수집에 있어 발생할 수 있는 개인정보 유출을 방지한다. 이러한 데이터 변조를 통한 개인정 보 유출 방지는 그 변조되는 정도가 높을수록 개인정보를 강력히 보장하지만 이와 반대로 데이터의 활용도는 현저히 떨어진다. 그 래서 데이터 변조의 정도를 데이터 수집목적에 적합하게 설정해야한다. 본 논문에서 제시하는 시뮬레이션 도구는 지역 차분 프라 이버시를 만족하는 사용자 정보 수집에 있어 설정해야하는 다양한 변수값을 데이터 수집환경에 맞게 적용함으로써 데이터 수집 가가 자신의 환경에 맞는 데이터 수집을 할 수 있도록 지원한다.
[Abstract]
In theses days, data has been explosively generated in diverse industrial areas. Accordingly, many industries want to collect and analyze these data to improve their products or services. However, collecting user data can lead to significant personal information leakage. Local differential privacy (LDP) proposed by Google is the state-of-the-art approach that is used to protect individual privacy in the process of data collection. LDP guarantees that the privacy of the user is protected by perturbing the original data at the user’s side, but a data collector is still able to obtain population statistics from collected user data. However, the prevention of leakage of personal information through such data perturbation mechanism may cause the significant reduction in the data utilization. Therefore, the degree of data perturbation in LDP should be set properly depending on the data collection and analysis purposes. Thus, in this paper, we develop the simulation tool which aims to help the data collector to properly chose the degree of data perturbation in LDP by providing her/him visualized simulated results with various parameter configurations.
색인어 : 차분 프라이버시, 지역 차분 프라이버시, 데이터 시각화.
Key word : Differential Privacy, Local Differential Privacy, Data Visualization.
http://dx.doi.org/10.9728/dcs.2017.18.8.1671
This is an Open Access article distributed under the terms of the Creative Commons Attribution Non-CommercialLicense(http://creativecommons .org/licenses/by-nc/3.0/) which permits unrestricted non-commercial use, distribution, and reproduction in any medium, provided the original work is properly cited.
Received 10 December 2017;Revised 22 December 2017 Accepted 25 December 2017
*Corresponding Author; Jong Wook Kim Tel: +82-02-781-7590
E-mail: [email protected]
Ⅰ. Introduction
With the advent of the IoT era and the spread of smartphones, data has been explosively generated in many industrial areas.
Recently, it has been noted that big data analysis generates great value in diverse industrial areas. For example, Nordstrom, a large department store in the United States, collected wireless internet signals from smartphones of customers, and used them to analyze customers’ indoor movement patterns and identify customer shopping patterns. In addition, Wal-Mart, a global retail chain, used its own applications and in-store sensors in order to collect and analyze customers’ shopping path data for store configuration and marketing.
As there is a growing interest in utilizing big data for decision-making, the risk of personal information leakage is also increasing, because it is common that the user data includes the sensitive personal information. Therefore, when collecting user data, such sensitive personal information should be removed.
Otherwise, it may lead to direct personal information leakage. For this reason, various privacy preserving schemes are currently being studied to prevent the leakage of personal information that may occur in the process of user data collection. Local Differential Privacy(LDP) is the state-of-the-art approach that is used to protect individual privacy in the process of data collection [1,4,5,6]. LDP guarantees that the privacy of the user is protected by perturbing the original data at the user’s side, and thus, data collector can not access the original user data, but is still able to obtain population statistics from the collected perturbed data. However, the prevention of leakage of personal information through such data perturbation mechanism may cause the significant reduction in the data utilization. Therefore, the degree of data perturbation in LDP should be set properly depending on the data collection and analysis purposes. Thus, in this paper, we develop the simulation tool which aims to help the data collector to properly chose the degree of data perturbation in LDP by providing her/him visualized simulated results with various parameter configurations.
The rest of this paper is organized as follows. Chapter 2 provides background information and Chapter 3 describes the system structure developed in this paper. In Chapter 4, a case study on collecting user indoor positioning data is presented.
Finally, Chapter 5 concludes the paper.
Ⅱ. Background Knowledge 2-1 Differential Privacy
Differential Privacy proposed by C. Dwork [2] ensures that no matter what background the attacker has, it is not possible to determine whether a particular individual is included in the results of the query. Given a user query, differential privacy mechanism adds carefully designed random noise to the true result of the query. Through such result perturbation, an attacker cannot distinguish more than a certain probability whether a particular set of individuals is included in the data set from which the result of the query is derived. Differential privacy is formally defined as follows: a randomized function A satisfies ε-differential privacy, if and only if for (1) all database tables D and D’ differing by at most one tuple and (2) any output O of A, the following equation holds
′
≤ (1)
Generally, in order to achieve ε-differential privacy, the random noise generated from a Laplace distribution is added to the true query result [2,3,8,9,10].
2-2 Local Differential Privacy
Differential privacy, which perturbs the true result of the query and provides the noised result to the user, is designed to guarantee privacy in data sharing. On the other hands, local difference privacy is designed for the setting in which users (i.e., data contributors) are asked to report their local data to a data collector. Local differential privacy is formally defined as follows: a randomized algorithm A satisfies ε-differential privacy, if and only if for (1) all pairs of user’s data vi and vj, and (2) any output O of A, the following equation holds [1]:
≤ (2)
The above equation implies that no matter what data a collector receives from an user, the collector cannot infer with high confidence whether the user has sent vi or vj.
2-3 Application of Rappor
LDP is first implemented in Google Chrome browser to collect and track the client-side data under the name of RAPPOR (Randomized Aggregatable Privacy-Preserving Ordinal Response) project. The simulation tool developed in this paper assumes a situation where local data is collected by applying the data transformation mechanism of RAPPOR. The details are as
follows:
(1) Let us assume that an user data is represented as a n-bit array L where the k-th bit of L is set to 1, and the others are set to 0.
(3)
(2) The next step is to modify the data by a randomized response method [7]. Each bit of L is modified by the randomized response as follows:
(4)
Here, f is a parameter that controls the level of privacy (or the level of data perturbation). Note that f has a value between 0 and 1. The closer the f value is to 1, the stronger the privacy is guaranteed.
(3) The next step is to transform U into S by adding another randomness into U as follows:
if if (5)Here, q and p are parameters that control the level of privacy (or the level of data perturbation). The probability that the k-th bit of S is set to 1 is determined by p (or q) and Uk. According to RAPPOR, the above random encoding method satisfies ε-differential privacy guarantee. Finally, the user sends S to the data collector.
Ⅲ. System Structure
As can be seen from the procedure described in Subsection III-2, the difference between the original data and the transformed data depends on three parameters (i.e., f, p and q) used in the data perturbation process. The greater the difference between the original data and the noised data, the stronger the privacy of the data. However, this greatly degrades the utilization of data.
Therefore, it is important to properly set values of these parameters, depending on the data collection and analysis purposes. Thus, in this paper, we develop the simulation tool which aims to help the data collector to properly chose the degree of data perturbation in LDP by providing her/him visualized simulated results with various parameter configurations. In particular, the developed tool enables to simulate various variable
settings for the user data collection environment, allowing the data collector to choose more suitable parameters for his/her data collection and analysis purposes.
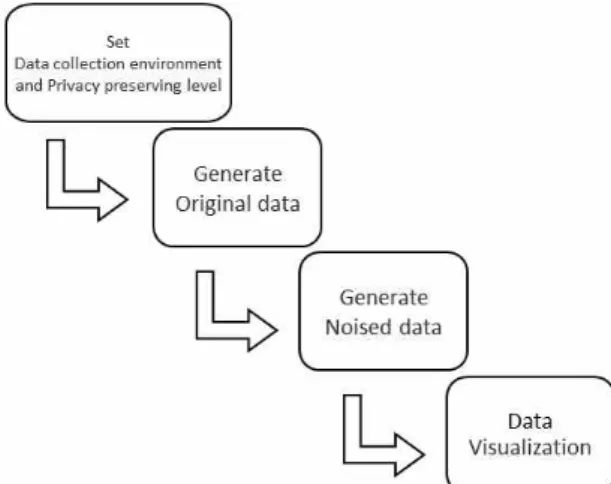
The simulation tool presented in this paper consists of four phases (Figure. 1).
(1) The simulation tool receives f, p, and q values from the user.
Note that these values determine the level of privacy, and thus the degree of data perturbation.
(2) Next, a synthetic data set which corresponds to a set of user data (i.e., the n-bit array L of step 1 in Subsection 2-3) is generated.
(3) As explained in the step 2 and 3 in Subsection 2-3, based on the input f, p, and q values, the simulation tool adds random noises to the original synthetic user data set generated from the previous phase.
(4) Finally, the simulation tool shows the two visualized results obtained from the original synthetic data set that is generated in the phase 2 and the noised data set that is generated in the phase 3.
A more detailed process will be described in the case study of Section IV.
Fig. 1. An overview of the developed simulation tool
Ⅳ. Case Study: Indoor Positioning Data
In this chapter, we present a case study of applying the developed simulation tool to the collection of indoor positioning data. Especially, we consider the scenario where (a) the number of beacons (which are used to estimate the indoor position of each user) is x×y, each of which is located at each grid of a x×y unit square of grids, (b) the beacon IDs are from 1 to n (=x×y), and (c) the beacon ID with the strongest signal is selected as the user’s current indoor location. Thus, if i (1≤i≤ n) is the beacon ID with
the strongest signal, a corresponding indoor positioning data is represented as a n-bit array, L, in which the i-th bit of L is set to 1, and the others are set to 0.
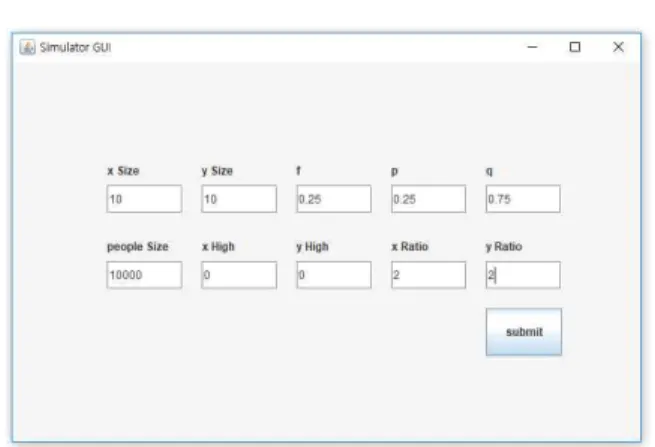
3-1 Setting Privacy Level
Fig. 2. An example of setting privacy level and data generation configuration
At the first phase, an user sets the values of f, p, and q to determine the level of privacy, and thus the degree of data perturbation (Figure 2). Furthermore, the data collection environment (i.e., the values of x and y, the number of collected data, and the degree of data skewness) is configured in this phase.
Once all the required parameter settings are completed, then the user can click the ‘submit’ button to proceed to the next step.
3-2 Generate Synthetic Data Set
In the next phase, the simulation tool generates synthetic indoor location data set, according to the data collection environment values that were set by the previous phase. As explained earlier, the synthetic data is generated such that the number of bits equals to n (=x×y) and randomly selected bit is set to 1 and the others are set to 0.
Fig. 3. An example of synthetic data set
Figure 3 shows a part of the synthetic indoor positioning data set generated by the simulation tool where the values of x and y are set to 10. As shown in Figure 3, the synthetic indoor
positioning data consists of an index and a bit array with ‘_’ as delimiters. The bit array of the data has a value of 1 only for the bit corresponding to the indoor location where the user is located, and the remaining bits are represented by 0.
3-3 Generate Noised data
In this phase, the simulation tool reads the original synthetic data generated in the previous phase and adds random noise to it according to the input f, p, and q values. The data perturbation in this phase is performed by the method of equation (4) and (5) in Subsection 2-3. Figure 4 shows the result of adding random noise to the original synthetic data of Figure 3 with f = 0.25, p = 0.25, q
= 0.75.
Fig. 4. An example of generating noised data 3-4 Visualize Results
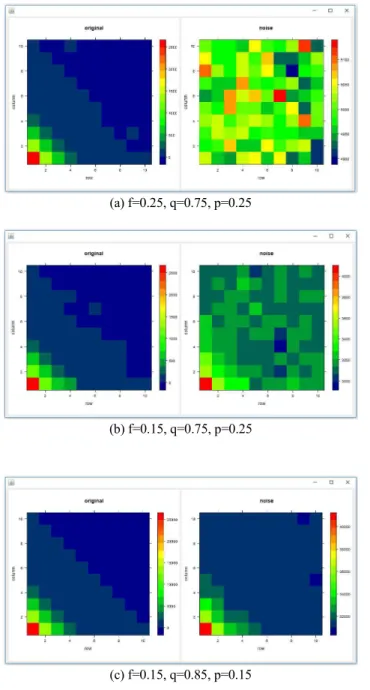
In the last phase, the simulation tool visualizes results by using the Heatmap format [11] so that the user can more easily compare the result obtained from the original synthetic data with that computed with the noised data[12]. In particular, the developed simulation tool computes the density of indoor location associated with each beacon (which is one of the most common task in indoor location-based service) and shows the visualized density heatmaps. The more the number of people in the indoor area is, the more reddish it appears in the density headmap, and the fewer it is, the more blue it appears.
Figure 5 shows the visualized density heatmaps generated with various configurations. In this figure, the left heatmap is generated based on the original (and thus unnoised) synthetic data, while the right one is computed based on the noised data. In this figure, the number of collected user data is set to 10,000.
Figure 5-(a) plots the result when f, q, and p are set to 0.25, 0.75 and 0.25 respectively which corresponds to ε= ln(4.84). Figure 5-(b) shows the result when f, q, and p are set to 0.15, 0.75 and 0.25 respectively which corresponds to ε= ln(9). Finally, Figure 5-(c) visualizes the result when f, q, and p are set to 0.15, 0.85 and 0.15 which corresponds to ε= ln(15.5). Note that the level of privacy (and thus, the level of data perturbation) decreases, as ε
increases. As can be seen in the figure, among these three results, the best one is observed in Figure 5-(c). In this way, the data collector comes to know that when the number of collected data is 10,000, the level of privacy corresponding to ε= ln(15.5) is required for the data analysis scenario which demands high precision.
(a) f=0.25, q=0.75, p=0.25
(b) f=0.15, q=0.75, p=0.25
(c) f=0.15, q=0.85, p=0.15
Fig. 5. Example of visualized heatmap results with various configurations.
Ⅴ. Conclusion and Future Work
Before collecting data from users by local differential privacy scheme, data collectors need to properly set the privacy level
depending on the data collection and analysis purposes. The simulation tool presented in this paper aims to help the data collectors to properly select the degree of privacy level in LDP by providing them visualized simulated results with various parameter configurations.
Currently, the presented simulation tool is implemented based on the scenario where the data collector intends to collect indoor positioning data. The future plan is to expand the current simulation tool so that it can be used for various data collection scenarios
Acknowledgements
This research was supported by a Research Grant from Sangmyung University.
Reference
[1] U. Erlingsson, V. Pihur, and A. Korolova. “RAPPOR:
Randomized Aggregatable Privacy-Preserving Ordinal Response”. in Proceedings of the 2014 ACM SIGSAC Conference on Computer and Communications Security, pp.1054-1067, 2014.
[2] C. Dwork. “Differential privacy”. in Proceedings of the 33rd International Conference on Automata, Languages and Programming, pp. 338-340, 2006.
[3] C. Dwork, F. McSherry, K. Nissim, and A. Smith.
“Calibrating noise to sensitivity in private data analysis”. In Proceedings of the Third conference on Theory of Cryptography, 2006.
[4] G. Fanti, V. Pihur, and U. Erlingsson. “Building a RAPPOR with the Unknown: Privacy-Preserving Learning of Associations and Data Dictionaries”. in Proceedings of the Privacy Enhancing Technologies Symposium, pp. 41-61 2016.
[5] Z. Qin, Y. Yang, T. Yu, I. Khalil, X. Xiao, and K. Ren.
“Heavy Hitter Estimation over Set-Valued Data with Local Differential Privacy”, in Proceedings of the 2016 ACM SIGSAC Conference on Computer and Communications Security, pp. 192-203, 2016.
[6] J.W. Kim, D.H. Kim and B.C. Jang. “Application of Local Differential Privacy to Collection of Indoor Positioning Data”, under submission.
[7] S. L. Warner. “Randomized response: a survey technique for eliminating evasive answer bias”. Journal of the American Statistical Association, 60(309), 1965.
[8] S. Peng, Y. Yang, Z. Zhang, M. Winslett and Y. Yu. “Query
optimization for differentially private data management systems”, In Proceedings of the IEEE International Conference on Data Engineering, 2013.
[9] W. Qardaji, W. Yang and N. Li. “Differentially private grids for geospatial data”, In Proceedings of the IEEE International Conference on Data Engineering, 2013.
[10] A. Friedman and A. Schuster. “Data Mining with Differential Privacy”, in Proceedings of the 16th ACM SIGKDD international conference on Knowledge discovery and data mining, pp. 493-502, 2010
[11] A. Pryke, S. Mostaghim, “A. Nazemi. Heatmap Visualisation of Population Based Multi Objective Algorithms”, in International Conference on Evolutionary Multi-Criterion Optimization, pp. 361-375, 2007
[12] S.H. Bak, H.B. You, J.H. Bae, T.J. Choi. “Implementation of Public Data Contents Using Big Data Visualization Technology – Focusing on Utilization of Map Visualization Technique”, Journal of the Digital Contents Society, Vol.
18, No.7, pp. 1427-1434, 2017
Dae-Ho Kim
2017 : Sangmyung University (BS) 2017 ~ now: Sangmyung University,
Department of Computer Science (Master Student)
Research Interests: Data Privacy, Big Data
Jong Wook Kim
2000 : Korea University (BS) 2002 : KAIST (MS)
2009 : Arizona State University (Ph.D)
2009~2010: Technicolor 2010~2013: Teradata
2013~now : Assistant Professor in Department of Computer Science at Sangmyung University Research Interests: Database System, Data Privacy