롤러 레벨링 공정시 후판의 잔류응력 예측 - Part II : 가속냉각 모델을 통합한 모델
예호성
1 · 황상무#Prediction of the Residual Stress for a Steel Plate after Roller Leveling - Part II : Integrated Model with
Accelerated Cooling Model
H. S. Ye, S. M. Hwang
(Received December 7, 2012 / Revised January 17, 2013 / Accepted January 22, 2013)
Abstract
Despite its importance the control of roller leveling has primarily relied on the operator’s experience and on operation tables. In order to effectively eliminate various shape defects, the optimal leveling condition for a specific mode of plate deformation needs to be determined as well as a careful evaluation as to whether or not the condition is still appropriate for other modes or not. A numerical model, which considers both computation efficiency and accuracy, has been developed. The variations of residual stress are studied according to the entry and the delivery intermeshes, respectively.
The camber deformation decreases linearly as the entry intermesh increases. In contrast the curl deformation does not vary directly with the entry intermesh. Therefore, the optimum intermesh values need to be determined in order to simultaneously minimize both the camber and the curl deformation.
Key Words : Roller Leveling, Residual Stress, Camber, Curl
1. 서 론
후판의 냉각 과정에서 불균일 냉각으로 제품의 불량이 야기되고, 또한 선급재 등 가속냉각 후판 제품 대다수가 소절시 크고 작은 소절휨(camber) 과 길이방향의 휨(curl)을 발생시킨다. 이러한 변형 을 제어하기 위해 현장에서는 롤러 레벨링을 사 용하는데, 작업자의 경험이나 단순한 테이블에 의 존하고 있다. 이로 인해 롤러 레벨링 후에도 제품 의 불량이 발생되어 생산성을 감소시키고 있어 좀 더 정확한 롤러 레벨링 조건을 해석할 필요가 있다.
직접적으로 현장에서 롤러 레벨링 전의 잔류응 력을 측정할 방법이 없어 가속냉각 과정에서 온 도 분포를 이용한 잔류응력 예측 모델을 롤러 레 벨링 잔류응력 예측 모델과 통합하여 가속냉각부 터 롤러 레벨링까지 전 과정의 잔류응력을 예측 하도록 하였다. 이를 이용하여 롤러 레벨링 공정 에서 입측과 출측의 압입량 조절을 통해, 판에 걸 리는 소성률(plasrtic ratio)을 달리하여 판 변형인 Camber와 Curl의 경향성을 살펴보았다. 최종적으 로 롤러 레벨링의 최적 교정조건을 설정하는 모 델을 개발하여 실시간으로 현장에서 설정된 조건 을 볼 수 있도록 하였다.
1. Department of Mechanical Engineering, POSTECH
# Corresponding Author : Department of Mechanical Engineering, POSTECH, E-mail : [email protected]
Table 1 Process conditions of the accelerated cooling
Thickness 40mm SCT 737℃
Width 3030mm FCT Top 396℃
Length 20682mm FCT Bottom 377℃
Table 2 Process conditions of the accelerated cooling and the roller leveling
Thickness 40mm SCT 738℃
Width 3030mm FCT Top 501℃
Length 20682mm FCT Bottom 476℃
Roll diameter 360mm Roll pitch 390mm Number of the roll upper : 4, lower : 5
Entry intermesh 31.5mm Delivery intermesh 40.3mm
2. Camber 와 Curl 의 경향성 분석
2.1 소성률에 따른 Camber 변화
Part I에서 개발한 롤러 레벨링 잔류응력 예측 모델을 사용하기 위해 롤러 레벨링 전의 잔류응 력을 알아야 한다. 하지만 직접 측정할 방법이 없 어 기존에 개발된 가속냉각 잔류응력 예측 모델 을 사용하여 예측하였다[1~4].
가속냉각 잔류응력 예측 모델은 가속냉각 과정 에서 판의 초기 온도(SCT)와 최종 온도(FCT)의 위, 아래 분포를 이용하여 잔류응력을 예측하였다.
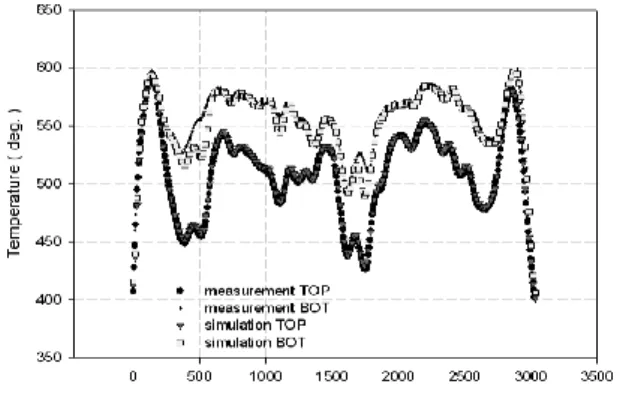
Table 1의 공정조건에서 Fig. 1은 폭방향으로 판의 최종 온도(FCT) 위, 아래 분포를 실험치와 예측치 를 비교한 것이다. 잘 일치함을 알 수 있고, 이로 써 롤러 레벨링 전의 잔류응력을 예측하고 이를 검증하기 위해 8개의 판으로 소절하여 각각의 소 절판에 대한 Camber를 실험치와 Fig. 2에서 비교 하였다. 역시 실험치와 예측치가 잘 일치하고, 롤러 레벨링 전의 잔류응력을 예측할 수 있게 되었다.
가속냉각 잔류응력 예측 모델과 롤러 레벨링 잔류응력 예측 모델을 통합하여 Table 2의 공정조 건으로 가속냉각 과정의 예측된 잔류응력을 롤러 레벨링 전의 잔류응력으로 사용하였다. 롤러 레벨 링 후 예측된 잔류응력으로 Camber를 계산하여 실험치와 예측치를 Fig. 3에서 비교해 본 결과 대 체적으로 잘 일치하였다. 소절판 6번과 7번에서 차이를 보였지만 제품의 불량을 판단하기 위해서 는 Camber 최대값의 절대치가 더욱 더 중요하다.
Fig. 1 Comparison between simulations and experiments of FCT distributions on the top and bottom after accelerated cooling
Fig. 2 Comparison between simulations and experiments of the camber after accelerated cooling
Fig. 3 Comparison between simulations and experiments of the camber after roller leveling
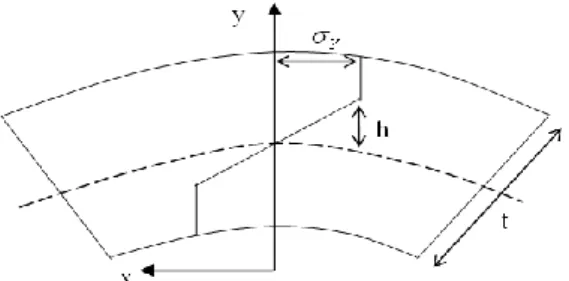
롤러 레벨링에서 압입량의 변화에 따라 잔류응
력과 Camber가 어떤 경향성을 보이는지 알아보기
위해 Fig. 4에서 보듯이 곡률에 의해 발생하는 소
성변형이 판의 두께에서 차지하는 비율인, 소성률
(plastic ratio)을 다음과 같이 정의한다.
Fig. 4 Relation of the plastic ratio and the curvature
2
t h
Plastic ratio t
(1)
여기서 t는 판의 전체 두께이고 h는 탄성영역의 두께이다.
압입량이 클수록 곡률이 커지므로 일반적으로 큰 압입량이 더 많은 소성률을 발생시킨다. 또한 같은 압입량에 대해 두께가 두꺼울수록 더 큰 소 성변형을 발생시키므로, 두께의 영향없이 잔류응 력의 감소효과를 알아보기 위해 소성률(plastic ratio)을 사용하였다.
Table 2의 공정조건에서 예측된 잔류응력을 롤러 레벨링 전의 잔류응력으로 사용하고, 롤러 레벨링 의 입측 인터메시(entry intermesh)가 소성률(plastic ratio) 30%, 50%, 70%, 90%인 네가지 경우에 대해 Fig. 5(a)에서 비교하였다. 소성률(plastic ratio)이 커 질수록 잔류응력의 감소효과가 커져서 각 소절판 의 Camber 절대치가 감소함을 알 수 있다. Fig 5(b) 는 소성률(plastic ratio)을 10%에서 90%까지 변화 시키며 최대 Camber를 비교하였는데 마찬가지로 소성률(plastic ratio)이 클수록 최대 Camber 절대치 가 감소함을 보여준다. 따라서 롤러 레벨링 공정 에서 소성률(plastic ratio)을 크게 할수록 Camber의 절대치를 최소화시킬 수 있다.
2.2 소성률에 따른 curl 변화
Camber와 마찬가지로 Table 2의 공정조건을 사 용하여, 롤러 레벨링 공정에서 압입량을 달리하 여 소성률(plastic ratio)에 따른 Curl 곡률의 변화를 살펴보았다[5].
이때 입측 인터메시(entry intermesh)뿐만 아니라 출측 인터메시(delivery intermesh)도 변화시켰다.
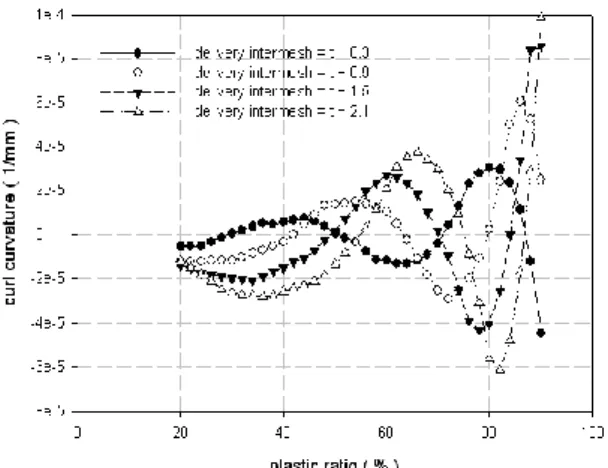
Curl 곡률이 클수록 Fig. 6에 정의한 Curl이 커지므 로, Fig. 7에 소성률(plastic ratio)에 따른 Curl 곡률의 변화를 나타내었다. Curl 곡률이 Camber와는 다르게
(a) Camber of the part
(b) Maximum camber
Fig. 5 Predicted camber according to the plastic ratio after roller leveling
(a) Positive curl
(b) Negative curl
Fig. 6 Shape of the curl deformation
Fig. 7 Change of the predicted curl curvature according to the plastic ratio and delivery intermesh
일정한 경향성을 보이지 않고 소성률에 따라 심 하게 변화하였다. 또한 같은 소성률(plastic ratio)이 라도 출측 인터메시(delivery intermesh)가 다르면 Curl 곡률도 다르게 나타났다. 따라서 Curl 곡률이 특정 소성률(plastic ratio)에서만 0이 됨을 알 수 있 고, 또한 출측 인터메시(delivery intermesh)의 변화 에 따라, Curl 곡률을 0으로 하는 소성률(plastic ratio)이 각각 다르게 존재한다.
3. 결과 및 고찰
3.1 최적화 모델 개발
앞에서 소성률(plastic ratio)에 따른 Camber와 Curl 곡률에 대해 살펴보았다. 소성률(plastic ratio) 이 클수록 Camber는 감소함을 알 수 있었다. 이는 Camber의 크기가 두께방향 평균 응력 분포의 폭 방향 모멘트(moment)의 크기에 좌우되는데, 소성 률(plastic ratio)이 클수록 두께방향 평 균 응력 감 소가 크서 Camber가 감소한다. Fig. 8에서 롤러 레 벨러의 위 4개, 아래 5개, 총 9개의 롤에 대해 맨 앞 롤부터 차례대로 번호를 매겨 각 롤에 걸리는 소성률(plastic ratio)을 나타내었는데 세번째 롤에서 가장 크며, 그 크기에 따라 두께방향 평균 응력 감소가 이루어진다.
Curl 곡률은 두께방향으로의 응력 편차에 의해 그 크기와 방향이 결정된다. 세번째 롤의 최대 소 성률(plastic ratio)에 따라 그 밖의 롤에 대해서도 소성률(plastic ratio)이 존재하는데, 마지막으로 소 성률(plastic ratio)이 존재한 롤이 윗롤인지, 아랫롤 인지와 세번째 롤을 지나 뒤에 있는 롤들의 소성
Fig. 8 Change of the plastic ratio at the roll according to the entry intermesh
Fig. 9 Change of the plastic ratio at the roll according to the delivery intermesh
률(plastic ratio) 크기에 따라 Curl 곡률의 방향과 크기가 달라진다. 또한 출측 인터메시(delivery intermesh)를 다르게 설정한 경우, 소성률(plastic ratio)에 따라 Curl 곡률의 방향이 양과 음을 반복 하는 경향은 유사하게 보인다. 하지만 같은 소성 률(plastic ratio)에 대해 Curl 곡률의 방향과 크기가 다름을 알 수 있다. 이는 Curl 곡률을 0으로 만들 어 주는 최적의 소성률(plastic ratio)이 다르다는 것 을 보여준다. Fig. 9에서 보듯이 세번째 롤에서의 최대 소성률(plastic ratio)이 같더라도, 출측 인터메 시(delivery intermesh)에 따라 그 밖의 롤에서 소성 률(plastic ratio)이 달라지게 되고, Curl 곡률 또한 그 크기와 방향이 정해진다.
출측 인터메시(delivery intermesh)를 변화시키며
Curl 곡률을 0으로 하는 최적의 소성률(plastic
ratio)이 가장 큰 출측 인터메시(delivery intermesh)
Fig.10 Relation of the curl curvature and curl deformation
를 찾고, 그 소성률(plastic ratio)을 가지는 입측 인 터메시(entry intermesh)를 사용하여 Camber와 Curl 곡률을 동시에 최소화시키는 최적화 모델을 개발 하였다. 이때 롤러 레벨러(roller leveler)의 최대 롤 하중(roll force)을 초과하지 않는 소성률(plastic ratio)을 찾아야 한다[6]. 또한 Curl 곡률만으로는 Fig. 6에서 정의한 Curl의 값을 알 수 없다. Fig. 10 에서 보듯이 Curl 곡률을 가지고 중력 효과를 고 려한 FEM(Finite element method) 해석을 통해, Curl 허용치를 만족하는 양과 음의 Curl 곡률값을 판의 길이와 두께에 따라 각각 구하여 최적화 모델에 사용하였다. 이는 FEM(Finite element method) 해석 은 시간이 오래 걸리는 단점이 있어 현장 적용에 어려움이 있기 때문이다.
3.2 최적화 모델 검증
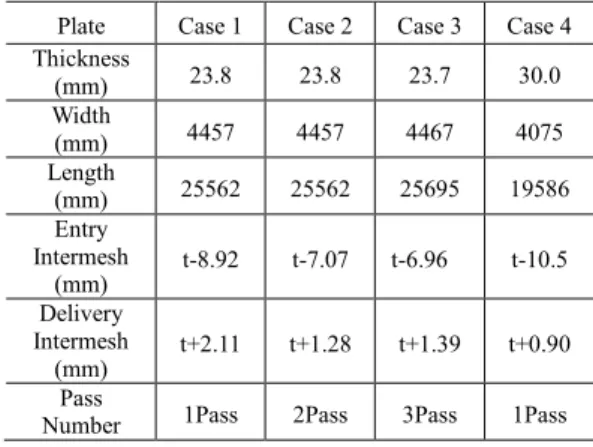
판 변형인 Camber와 Curl을 최소화시키는 최적 화 모델을 검증하기 위해, Tabel. 3의 4개의 판에 대해 최적화 모델을 이용하여 입측 인터메시(entry intermesh)와 출측 인터메시(delivery intermesh)를 구 하였다. 여기서 Case 2는 롤러 레벨링을 2회, Case 3은 3회 실행하였다. 현장에서 직접 롤러 레벨링 공정에 적용하여, 최종 판의 Curl 실험치와 모델 에서 계산된 Curl 곡률을 가지고 중력 효과를 고 려해 FEM(Finite element method) 해석을 통해 구해 진 예측치를 Table 4에서 비교하였다. 이때 실험치 는 판의 앞쪽에서 발생하는 Top curl, 뒤쪽에서 발 생하는 Tail curl을 측정하였고 모델에서 계산된 Curl은 판의 길이방향으로 일정하다고 가정하기 때문에 한 개만 예측되었다. 실험치와 예측치의 Curl을 비교하면 잘 일치하고, 2pass로 롤러 레벨 링을 한 Case2와 3pass로 한 Case3의 경우 모델은
Table 3 Process conditions of the roller leveling Plate Case 1 Case 2 Case 3 Case 4 Thickness
(mm) 23.8 23.8 23.7 30.0 Width
(mm) 4457 4457 4467 4075 Length
(mm) 25562 25562 25695 19586 Entry
Intermesh
(mm) t-8.92 t-7.07 t-6.96 t-10.5 Delivery
Intermesh
(mm) t+2.11 t+1.28 t+1.39 t+0.90 Pass
Number 1Pass 2Pass 3Pass 1Pass
Table 4 Comparison between simulations and experi- ments of the curl after roller leveling