FABP3 and FABP4 Genes Are the Potential Candidates for Body Weights in Korean Native Chicken
Muhammad Cahyadi
1,2, Dongwon Seo
1, Nuri Choi
1, Shil Jin
1, Dyah Maharani
3, Kang Nyeong Heo
4, Bo Seok Kang
4, Cheorun Jo
1and Jun Heon Lee
1,†1
Department of Animal Science and Biotechnology, Chungnam National University, Daejeon 305-764, Korea
2
Department of Animal Science, Faculty of Agriculture, Sebelas Maret University, Surakarta 57126, Indonesia
3
Faculty of Animal Science, Gadjah Mada University, Yogyakarta 55281, Indonesia
4
Poultry Science Division, National Institute of Animal Science, RDA, Cheonan 331-801, Korea.
ABSTRACT FABPs, 15 kDa organic substances, are small intracellular proteins which have a primary role to regulate fatty acid uptake and intracellular transport. This study was conducted to identify SNPs in the two FABP family genes and their associations with the body weight traits in Korean native chicken (KNC). Two SNPs, namely g.508C>T of FABP3 gene and g.285C>T of FABP4 gene, have been genotyped by using PCR-RFLP method. The results showed that FABP3 was significantly associated with body weight at birth, body weights at 12 to 20 weeks, and also slaughter weight. Moreover, the g.285C>T SNP of FABP4 gene was not associated with any body weight traits. These results suggested that the g.508C>T SNP of FABP3 genes can be used as molecular markers to select KNC having desirable body weights.
(Key words : body weight, FABP3, FABP4, Korea native chicken)
†
To whom correspondence should be addressed : [email protected]
INTRODUCTION
Recently, there are increasing reputations for the native livestock breeds to the consumers including chicken. People thought that native chicken meat has better taste and meat quality than that of commercial broilers. In Korea, native chicken is preferred by Korean consumers because Korean native chicken (KNC) has less fat and better protein content, even though its price is 2 to 3 times higher than that of commercial broilers (Sang et al., 2006; Hoque et al., 2011;
Seo et al., 2013). Therefore, improving both meat quality and quantity in Korean native chicken will be great challenge for poultry industry.
Few decades ago, selection of chicken was mainly based on the phenotypes. This phenotype-based selection method requires relatively long time for selection. In contrast, recent advances in molecular genetics can give some guidelines for decreasing generation intervals, which can ultimately increa- sing the selection intensity. Therefore, the identification and utilization of QTLs and functional candidate genes have been
becoming powerful tools for faster genetic improvement in selection program by marker assisted selection (MAS) (Dek- kers and Hospital, 2002).
Fatty acid-binding proteins (FABPs), members of the intra-
cellular lipid-binding protein (iLBP) family, are small intra-
cellular proteins that acts in fatty acid uptake regulation,
metabolism, and intracellular transport by binding intrace-
llular hydrophobic ligands and trafficking them throughout
cellular compartments, including the peroxisomes, nucleus,
mitochondria, and endoplasmic reticulum (Smathers and Pe-
tersen, 2011). FABP genes are known to be expressed in
various types of tissue, such as muscle, adipocyte, liver,
heart, brain, intestinal, testis, myelin and epidermal (Chmurz-
ynska, 2006). Until now, at least 11 types of FABP genes
have been investigated, and one of them, namely FABP11, is
specifically expressed in fish (Agulleiro et al., 2007). The
FABP3 gene was mainly expressed in muscle and heart. On
the other hand, FABP4 gene has been particularly expressed
in adipose tissues. In pigs, both FABP3 and FABP4 genes
were higher expressed in subcutaneous adipocyte tissue than
intramuscular adipocyte tissue during growing time (Gardan et al., 2007). In addition, expression of both FABP3 and FABP4 genes was also increased in longissimus dorsi (LD) tissue during growing. Particularly, level of FABP4 mRNA expression was positively correlated with intramuscular fat (IMF) content and body weight in pigs (Cho et al., 2011;
Chen et al., 2013). In the case of mice, level of FABP3 protein can significantly increase body weight and other me- tabolic traits which was suggested that expression of FABP3 was correlated with obesity and insulin resistance (Kusudo et al., 2011). Also, polymorphisms in both FABP3 and FABP4 genes were tightly linked with fat-related traits in chicken (Wang et al., 2006; Li et al., 2008; Wang et al., 2009; Ye et al., 2010). Furthermore, variations within FABP4 gene were associated with slaughter and meat quality traits, espe- cially living weight, carcass weight, breast muscle weight, abdominal fat weight, and abdominal fat percentage (You et al., 2009). Therefore, in this study, we investigated variations in FABP3 and FABP4 genes and their relationships with body weight traits in Korean native chicken.
MATERIALS AND METHODS
1. Chicken Population and DNA Isolation Two populations used in this experiment were consisted by 15 sires and 73 dams (F
0), and 590 F
1birds comprised by 110, 90, 125, 131, and 134 offspring from gray, black, white, yellow-brown, and red-brown lines of KNC, respectively.
The five lines of KNC were distinguished on the basis of feather colors (Hoque et al., 2012). These animals were reared under the standard breeding procedures in National Institute of Animal Sciences (NIAS), Korea. The data including body weight at birth (BBW), body weight at 2 to 20 weeks of age,
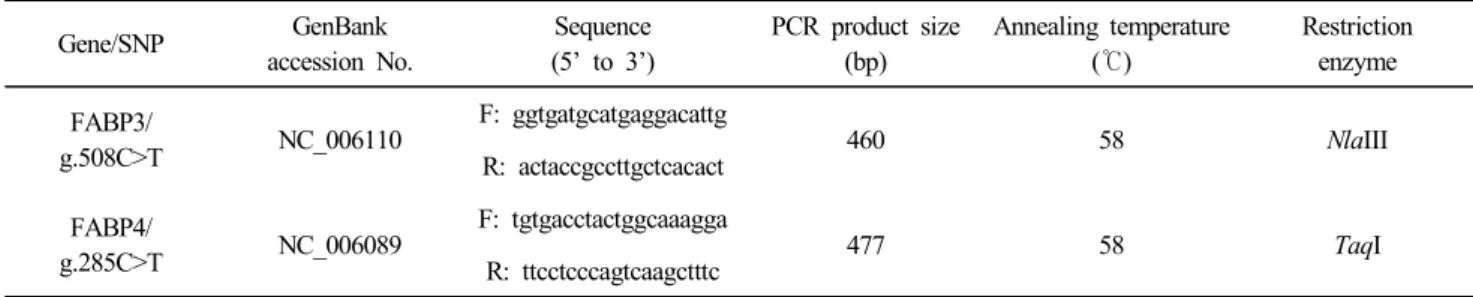
Table 1. Primers for PCR amplification and SNP identification in FABP3 and FABP4 genes
Gene/SNP GenBank
accession No.
Sequence (5’ to 3’)
PCR product size (bp)
Annealing temperature ( ℃)
Restriction enzyme FABP3/
g.508C>T NC_006110
F: ggtgatgcatgaggacattg
460 58 NlaIII
R: actaccgccttgctcacact FABP4/
g.285C>T NC_006089
F: tgtgacctactggcaaagga
477 58 TaqI
R: ttcctcccagtcaagctttc
and slaughter weight (SW) were recorded every two weeks.
In addition, their blood samples were collected from wing veins by using vacutainer tubes containing EDTA. These blood samples were used to extract DNA based on Miller et al. (1988) methods. The isolated DNA was maintained in refrigerator at 20℃ for further analysis.
2. PCR Condition and Genotyping
Two pairs of primers, one for FABP3 gene and another for FABP4 gene, were designed based on Maharani et al. (2011).
The primer and restriction enzyme information are shown in Table 1. Polymerase chain reaction was carried out in 20 μL volume containing 50 ng per μL DNA genome, primers, 10 mM dNTP, 10× reaction buffer, HS Taq Polymerase (Ge- netBio, Korea), and distilled water. The PCR conditions were as follows: 94℃ for 10 minutes for pre-denaturation, 35 cycles of 94℃ for 30 seconds, 58℃ for 30 seconds, and 72℃
for 30 seconds, and followed by 10 minutes of final exten- sion at 72℃. Reaction was performed using either GeneAmp PCR system 2700 (Applied Biosystems, USA) or C1000
TMThermal Cycler (BioRad, USA). The PCR products were visualized by 2% standard agarose gels stained with ethidium bromide (GenetBio, Korea). For genotyping, PCR restriction fragment length polymorphism (RFLP) was applied. Approxi- mately, 15 μL of PCR product was digested with 2 units of each restriction enzyme (Table 1) based on the protocol re- commended by company (Biolabs
®Inc., New England). After that, the digested PCR product was separated on 3% agarose gels to identify genotype variations.
3. Statistical Analysis
Genotype and allele frequencies were measured, and Pear-
son’s Chi-square test was applied to verify the Hardy-Wein-
berg equilibrium status. The effects of FABP genes variations on body weight traits were analyzed by using general linear model (GLM) procedure in the MINITAB version 14.0 soft- ware (Minitab Inc., USA). The following model was used for association analysis between the genotype and body weight:
Y
ijklmno= μ + G
i+ S
j+ B
k+ L
l+ F
m(l)+ M
n(lm)+ ɛ
ijklmnoWhere, Y
ijklmnois the phenotype of the o
thanimal, μ is population mean, G
iis the fixed effect of genotype, S
jis the fixed effect of sex, B
kis the fixed effect of batch, L
lis the fixed effect of line, F
m(l)is the random effect of the m
thsire nested within the l
thline, M
n(lm)is the random effect of the n
thdam nested within the l
thline and m
thsire, and ɛ
ijklmnois the residual error associated with the o
thanimal. In order to test the pairwise differences between the genotypes, Tukey’s test was also performed.
RESULTS
1. Genotype and Allele Frequencies
Three genotypes were identified in both FABP3 and FABP4 genes. In case of g.508C>T SNP in FABP3 gene, four DNA fragments, namely 201 bp, 176 bp, 72 bp and 11 bp, were found in animals having CC genotypes, whereas five DNA fragments, 201 bp, 140 bp, 72 bp, 36 bp and 11 bp, were found in animals having TT genotypes (Fig. 1A). On the other hand, the g.285C>T SNP in FABP4 gene was clearly
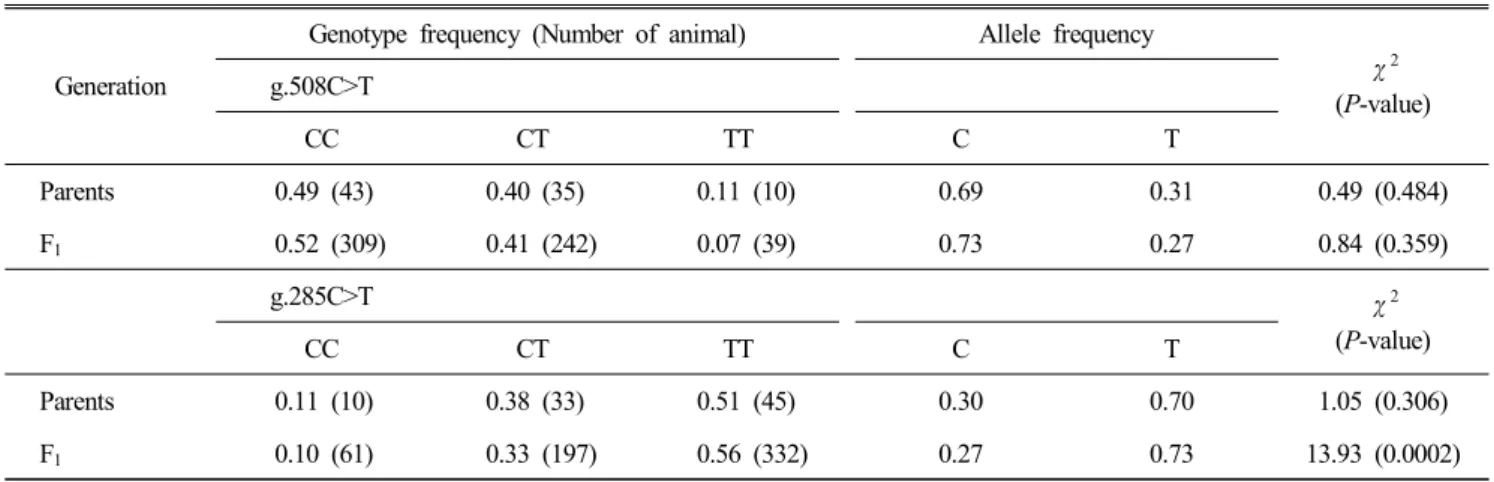
Table 2. Genotype and allele frequencies of g.508C>T SNP of FABP3 gene and g.285C>T SNP of FABP4 gene in Korean native chicken
Generation
Genotype frequency (Number of animal) Allele frequency
χ
2(P-value) g.508C>T
CC CT TT C T
Parents 0.49 (43) 0.40 (35) 0.11 (10) 0.69 0.31 0.49 (0.484)
F
10.52 (309) 0.41 (242) 0.07 (39) 0.73 0.27 0.84 (0.359)
g.285C>T χ
2(P-value)
CC CT TT C T
Parents 0.11 (10) 0.38 (33) 0.51 (45) 0.30 0.70 1.05 (0.306)
F
10.10 (61) 0.33 (197) 0.56 (332) 0.27 0.73 13.93 (0.0002)
(A)
(B)
Fig. 1. Genotypes of g.508C>T SNP of FABP3 gene (A) and g.285C>T SNP of FABP4 gene (B) visualized by 3%
agarose gel electrophoresis
distinguished using 3% agarose gels. The 477 bp of PCR
product was separated into 242 bp and 235 bp fragments for
animals having CC genotypes (Fig. 1B). It should be noted
that DNA fragments under 50 bp could not be identified in
agarose gel with bare eyes.
Either parent or F
1population was in Hardy-Weinberg equilibrium (HWE) for g.508C>T SNP. Different HWE status was identified for the g.285C>T SNP in FABP4 gene, where- as parent population was in HWE. On the other hand, F
1population was not in HWE (Table 2). It may be due to selective pressure for desirable phenotypic traits, and inbree- ding in Korean native chicken (Falconer and Mackay, 1996;
Heo et al., 2011).
2. Association of SNPs in FABP Genes with Body Weight Traits
Twelve body weight-related traits, including body weight at birth, body weights at 2 to 20 weeks of age, and slaughter weight, were used for association analysis. Both sex and line effects were tested in this study. The results showed that either sex or chicken line was affecting body weights in Korean native chicken. Body weights in red-brown and black lines were significantly higher than other lines in all ages. In addition, both dam and sire were strongly affecting body weight in KNC (data not shown).
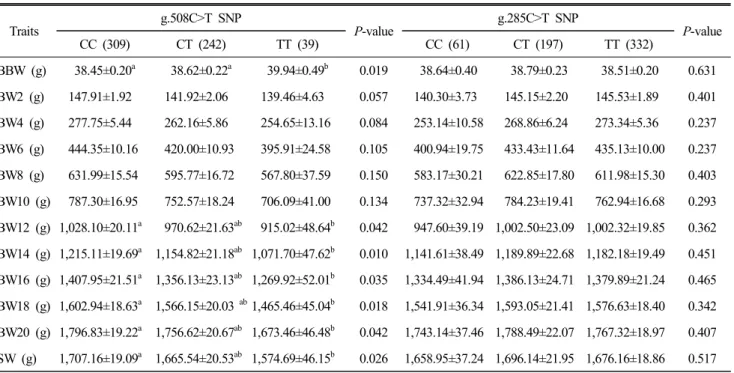
Table 3. Association between g.508C>T SNP of FABP3 gene and g.285C>T SNP of FABP4 gene with body weight traits in Korean native chicken
Traits
g.508C>T SNP
P-value
g.285C>T SNP
P-value
CC (309) CT (242) TT (39) CC (61) CT (197) TT (332)
BBW (g) 38.45±0.20
a38.62±0.22
a39.94±0.49
b0.019 38.64±0.40 38.79±0.23 38.51±0.20 0.631 BW2 (g) 147.91±1.92 141.92±2.06 139.46±4.63 0.057 140.30±3.73 145.15±2.20 145.53±1.89 0.401 BW4 (g) 277.75±5.44 262.16±5.86 254.65±13.16 0.084 253.14±10.58 268.86±6.24 273.34±5.36 0.237 BW6 (g) 444.35±10.16 420.00±10.93 395.91±24.58 0.105 400.94±19.75 433.43±11.64 435.13±10.00 0.237 BW8 (g) 631.99±15.54 595.77±16.72 567.80±37.59 0.150 583.17±30.21 622.85±17.80 611.98±15.30 0.403 BW10 (g) 787.30±16.95 752.57±18.24 706.09±41.00 0.134 737.32±32.94 784.23±19.41 762.94±16.68 0.293 BW12 (g) 1,028.10±20.11
a970.62±21.63
ab915.02±48.64
b0.042 947.60±39.19 1,002.50±23.09 1,002.32±19.85 0.362 BW14 (g) 1,215.11±19.69
a1,154.82±21.18
ab1,071.70±47.62
b0.010 1,141.61±38.49 1,189.89±22.68 1,182.18±19.49 0.451 BW16 (g) 1,407.95±21.51
a1,356.13±23.13
ab1,269.92±52.01
b0.035 1,334.49±41.94 1,386.13±24.71 1,379.89±21.24 0.465 BW18 (g) 1,602.94±18.63
a1,566.15±20.03
ab1,465.46±45.04
b0.018 1,541.91±36.34 1,593.05±21.41 1,576.63±18.40 0.342 BW20 (g) 1,796.83±19.22
a1,756.62±20.67
ab1,673.46±46.48
b0.042 1,743.14±37.46 1,788.49±22.07 1,767.32±18.97 0.407 SW (g) 1,707.16±19.09
a1,665.54±20.53
ab1,574.69±46.15
b0.026 1,658.95±37.24 1,696.14±21.95 1,676.16±18.86 0.517 Values in table represent Least Squares Mean (LSM) ± SE.
Abbreviation: BBW: birth body weight; BW2, BW4, BW6, BW8, BW10, BW12, BW14, BW16, BW18, BW20: body weight at 2 to 20 weeks of age; SW: slaughter weight.
a,ab,b