Area Extraction of License Plates Using an Artificial Neural Network
Hyun-Yul Kim*,Seung-Kyu Lee*,Geon-Wha Lee*.Young-rok Park*
ABSTRACT In the current study, the authors propose a method for extracting license plate regions by means of a neural network trained to output the plate's center of gravity. The method is shown to be effective. Since the learning pattern presentation positions are defined by random numbers, a different pattern is submitted to the neural network for learning each time, which enables it to form a neural network with high universality of coverage. The article discusses issues of the optimal learning surface for a license plate covered by the learning pattern, the effect of suppression learning of the number and pattern enlargement/reduction and of concentration value conversion. Results of evaluation tests based on pictures of 595 vehicles taken at an under-ground parking garage demonstrated detection rates of 98.5%, 98.7%, and 100%, respectively.
Key words : neural network,icense plate, optimal learning,learning pattern,pattern enlargement,under-ground parking
* Corresponding Author: Information and Communication Engineering Docter of Catholic Kwan-Dong University Received : November 05, 2014 Revised : November 20. 2014 Accepted : December 3. 2014
1. Introduction
Automobiles have become an indispensable part of today's life. However, security systems designed for super-vising those cars entering or existing are still not satisfactory and are often circumvented. Therefore, there is a need for fast monitoring of unauthorized cars entering and exiting public places, such as schools, hospitals, research organizations, administrative facilities, and so on. In addition, other issues relating to monitoring vehicles entering and exiting parking areas and expressway should be considered, such as reducing the number of tollbooth personnel, dealing with lost tickets, and reducing payment time, as well as issues of speed violation and car theft.
There are several components used for car discrimination: brand, color, and license plate, among which it is the license plate component that uniquely identifies the car and is also useful for retrieving owner information. For automatic recognition of the license plate character information, accurate detection of the plate position is of primary importance. Its result greatly affects the subsequent operations of obtaining the character-region cutout and recognizing the cutout characters.
The following methods for detecting the license plate position are known from the literature: those based on using half-transforms to obtain the linearity of the license plate contours (vertical lines and horizontal lines), and those based on tracing the perpendicular edges[1-7]. However, these methods are not
useful for recognition of images from photographs taken under dark conditions or if the license plate color is of the same color family as the car body.
In the current study, the authors discuss a method based on using features of the entire plate(plate likeness), rather than on simply obtaining the license plate contour lines. First, in section 2 we discuss the structure of the position-detection system; in section 3, we discuss the network model learning techniques and detection methods when a neural network is used to detect the license plate position.
Next, in section 4, we discuss the plate image database used in the position detection tests and, in section 5, the effectiveness of the proposed position detection system.
2. Structure of Position Detection System.
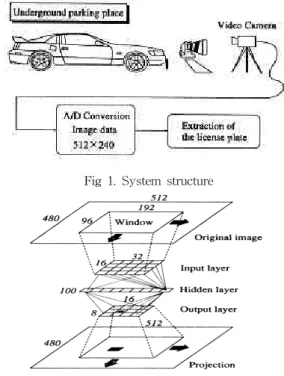
The license plate position detection system is comprised of an A/D converter, used to produce a 256 grey-level image from a videocamera, and a position detection unit, as shown in Fig. 1.
3. Method For Detecting Plate Position.
3.1. Network model
The neural network employed for detecting the position of the center of gravity the plate uses the back propagation method for three-layer hierarchical learning [8-10]. To set the unit threshold function, we use the following sigmoid function:
exp
(1)
The network model is illustrated in Fig. 2.
The number of structure units for each layer is as follow:
Fig 1. System structure
Fig 2. Neural network model
Input layer : 512 (32x16) Hidden layer : 100 Output layer : 128 (16x8)
3.2. Learning patterns and teaching signals
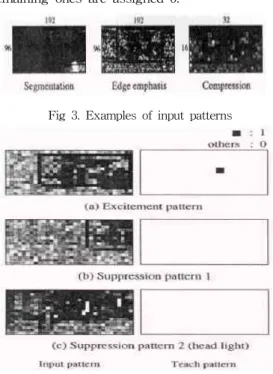
First, we shall discuss the method for generating learning patterns. Upon applying edge enhancement processing based on the 3x3 Sobel operator to a small 192x96 region cut from the input image, a pattern is generated by compressing the result down to 32x16(see Fig. 3). By smoothing the data, the "license
plate likeness" information is generated. Then, the cutout point (coordinates of the upper left point of a small region) is set according to a random number.
Learning patterns were taken from the excitation and suppression patterns as illustrated in Fig. 4. An excitation pattern is considered to be one such that % or more of the license plate area is within the cutout region(see Fig. 4a). Suppression pattern 1 is a pattern such that not more than 25-% of the plate area is within the cutout region, and suppression pattern 2 is the headlight section, which is similar to the license plate in shape(see Fig. 4b,c). Regarding the teaching signals relating to the excitation patterns, the unit corresponding to the center of gravity of the plate coordinates (obtained visually in advance) is assigned a value of 1, and the remaining ones are assigned 0.
Fig 3. Examples of input patterns
Fig 4. Examples of learning patterns
We will discuss the following two methods for presenting learning pattern: presentation of only excitation patterns to the neural network, and mixed presentation with inclusion of suppression patterns. The number of runs for a complete learning was set to 30,000.
3.3. Method of plate-surface-area computation
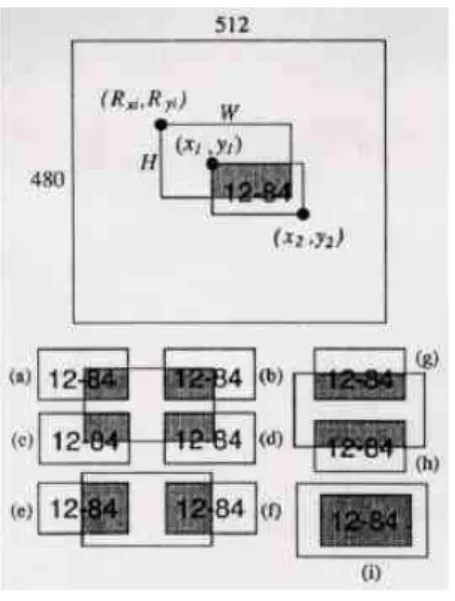
The neural network's performance and ease of learning vary depending on the percentage of the license plate area covered by the learning patterns. If the cutout window width is denoted by and its height by , the cutout window area is obtained as below, in accordance with Fig. 5.
(2)
Next, the license-plate area is obtained from the following formula, where( ) designates the coordinates of the upper-left cornet of the plate, and () designates the coordinates of its lower-right corner.
(3)
The license-plate area included in the cutout image is defined by the following formula:
Fig 5. Method of surfave-area caculation
∩ (4)
In particular, if () are upper-left coordinates of the cutout window, computation is performed using the following formulas.
They are broken down into cases (a)-(i), depending on the position relationship between the cutout window and the license plate.
(5)
Therefore, the percentage of the area with respect to is obtained as below.
× (6)
3.4. Learning error curves
We will discuss errors that occur during neural network learning. Here, the cutout patterns used for teaching the neural network cover 60% or more of the license plate area.
The learning errors encountered during the learning runs are defined as follows.
(7)
N: number of input images used for learning (here, N=20)
: output signal of the neural network for the learning pattern
: teaching signal for the learning pattern
Figure 6 illustrates the learning-error curves. If the sigmoid function slope is set to 1.0, it results in a divergent learning error curve, but at 2.0 the learning error curve goes down after some vibration fluctuation. This may be attributed to the fact that the cutout position of the learning patterns was defined based on random numbers. Since a different learning pattern is presented each time, it is recommended to use sharp neural responses.
3.5. Learning effect of the center of gravity
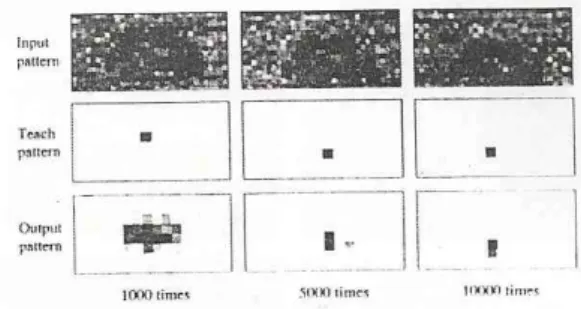
We shall discuss the process of learning position of the license plate's center of gravity by the neural network. Figure 7 illustrates the teaching signals used during the learning of
the center of gravity position, and the output results of each learning run versus the input signals. The sigmoid function's slope was set 2.0. For the 1000-run learning, the output signal does not settle to one specific point.
However, it can be seen that as the learning proceeds to 5,000 and 10,000 runs, the output signal accuracy improves.
Fig 6. Learning error curves.
Fig 7. Learning of the central position and the corresponding detection capability
3.5. Improvement of detection accuracy by Gaussian window
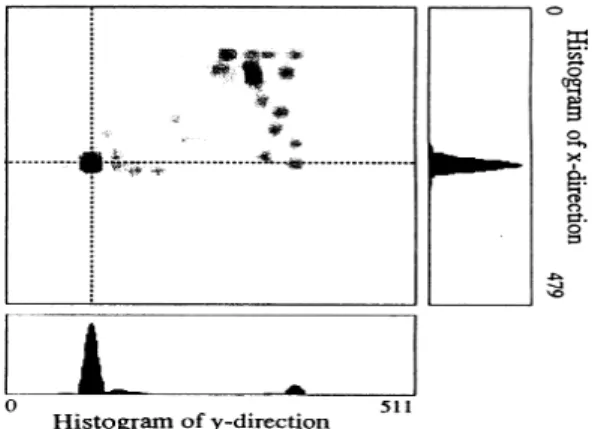
In those cases when the neural network's output values are projected into the 512x480 size, the projection points exhibit a discrete distribution. Therefore, it is often the case that the projection sum increases even though it is
not the center of gravity position. Thus, an approximately continuous distribution is generated by the projection summing procedure using a two-dimensional Gaussian window
applied to the output values according to the formula below. This results in improved detection accuracy:
:Two-dimensional Gaussian window distribution
1: Size of the Gaussian window 3.7. Detection method
The position of the center of gravity of the license plate is detected by the following procedure.
1) Using the same method as that for pattern generation described in section 3.2, a pattern is cutout, compressed, and input to the neural network. Then the output value is calculated.
2) The 16x8 output values are projected and enlarged to 192x96 and summing is performed by applying the Gaussian window.
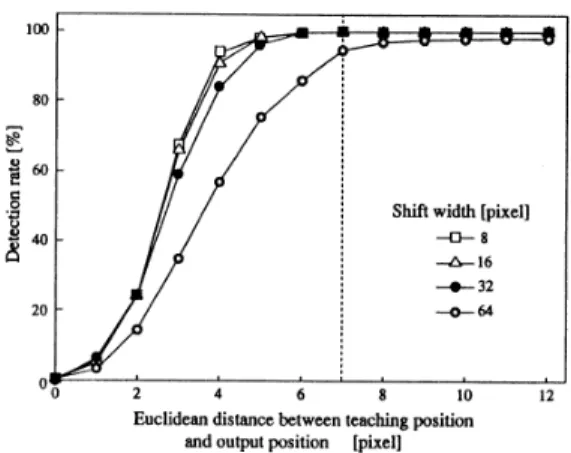
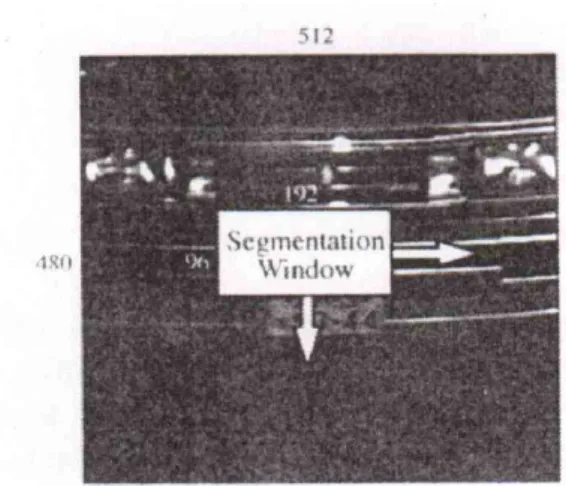
3) As illustrated in Fig. 8, the cutout window is scanned in both the and directions, using a randomly set shift width.
We used the shift widths 8,16,32 and 64 pixels.
4) All input images are retrieved by repeating steps (1)-(3).
5) The position of the largest output value among the summed projection values is considered the license plate's center of gravity.
Fig 9. Examples of input images Fig. 8. Scanning of the cutout window
3.8. Evaluation standard
If the gravity center position obtained from a previous observation is defined as (), and the position which was automatically detected by the neural network is (), then their Euclidean distance can be obtained from the following formula:
(9)
Detection is considered successful is ≤
pixels. The use of not exceeding 12 is based on reduction to 1/12 of the input image size in the output layer of the neural network.
4. Image Data.
The images used in the evaluation tests were taken by a CCD camera and were full images of cars temporarily parked in underground parking garages, in order to imitate a real environment.
The video images were quantized to obtain 512x240 pixels with 256 B/W gradations, with
every horizontal line repeated in order to obtain a 512x480 image with an aspect ratio of 1:1. The input image sequence is shown in Fig. 9.
Images obtained from 595 vehicles were organized into a database; 22% of all the images in the database were of license plates with green backgrounds.
Since the picture-shooting distance varied depending on the car position, not all license plates were of the same plates were of the same size. The license plate width distribution for the 595 cars is shown Fig . 10. For 13 cars, the difference with respect to the mean value of 122 pixel was within 20 pixels.
Generally speaking, using a large number of learning data allows the building of a neural network with highly universal coverage, but it is preferred that learning be completed with as small a data volume as possible. The neural network used in the current study "learned" a 20-car data set selected by random sampling from the 595 car data. In addition to, a 6-car data set collected by taking pictures outdoors
during the daytime was used for experimenting with additional learning patterns obtained by enlargement and reduction, as will be explained in section 5.4.
Fig 10. Width distributopn of license plates.
5. Evaluation Results
5.1. Discussion of optimal learning area With a small plate area covered by the learning pattern, it is difficult to make the neural network learn the exact position of the center of gravity. This is one factor that include the patterns covering a small license plate area in the excitation learning. The shift width of the cutout window was set to 32 pixels for both and directions. Figure 11 shows examples of successful detection for the cases in which cutout patterns covering 60%
or more of the license plate area were used for learning(see formula 9). Figure 12 shows the projection summing examples. The size of the circle indicates the response were concentrated in the vicinity of the license plate center, with erroneous detection appearing both in the license plate periphery and the head-light section.
Figure 13 shows the results of position detection. The best detection rate [97.5%(580/595)]
was obtained when 60% of the license plate was
covered. Hereafter, we shall consider this value as the optimum learning area( ).
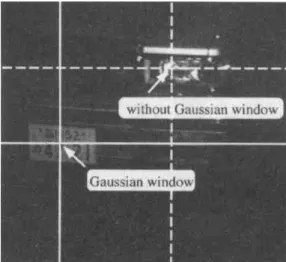
5.2. Effect of Gaussian window
We now discuss how applying a square Gaussian window to the output values affects the detection rate when projection summing is performed. We conducted tests with the window size varying from 16 to 28 pixels. To obtain more definitive results, we had to set the shift width of the cutout window to 64 pixels in both the and directions. Figure 14 demonstrates the effect of the Gaussian window. The maximum output value has shifted from the headlight toward the license plate's center of gravity. The corresponding projection sums are shown in Figs. 15 and 16, and the detection results in Fig. 17. Compared to the case without the Gaussian window, the detection rate increased from 87.1% (518/595) to 93.3% (555/595). The Gaussian window size of 22 pixels was the most suitable, and this value was used in subsequent tests.
Fig 11. Successful detection examples
Fig 12. Prohection sunming examples.
Fig 15. Example of projection sum without Gaussian window.
5.3. Suppression learning
The tests for obtaining the plate's optimal learning area demonstrated that numerous detection errors were encountered in the license plate peripheral section and the headlight section. Therefore, the learning was organized so as to suppress output while learning in these areas. Figure 18 shows the detection results obtained after suppression learning. The detection rate with a shift width of 32 pixels was 98.7% (587/595) and was almost the same for different cars. However, with a shift width of 64 pixels, the detection rate with only the plate periphery section suppressed increased from 93.3% (555/595) to 95.3%(567/595). By also suppressing the headlight section, a detection rate of 96.5%
(574/595) was obtained.
Figure 19 demonstrates the projection sum results obtained after suppression learning. It is evident that the output error rate of the neural network in the plate peripheral section and head light section was reduced compared to that of Fig. 12.
Fig 13. Optimal Learning area.
Fig 14. Effect of Gaussian window.
5.4. Additional learning patterns due to enlargement and reduction
Figure 20 shows the results of center detection performed upon enlargement/reduction of the 20 car images used for learning in order to obtain a artificially increased number of learning patterns. For a shift width of 32 pixels, the detection rate was increased to 99.3%(591/595), but erroneous detection was
encountered in the cases with very dark plate section and when these were complex shapes in the license plate's periphery.
Fig 16. Example of projection sum using the Gaussian window.
To compensate for these drawbacks, we added new learning data taken from another database consisting of three cars with complex shapes on the plate periphery and a three cars with of 64 pixels. the detection rate was 98.3%(585/595), and for 32 pixels or less it was 100.0% (595/595)(see Fig.21). The time required to complete plate extraction for one car was 1 s with a shift width of 32 pixels on an Alpha AXP/300 and 0.3s with a shift width of 64 pixels.
Fig 17. The size of Gaussian window and detection rate.
Fig 18. Effect of suppression learning
Fig 19. Example of projection aum after suppression learning
Fig 20. Effect of increased number of learning patterns.
Fig 21. Effect of shift width.
6. Conclusions
In this study, the authors propose a method for detecting the position of vehicle license plates by using a neural network and demonstrate its effectiveness. Considering that the learning pattern presentation positions are defined by random numbers, teaching of the same data to the neural network was, basically, excluded.
First, we discuss the issue of the plate's optimal learning area covered by the cutout window and examine the effect of applying a Gaussian window when performing projection summing of out put values. When 60% or more of the plate area was covered by the learning pattern, the detection rate was 97.5%
for 595 cars, with a shift width of 32 pixels.
In addition to, a Gaussian window was used to further improve the detection rate by transforming the neural network's discrete distribution of out values into a state close to a continuous distribution.
Next, we discuss the suppression learning results. Suppressing the output values in the license plate periphery section and headlight
section improved the detection rate to 98.7%.
In addition to, subjecting the input images to reduction and enlargement conversion and using more learning patterns resulted in a detection rate of 99.3%. These results demonstrate that artificially increasing the number of learning patterns improves the coverage universality of the neural network.
Finally, data for 6 additional cars was added to the 595 car database of the existing patterns, yielding a 100.0% detection rate.
It is shown tat the described technique allowed accurate detection of the license plate position, even in those usually difficult cases when the license plate and the car body are of the same color group.
References
[1] H. Takahashi, E. Maeda, A. Shio, and K.
Ishii. Image recognition techniques for automation of parking garage supervision.
NTT R&D, 41, No. 4, pp.4930500,1992.
[2] Y. Handa et al. Development and applications of fast image processing devices. Mitsuvisshi Heavy Industries Review, 27, No. 1, pp. 76-80,1993.
[3] M. Deguchi, K. Kato, G. Miya, And M.
Hinenoya. Development of a number plate reading device for computing the travel time. Sumitomo Elctrical Indstries, No. 139, pp. 8-13,1994.
[4] H. Kato et al. Nunber plate recognition techniques. Mitsuvishi Electric Industries Review, 62, No. 2, pp.8-12,2000.
[5] T. Sai, T. Agui, and M. Nakajima. Nunber Plate region extraction method using adaptive parameter Flat area-restricted half conversion. I.E.I.C.E.(D-Ⅱ), 72, NO. 4,
99.597-604,2003.
[6] H. Onoue and M. Shiono. Character recognition tests for entire numver plate including Japanese character section. Trans.
I.E.I.C.E., PRU92-47(1992).
[7] T. Mishima et al. stuby of car number recognition devices for image proceddion.
Trans. I.E.I.C.E., PRU86-94,2005.
[8] K. Imai, K. Gohara, and Y. Uchigawa.
Recognition of laterally written character lines using a 3-layered model. Trans.
I.E.I.C.E., PRU91-3 2008.
[9] J. Nishimura and N. Koyama. Learning capability vs input pattern resolution in back prapagation method. Trans. Inst. Proc.
Eng. Jpn., 35, No. 11, pp. 2331-2337,2009.
[10] D.E. Rumdlhart and J.L. McClelland.
Parallel Distributed processing, The MIT Press, Vol. 11,2010.
Author Biography
Hyun - Yul Kim [ Member ]
2006 : Catholic Kwandong University, Industrial Education Master of Engineering, MS 2011 - current : Catholic
Kwandong University, Information and Communication Technology, The doctor´s course
<Research Interests> Image Processing, Signal Processing System
Seung-Kyu Lee [ Life member ]
2002 : KEDI, Department of Mechanical Engineering, BS 2012 : Joongbu University,
Graduate School of Humanoroes Industry, MS
2012 - current : Catholic Kwandong University, Information and Communication Technology, The doctor´s course
<Research Interests>
Image Processing, Signal processing system, Video Compression
Geon-Wha Lee [ Member ]
2011 : Joongbu University, Car Management, MS
2013 - current : Catholic Kwandong University, Information and Communication Technology, The doctor´s course
<Research Interests>Automotive electronic control, Communications Systems
Young-rok Park [ Member ]
Current : Car Management of Professor
2013 - current : Catholic Kwandong University, Information and Communication Technology, The doctor´s course
<Research Interests>
Automotive electronic control, Communication system, Image Processing, Signal Processing
![Figure 13 shows the results of position detection. The best detection rate [97.5%(580/595)]](https://thumb-ap.123doks.com/thumbv2/123dokinfo/5317669.385244/7.892.463.749.683.963/figure-shows-results-position-detection-best-detection-rate.webp)