https://doi.org/10.14191/Atmos.2018.28.2.113 pISSN 1598-3560 eISSN 2288-3266
인버스 모델링을 이용한 지표면 이산화탄소 플럭스 추정 향상을 위한 항공기 관측 이산화탄소 자료동화 체계 개발
김현정 · 김현미* · 조민광 · 박준 · 김대휘 연세대학교 대기과학과, 대기예측성 및 자료동화 연구실
( 접수일: 2018년 1월 11일, 수정일: 2018년 3월 19일, 게재확정일: 2018년 4월 11일)
Development of the Aircraft CO 2 Measurement Data Assimilation System to Improve the Estimation of Surface CO 2 Fluxes Using
an Inverse Modeling System
Hyunjung Kim, Hyun Mee Kim*, Minkwang Cho, Jun Park, and Dae-Hui Kim Atmospheric Predictability and Data Assimilation Laboratory, Department of Atmospheric Sciences,
Yonsei University, Seoul, Korea
(Manuscript received 11 January 2018; revised 19 March 2018; accepted 11 April 2018)
Abstract In order to monitor greenhouse gases including CO2, various types of surface-, air- craft-, and satellite-based measurement projects have been conducted. These data help under- stand the variations of greenhouse gases and are used in atmospheric inverse modeling systems to simulate surface fluxes for greenhouse gases. CarbonTracker is a system for estimating sur- face CO2 flux, using an atmospheric inverse modeling method, based on only surface observa- tion data. Because of the insufficient surface observation data available for accurate estimation of the surface CO2 flux, additional observations would be required. In this study, a system that assimilates aircraft CO2 measurement data in CarbonTracker (CT2013B) is developed, and the estimated results from this data assimilation system are evaluated. The aircraft CO2 measure- ment data used are obtained from the Comprehensive Observation Network for Trace gases by the Airliner (CONTRAIL) project. The developed system includes the preprocessor of the raw observation data, the observation operator, and the ensemble Kalman filter (EnKF) data assimi- lation process. After preprocessing the raw data, the modeled value corresponding spatially and temporally to each observation is calculated using the observation operator. These modeled val- ues and observations are then averaged in space and time, and used in the EnKF data assimila- tion process. The modeled values are much closer to the observations and show smaller biases and root-mean-square errors, after the assimilation of the aircraft CO2 measurement data. This system could also be used to assimilate other aircraft CO2 measurement data in CarbonTracker.
Key words: CarbonTracker, aircraft CO2 measurement, CONTRAIL, observation operator, surface CO2 flux
*Corresponding Author: Hyun Mee Kim, Department of Atmospheric Sciences, Yonsei University, 50 Yonsei-ro, Seodaemun-gu, Seoul 03722, Korea.
Phone: +82-2-2123-5683, Fax:+82-2-365-5163 E-mail: [email protected]
변화에 있어 중요한 역할을 하므로 다양한 종류의 관 측을 통해 대기 중 이산화탄소 농도를 감시하려는 노 력이 지속되고 있다. 타워 기반의 지상 관측을 비롯해 Atmospheric Infrared Sounder (AIRS) (Aumann et al., 2003), Infrared Atmospheric Sounding Interferometer (IASI) (Crevoisier et al., 2009), Greenhouse gases Observing Satellite (GOSAT) (Yokota et al., 2009)과 같 은 위성 관측, Civil Aircraft for the Regular Investigation of the atmosphere Based on an Instrument Container (CARIBIC) (Brenninkmeijer et al., 2007), Comprehensive Observation Network for Trace gases by Airliner (CONTRAIL) (Machida et al., 2008; Matsueda et al., 2008)과 같은 항공 관측 프로젝트를 통해 관측이 수 행되고 있다.
대기 중 이산화탄소 분포에 대한 이해를 위해, 지 표면 탄소 플럭스를 추정하는 대기 인버스 모델링 (atmospheric inverse modeling) 방법 또한 널리 이용 되고 있다(e.g., Gurney et al., 2002; Feng et al., 2009;
Chevallier et al., 2010). 대기 인버스 모델링 방법은 대기 중 이산화탄소 농도 관측 자료로부터 지표면 탄 소 플럭스를 역으로 추정하는 방법을 말한다. 본 연 구에서 사용한 시스템인 탄소추적시스템(CarbonTracker) 은 앙상블 칼만 필터(ensemble Kalman filter, EnKF) 자료동화 방법(Evensen, 1994; Whitaker and Hamill, 2002)을 기반으로 한 대기 인버스 모델링 시스템으로, 미국 해양대기청(National Oceanic and Atmospheric Administration, NOAA) 산하 지구시스템연구소(Earth System Research Laboratory, ESRL)에서 처음 개발되 었다(Peters et al., 2007). 탄소추적시스템으로부터 산 출된 대기 중 이산화탄소 농도 결과는 다른 관측 자 료와의 비교를 통해 검증된 바 있다(e.g., Kim et al., 2016; Kulawik et al., 2016; Kim et al., 2017b). 하지 만, 탄소추적시스템을 비롯한 대기 인버스 모델링 방 법의 단점으로, 인버스 모델링의 방법론에 따라 사용
2018), 이러한 단점을 보완하고 모델 결과를 개선하기 위해 추가 관측 자료를 동화할 수 있는 기술 개발이 필수적이다.
CONTRAIL 프로젝트로부터 얻어진 이산화탄소 관 측 자료는 신뢰도가 매우 높기 때문에 모델 결과나 위성 자료를 검증하기 위해 널리 사용되어 왔다(e.g., Kulawik et al., 2010; Feng et al., 2011; Houweling et al., 2015; Kim et al., 2016). Zhang et al. (2014)에서 는 CarbonTracker Data Assimilation Shell (CTDAS)이 라는 시스템에 CONTRAIL 자료를 동화시킴으로써 아 시아 지역의 지표면 탄소 플럭스가 더 잘 묘사됨을 보인 바 있다. 또한 synthesis inversion 방법을 이용하 여 CONTRAIL 자료동화가 관측이 부족한 열대 지역 에 대해서도 효과가 있음을 보인 Niwa et al. (2012) 의 연구와 중국에서 효과적임을 보인 Jiang et al. (2014) 의 연구가 있다. 따라서 CONTRAIL 자료가 기존의 지표 관측 자료를 보완해 지표면 탄소 플럭스 추정 결과 개선에 기여할 것이라 기대할 수 있다. 하지만 위에서 언급된 선행 연구들에서는 NOAA에서 개발한 탄소추적시스템에 CONTRAIL 관측 자료를 동화한 것 은 아니다. 현재 NOAA에서 개발한 탄소추적시스템 을 국립기상과학원에서 현업으로 활용하고 있고 이 시스템에는 지표 관측 자료만 동화되고 있으므로, NOAA에서 개발한 탄소추적시스템에 CONTRAIL 자 료를 동화할 수 있는 시스템을 개발하면 지표면 탄소 플럭스를 좀 더 정확히 추정하는데 기여할 것으로 기 대된다.
본 연구에서는 항공 관측으로 얻어진 이산화탄소 관측 자료를 탄소추적시스템에 동화하는 체계를 개발 하였다. 구체적으로는 Japan Airlines (JAL) 여객기와 함께 수행된 CONTRAIL 프로젝트에서 관측된 이산 화탄소 몰농도 자료를 탄소추적시스템인 CarbonTracker 2013B (CT2013B) 버전에 동화하는 이산화탄소 항공 관측 자료동화 시스템을 최초로 개발하였다. CT2013B
에 CONTRAIL 자료를 동화할 수 있는 시스템을 개 발함으로써 지표면 탄소 플럭스를 보다 정확하게 추 정하는데 기여할 뿐만 아니라 추후 다른 항공 프로젝 트로부터 얻어진 관측 자료를 탄소추적시스템에 동화 할 수 있는 기반이 될 것으로 기대된다. 2장에서는 CONTRAIL 자료 및 개발된 자료동화 시스템에 대해 설명하고, 3장에서는 개발된 시스템으로부터 얻어진 결과를 제시할 것이다. 마지막으로 결론 및 요약을 4 장에 제시한다.
2. 탄소추적시스템 항공 관측 자료동화 체계 개발
2.1 항공 관측 자료 전처리
본 연구에서 사용한 항공 관측 자료는 CONTRAIL 프로젝트로부터 관측된 이산화탄소 몰농도 자료이다.
CONTRAIL 프로젝트는 메탄, 이산화탄소 등의 온실 기체 관측을 목적으로 2005년 11월에 시작되었으 며, JAL 여객기에 연속적인 이산화탄소 측정 장비 (Continuous CO2 Measuring Equipment, CME)를 탑재 해 비행 경로를 따라 이산화탄소를 측정한다(Machida et al., 2008). CONTRAIL 프로젝트에서 관측된 자료의 분포를 Fig. 1에 나타냈다. 측정된 이산화탄소 자료의 정확도는 ± 0.2 ppm 이내이다(Machida et al., 2008).
모든 이산화탄소 자료는 250~530 ppm 범위 내 10개 의 일차 표준 기체(primary standard gases)를 기반으로 한 National Institute for Environmental Studies (NIES) 09 스케일로 보정되었으며, NIES 09 스케일은 380~
400 ppm 범위에서 세계기상기구(World Meteorological Organization, WMO) 기준과 거의 일치한다(Machida et al., 2011).
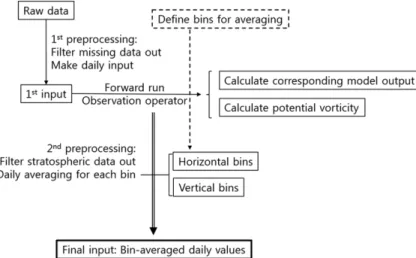
원시 미가공 관측 자료(raw data)는 몇 단계의 전처 리 과정(preprocessing)을 거쳐 자료동화에 사용할 수 있는 입력 자료로 만들어진다(Fig. 2). 먼저 결측값 (missing data)을 제거하고 모델 입력 자료로 사용할 수 있도록 Network Common Data Form (netCDF) 형 식의 일 자료로 변환한다. 이렇게 만들어진 첫 번째 입력 자료를 이용해 전진 실험(forward run)을 수행한 다. 여기서 전진 실험은 탄소추적시스템에 사용되는 수송 모델인 Transport Model 5 (TM5) 내에서 잠재 소용돌이도(potential vorticity)를 계산하기 위해 수행 된다. 각 관측 자료 위치에 대해 잠재 소용돌이도를 계산해 그 값이 2 PVU (Potential Vorticity Unit, 1 PVU = 10−6m2 s−1 K kg−1) 이상이면 Sawa et al. (2008)을 따 라 성층권 자료로 분류하였다. 성층권 이산화탄소 농 도는 대류권에 비해 계절 변동에 위상 변이(phase shift) 가 존재할 뿐만 아니라 그 진폭 또한 작다(Sawa et al., 2008; Niwa et al., 2012). 또한 높은 고도에서 모 델 해상도가 낮기 때문에 성층권 자료를 제외한 대류 권 자료만 자료동화에 사용하였다.
전진 실험을 통해 계산된 잠재 소용돌이도를 기준 으로 성층권 자료를 거르고 나면 시공간 평균을 통해 최종 입력 자료를 생산한다. CONTRAIL 자료는 비행 중 관측인 비행 모드(level mode)와 공항에서 이·착륙 시 관측된 이·착륙 모드(ascending and descending mode 또는 vertical mode)로 나누어지는데, 비행 중에
Fig. 1. Distribution of the aircraft CO
2measurement data from the CONTRAIL project (gray) and the locations of the airports
where CO
2measurements were conducted (blue star). The boxes are bins used for averaging: horizontal bins for the
observations of level mode are represented by the black box and vertical bins for the observations of vertical mode are
represented by the red box.
는 1분 간격으로, 이·착륙 중에는 10초 간격으로 이산 화탄소를 측정하기 때문에 시공간 평균이 필요하다.
본 연구에서는 Niwa et al. (2012)를 따라, 비행 모드 에 대해서는 수평으로 33개의 구간(bin) (225~275 hPa) 을 정의하였다(Fig. 1). 또한, 이·착륙 모드 11개 수평 구간에 대해서는 연직 4층(575~625, 475~525, 375~
425, 225~275 hPa)으로 확장하여, 총 44개의 구간으로 정의하였다. 비행 모드에 대한 수평 구간의 위경도 범 위는 약 8o~22o이며 평균적으로는 약 12o이다. 이·착 륙 모드에 대한 수평 구간의 위경도 범위는 약 4o~10o 이며 평균적으로는 약 7o이다. 따라서 비행 모드와 이
·착륙 모드를 합쳐 총 77개의 구간에 대해, 시간적으 로는 일 평균한 값을 자료동화에 사용하였다. 625 hPa 미만의 관측 자료는 경계층 내 낮은 고도에서 공항 근처의 오염된 공기에 의해 국지적인 영향을 받을 가 능성이 있기 때문에 자료동화에 사용하지 않았다.
2.2 관측연산자와 자료동화 체계 개발
탄소추적시스템에서는 앙상블 제곱근 칼만 필터 (ensemble square root filter, EnSRF; Whitaker and Hamill, 2002) 방법을 통해 관측 자료를 동화한다. 탄 소추적시스템의 자료동화 체계에 대한 자세한 설명은 선행 연구(e.g., Peters et al., 2005; Kim et al., 2012) 에 있기 때문에, 본 연구에서는 간략한 설명만 제시 한다. EnSRF 방법에서는 기본적으로 분석 값(analysis) 을 구할 때, 다음 식 (1), (2)와 같이 상태 벡터 x의 평균( )과 앙상블 섭동(x')을 따로 업데이트한다. 탄소 추적시스템에서 상태 벡터 x는 scaling factor로서 지 표면 플럭스를 간접적으로 추정하는데 사용되며, 이 에 대한 자세한 설명은 Kim et al. (2012)를 참고하기 바란다.
(1) (2) 여기서 첨자 t는 해당 시간을, a는 분석 값, b는 배경 값(background)을 의미하며 K는 평균 값 업데이트를 위한 칼만 게인 행렬(Kalman gain matrix), 는 앙상 블 섭동 업데이트에 사용되는 감소된 칼만 게인 행렬 (reduced Kalman gain matrix)이다. yo는 관측 값 벡터 이며 H는 관측 연산자(observation operator)이다. 위 의 식에서 알 수 있듯이 자료동화란 관측과 모델 값 의 차이를 모델 값에 다시 반영해 줌으로써 모델 결 과를 업데이트하는 과정이기 때문에, 자료동화에 앞 서 항공 관측 자료에 대한 관측 연산자 개발이 필요 하다. 관측 연산자는 모델 값과 관측의 비교를 위해 모델 공간에서 관측 공간으로 사상(mapping)하는 역 할을 한다. 탄소추적시스템에서는 TM5 수송 모델이 관측 연산자 역할을 하며, 지표면 탄소 플럭스로부터 이산화탄소 몰 농도를 계산하고 관측 값에 상응하는 모델 값을 계산하는 과정을 포함한다. 항공 관측 자 료에 대한 관측 연산자는 관측 값에 상응하는 모델 값 계산뿐만 아니라 관측 및 모델 값에 대한 시공간 평균 과정도 포함한다. 이는 Kim et al. (2012)에서 언 급된 바와 같이 탄소추적시스템에서는 일 관측 값의 평균을 자료 동화에 사용하기 때문이다. 공간 평균은 2.1장에 제시된 바와 같이 수행된다.
개발된 관측 연산자 모듈(user_output_flight)을 구성 하는 서브루틴(subroutine)과 서브루틴 수행의 순서 및 자세한 설명을 Table 1에 나타냈다. 관측 연산자는 CONTRAIL 관측 자료로부터 시공간 정보(관측 시각, 위·경도 및 고도)와 이산화탄소 몰농도 등의 정보를 읽는 초기화 단계(user_output_flight_init), 관측 값 및 x
xta = xtb + K y( o − H x( )tb ), xi'a = xi'b − k˜H x( ),i'b
k˜
Fig. 2. Schematic of the preprocessing of the observation data.
계산된 모델 값의 시공간 평균을 계산하는 단계(user_
output_flight_step), 그리고 앞서 Fig. 1에서 정의한 구 간(bin)의 형태로 결과값을 저장하는 단계(user_output_
flight_done)로 구성된다. 관측 자료 전처리 과정에서 수행한 전진 실험이 바로 관측 연산자를 이용한 실험 이었는데, 전진 실험에서는 잠재 소용돌이도 계산 과 정이 관측 연산자 내에 포함되지만 지표면 탄소 플럭 스 최적화를 위한 자료동화 과정에서는 계산의 효율 을 위해 포함하지 않는다.
관측 연산자를 이용해 관측 자료에 상응하는 모델 값을 산출한 후 앙상블 칼만 필터 방법으로 상태 벡 터를 업데이트 한다. 앙상블 칼만 필터 과정에서는 식 (1), (2)의 칼만 게인 행렬과 감소된 칼만 게인 행렬을 계산해 분석 값을 구하고, 다음의 식 (3)을 이용해 다 음 분석 단계에 대한 배경 값을 구하게 된다. 즉 식 (3)은 수치예보에서의 예보 단계에 상응한다고 할 수 있다.
(3)
여기서 xp는 고정된 값으로 1로 정해져 있다(Kim et al., 2012). 즉, 탄소추적시스템에서는 이전 분석 단계 로부터 지속된 정보와 고정된 값의 조합으로 현재 단 계의 배경 값을 계산하게 되며, 만약 관측으로부터 새
로운 정보가 들어오지 않으면 배경 값이 xp(즉, 1)로 수렴한다. 이는 자료동화 과정을 통해 상태 벡터가 업 데이트 되지 않으면 상태 벡터가 초기의 추정값으로 수렴되게 하는 효과가 있다(Peters et al., 2007).
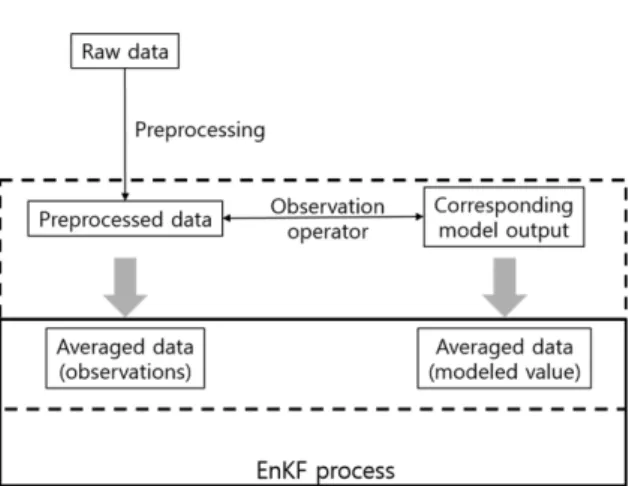
개발된 항공 관측 자료동화 시스템의 모식도를 Fig.
3에 나타냈다. 먼저 원시 미가공 자료로부터 몇 단계 의 전처리 과정을 거쳐 최종 입력 자료를 생산한다.
관측 연산자 내에서는 관측 위치 및 시간에 상응하는 xtb = xt−2a + xt−1a + xp
---3
Table 1. Description of the function of subroutines in the developed observation operator. Variables represent flight information and CO
2concentration information, and bin variables represent flight information and CO
2concentration information averaged over the bin.
Name Description
user_output_flight_init Initialize variables and read CONTRAIL data when the data assimilation cycle starts user_output_flight_reset Deallocate variables
user_output_flight_read Allocate variables and read CONTRAIL data user_output_flight_bin_reset Deallocate bin variables
user_output_flight_bin_init Initialize bin variables
user_output_flight_step Calculate model and CONTRAIL observation values
user_output_flight_sample Calculate model values corresponding to CONTRAIL observations user_output_flight_write Save data from user_output_flight_sample
user_output_flight_bin_write Average model and CONTRAIL observation values spatiotemporally, and save the average to bin variables
user_output_flight_reset Deallocate variables
user_output_flight_read Allocate variables and read CONTRAIL data for the next time step user_output_flight_bin_reset Deallocate bin variables
user_output_flight_bin_init Initialize bin variables for the next time step user_output_flight_done Save results when the data assimilation cycle ends user_output_flight_write Save data from user_output_flight_sample
user_output_flight_bin_write Average model and CONTRAIL observation values spatiotemporally, and save the average to bin variables
user_output_flight_reset Deallocate variables user_output_flight_bin_reset Deallocate bin variables
Fig. 3. Schematic of the developed aircraft CO
2measurement
data assimilation system.
지 격자 설정은 Kim et al. (2016)과 같다. CONTRAIL 자료가 2005년 11월부터 있지만 자료의 양의 매우 불 규칙하기 때문에, 자료가 충분히 동화되어 CONTRAIL 자료 동화의 효과를 뚜렷이 볼 수 있는 2009년에 대 한 분석을 수행하였다.
Figure 4는 자료동화 전(Prior 실험), 지표 관측 자 료동화 후(CNTL 실험), 지표 관측에 CONTRAIL 관 측이 추가 동화된 후(CONTRAIL 실험) 생권 및 해양 플럭스의 전구 분포를 나타낸 그림이다. 자료동화 전 후인 Prior와 CNTL을 비교해보면, 자료동화 과정을 거치면서 지표면 탄소 플럭스의 흡수 및 배출 강도가 지역에 따라 강해짐을 알 수 있다(Figs. 4a, b). 특히 대륙 지역을 봤을 때 남반구에 비해 북미, 유럽, 아시 아 등 북반구에서 자료동화 전후 차이가 큰데, 이는 북반구 대륙 지역의 탄소 플럭스 강도가 남반구에 비 해 더 클 뿐만 아니라(Gurney et al., 2002) 북반구 지 역에 더 많은 관측 자료가 동화되어 초기에 과소 추 정된 플럭스를 보정하기 때문인 것으로 보인다. Figures 4b, c에 나타난 바와 같이, 지표면 생권 이산화탄소 플럭스 관점에서 시베리아와 중국의 일부 지역에서 흡수가 나타나고, 유럽 남부에서 배출이 나타나는 것 은 기존의 연구 결과(e.g., CarbonTracker 2013B, 2015) 와 일치한다. CNTL 실험과 CONTRAIL 실험의 결과 를 비교해보면, CONTRAIL 자료가 동화됨에 따라 시 베리아 지역의 지표면 탄소 플럭스의 흡수 강도가 특 히 약해짐을 확인할 수 있다(Fig. 4c). 이는 탄소추적 시스템에 기존에는 동화되지 않던 시베리아 지역의 지표 관측 자료를 동화함에 따라 시베리아 지역의 탄 소 플럭스 흡수 강도가 약해짐을 보였던 Kim et al.
(2017b)과 일치하는 결과로, CONTRAIL 자료를 동화 함에 따라 더 많은 자료의 동화로 인해 시베리아 지 역의 지표면 탄소 플럭스가 더 잘 추정됨을 의미한다.
개발된 시스템을 이용해 모의된 이산화탄소 농도를 자료동화에 사용된 전구 지표 관측 이산화탄소 농도
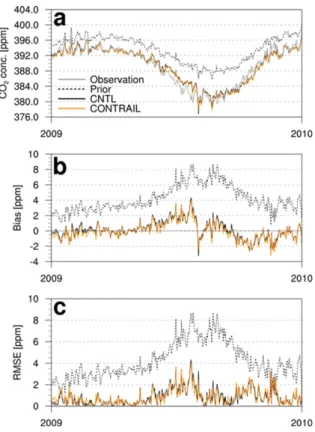
자료와 비교해 보았다(Fig. 5). 자료동화에 사용된 지 표 관측 이산화탄소 농도로 검증을 한 것은 개발된 시 스템이 잘 작동하는지를 확인하기 위해서이다. 자료동 화가 잘 수행되면, 자료동화 전보다 자료동화 후 모의 자료가 관측 자료와 더 비슷해져야 한다. 따라서 자료 동화 전 지표면 탄소 플럭스로부터 계산된 이산화탄 소 농도(Prior)와 자료동화 후 지표면 탄소 플럭스로 부터 계산된 이산화탄소 농도(CNTL, CONTRAIL)를 비교하였다. 자료동화 전(Prior)에는 관측에 비해 이산 화탄소 농도를 과대모의 하였으나, 자료동화 과정을 거친 CNTL 실험과 CONTRAIL 실험에서 모의한 이 산화탄소 농도는 관측과 비슷해졌다(Fig. 5a). 탄소추
Fig. 4. Average (a) prior CO
2flux (gC m
−2yr
−1), (b) posterior CO
2flux produced by assimilating surface CO
2observations, and (c) posterior CO
2flux produced by assimilating both surface CO
2observations and CONTRAIL data in 2009.
These fluxes include biosphere and ocean fluxes only. The
green color denotes net CO
2flux uptake by the surface,
whereas the red color denotes net CO
2flux release to the
atmosphere.
적시스템의 초기 플럭스는 생권, 해양, 화재, 그리고 화석연료 플럭스로 구성되는데 생권 및 해양 플럭스 만 자료동화 과정을 거친다(Peters et al., 2007). 즉, 화재 및 화석연료 플럭스는 자료동화 전후에 차이가 없으며, 생권 및 해양 플럭스는 자료동화 전보다 자료
동화 후 전구 평균적으로 탄소 흡수가 증가하여 관측 과 비슷해졌다. 이로 인해 자료동화 전에, 관측보다 이 산화탄소 농도를 과대모의 했던 것이 보정된 것으로 보이며, 이는 자료동화 후인 CNTL 실험과 CONTRAIL 실험에서 bias와 root-mean-square error (RMSE)가 작 아진 것으로 확인할 수 있다(Figs. 5b, c). Bias와 RMSE 는 CONTRAIL 실험에서 CNTL 실험보다 그 크기가 각각 22.5%, 2.3% 작아 CONTRAIL 자료를 추가로 동화한 것이 효과적이다(Table 2). CONTRAIL 실험 과 CNTL 실험의 차이가 전구 평균보다는 지역적으 로 더 크게 나타나는데, 이는 Kim et al. (2017a)의 결과와 유사하다. 전구 평균에서 CNTL 실험과 CONTRAIL 실험의 차이가 지역적 분포에 비해 상대 적으로 작은 것은 검증에 사용한 전구 지표 관측 이 산화탄소 농도 자료가 두 자료동화 실험에 모두 사용 된 것에 기인한다. 결과적으로 개발된 시스템을 이용 하여 자료동화 후 모의된 지표 이산화탄소 농도가 관 측된 이산화탄소 농도와 더 비슷하여 개발된 시스템 이 잘 작동함을 알 수 있다.
4. 요약 및 결론
본 연구에서는 탄소추적시스템에 이산화탄소 항공 관측 자료를 동화할 수 있는 이산화탄소 항공 관측 자료동화 시스템을 개발하고 테스트 실험을 통해 개 발된 시스템으로 모의된 결과를 평가하였다. 본 연구 에서는 일본을 중심으로 수행된 CONTRAIL 프로젝 트로부터 얻어진 이산화탄소 항공 관측 자료를 기반 으로 항공 관측 자료동화 시스템을 개발하였다.
CONTRAIL 프로젝트는 온실 기체 관측을 목적으로 일반 여객기에 관측 장비를 탑재하여 관측을 수행하 기 때문에 비행 경로를 따라 넓은 공간에 관측이 분 포한다. CONTRAIL 프로젝트로부터 얻어진 관측 자 료는 신뢰도가 높아 모델 및 위성 자료를 검증하거나 지표면 탄소 플럭스를 추정하는 데 많이 사용되고 있 다. 따라서 CONTRAIL 자료를 기반으로 항공 관측 자료동화 시스템을 개발함으로써, 지표면 탄소 플럭 스를 보다 정확하게 추정할 수 있을 것으로 기대된다.
자료동화에 앞서 원시 미가공 관측 자료의 전처리 과정이 필요하다. 우선 결측값을 제거하고 모델 입력
Fig. 5. Time-series of (a) the observed CO
2concentrations
(gray solid) and modeled CO
2concentrations from: prior CO
2flux (Prior, black dot), the CO
2flux optimized by assimilating surface CO
2observations (CNTL, black solid), and the CO
2flux optimized by assimilating both surface CO
2observations and CONTRAIL data (CONTRAIL, orange solid), (b) bias of Prior (black dot), CNTL (black solid), and CONTRAIL (orange solid) with respect to observations, and (c) RMSE of Prior (black dot), CNTL (black solid), and CONTRAIL (orange solid) with respect to observations, calculated over the globe in 2009.
Table 2. Average CO
2concentrations, bias, and RMSE of Prior, CNTL, and CONTRAIL experiments in 2009, based on observations.
Prior CNTL CONTRAIL Observation
Concentration [ppm] 393.66 389.553 389.374 389.452
Bias [ppm] 4.2123 0.1008 −0.0781
RMSE [ppm] 4.5438 1.1528 1.1262
상블 칼만 필터 과정에서는 상태 벡터를 최적화하고 다음 단계의 배경 값을 계산하는 과정이 수행된다. 결 과적으로 이산화탄소 항공 관측 자료에 대한 전처리 과정, 관측 연산자, 그리고 전처리 과정과 관측연산자 를 CT2013B 내의 앙상블 칼만 필터와 연계하여 항 공 관측 자료를 동화하는 전체 시스템을 개발하였고, 테스트 실험을 수행해 개발된 시스템이 잘 작동함을 확인하였다. Kim et al. (2016)에서 언급된 바와 같이 CONTRAIL 자료를 대기 인버스 모델링 방법에 사용한 선행 연구 결과간에 차이가 있기 때문에, CONTRAIL 자료동화가 지표면 탄소 플럭스 추정에 미치는 영향 에 대해 좀 더 정량적인 분석을 향후 수행할 예정이다.
본 연구를 통해 개발된 탄소추적시스템과 연동하는 이산화탄소 항공 관측 자료동화 시스템은 지표면 탄 소 플럭스 추정 결과 개선에 기여할 뿐만 아니라, 추 후 다른 항공 프로젝트로부터 관측된 이산화탄소 자 료를 탄소추적시스템에 동화할 수 있는 기반이 될 것 으로 기대된다.
감사의 글
본 연구는 기상청 기후변화 감시·예측 및 국가정책 지원강화사업(KMIPA 2015-2021)의 지원으로 수행 되었습니다. 연구에 도움을 주신 국립기상과학원 기 후연구과와 미국 NOAA의 Andrew Jacobson 박사님 및 이산화탄소 항공 관측 자료를 제공해 주신 일본 National Institute for Environmental Studies (NIES)의 Toshinobu Machida 박사님께 감사를 전합니다.
REFERENCES