2004, Vol. 15, No. 4, pp. 1019∼1031
Multiple State Hidden Markov Model to Predict Transmembrane Protein Topology1)
Sang-Mun Chi2)
Abstract
This paper describes a new modeling method for the prediction of transmembrane protein topology. The structural regions of the transmembrane protein have been modeled by means of a multiple state hidden Markov model that has provided for the detailed modeling of the heterogeneous amino acid distributions of each structural region.
Grammatical constraints have been incorporated to the prediction method in order to capture the biological order of membrane protein topology. The proposed method correctly predicted 76% of all membrane spanning regions and 92% sidedness of the integration when all membrane spanning regions were found correctly.
Keywords : grammatical constraints, multiple state hidden Markov model, transmembrane protein topology
1. Introduction
Transmembrane proteins play important biological roles such as transport system of pumps and channels, receptors, energy transducers, and enzymes. The pharmaceutical industry have particularly interested in these proteins, since the membrane-bound receptors and channels have been proven to be therapeutic targets, and the membrane proteins often mediate acquired resistance to drugs.
The large part (15% - 30%) of all genes in most genomes encode transmembrane proteins, and genome sequencing projects produce a large number of protein sequences. But, the intrinsic difficulties in crystallization of these proteins make it difficult to determine the structure of membrane proteins. Hence, the topology of 1) This Research was supported by Kyungsung University Research Grants in 2004.
2) Assistant Professor, Department of Computer Science, College of Multimedia, Kyungsung University, 110-1 Daeyeon-dong, Nam-gu, Pusan, 608-736, Korea
E-mail: [email protected]
the vast majority of membrane proteins remains biochemically undetermined.
Reliable computational methods for topology predictions are needed to provide the basis for further experimental analysis.
Previously, transmembrane protein structure predictions used local properties such as hydrophobicity (Kyte and Doolittle, 1982, Eisenberg, 1984, Engelman, 1986) and the abundance of positively charged residues on the cytoplasmic side of the membrane (Heijne, 1992). As more reliable data were available, several hidden Markov model (HMM) based procedures were developed which applied whole amino acid distributions in various regions of proteins for prediction (Jones, 1994;
Tusnady, 1998; Krogh, 2001). The advantages of neural network-based algorithms and combining prediction methods with multiple alignments are also used (Rost, 1995; Casadio, 1996; Persson and Argos, 1997).
H E L I X
H E L I X
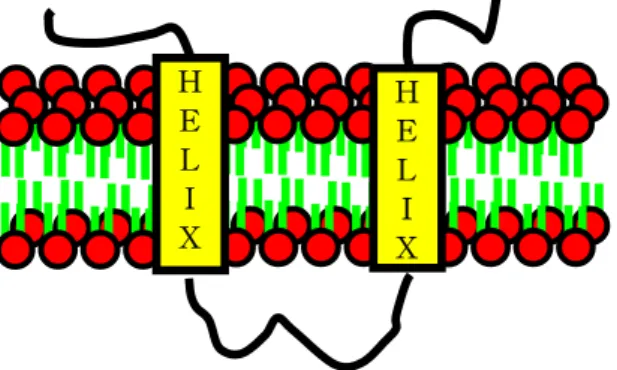
Figure 1. Transmembrane proteins. integral membrane proteins interact extensively with the hydrocarbon region of the bilayer.
HMM can be well suited statistical model for prediction of transmembrane protein topology because it can incorporate hydrophobicity, charge bias, helix lengths, and grammatical constraints into one model. The HMM based methods gave the best performance in the evaluation test (Moeller, 2001). But, the modeling capability of HMM may not be completely used in these method ; these methods used a common output probability for every states of HMM. Hence, the previous HMM-based methods can not model changing statistical distributions of amino acids inside each modeling region of transmembrane proteins. The analysis of proteins in membrane showed that there was a distinct center-to-end heterogeneity in the distribution of amino acids of protein in membrane (Heijne, 1994). The present work uses multiple states with state-dependant output probability in order to model the position-specific statistical properties of structural part. This work also incorporates grammar during the prediction of transmembrane protein topology in order to mimic the biological rule of membrane protein topology. Statistical analysis of amino acid distribution and cross-validation are performed to validate the effectiveness of the proposed modeling.
2. Transmembrane protein modeling
2.1 Hidden Markov model for modeling transmembrane proteins Membrane lipids form a permeability barrier, and transmembrane proteins act as a transport system of pumps and channels, receptors, energy transducers, and enzymes that endow the membrane with selective permeability. The membrane lipids and proteins are illustrated in Figure 1 : (a) the hydrophilic units, also called the polar head group, are represented by a circle, whereas the hydrocarbon tails are depicted by straight or wavy lines, (b) the transmembrane proteins are symbolized by rectangle, (c) the loops between transmembrane helices are depicted by thick curves.
Chemical property is different in each structural part of membrane proteins ; most of the amino acids in the membrane-spanning α helices are nonpolar and only a very few are charged ; those parts that interact with aqueous environment are much more hydrophilic ; positively charged residues are prevalent in the cytoplasmic loops. These different properties are used to characterize each structural part of membrane proteins. The present work uses HMM to model variable-length amino acid sequence of the structural part of membrane proteins - inside and outside loop of a cellular membrane, membrane helix. The region of protein for modeling are defined differently for method to method, which will be compared in chapter 2.2.
...
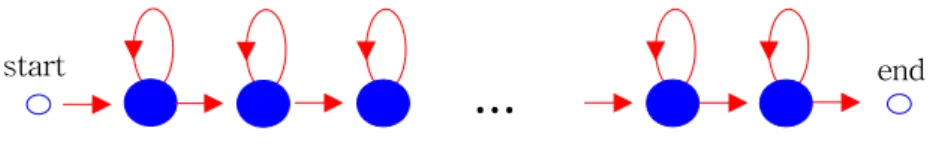
Figure 2. The topology of the HMM used for the present work
start end
A HMM is a Markov chain where the output observation is a random variable X generated according to a output probabilistic function associated with each state.
Briefly, HMM is a collection of states connected by transitions, which have two set of probability ; state transition probability and output probability. The HMM is very well suited for prediction of transmembrane helices because it can incorporate hydrophobicity, charge bias, helix lengths, and grammatical constraints into one model for which algorithms for parameter estimation and prediction already exist (Durbin, 1998). To build the HMM for the prediction, the parameters of the HMM can be estimated by using the maximum likelihood criterion. The iterative procedure, the Baum-Welch algorithm, is used to estimate both the output distributions and transition probabilities in a maximum likelihood sense. The
membrane protein topology is predicted using the Viterbi algorithm given the parameters and the sequence of amino acids.
The present work uses left-to-right Bakis topology HMM to model each region of membrane proteins, as shown in Figure 2. Each of the HMM for modeling is allowed to have different number of states for the optimal prediction. Multiple states with their own output distributions are used to model the position specific statistical properties of each region, whereas an identical distribution is used in the previous HMM based methods (Jones, 1994; Tusnady, 1998; Krogh, 2001).
2.2 Comparison of the modeling regions for several methods Prediction methods devide transmembrane protein into several regions for modeling and use different HMM structures. These definitions of region are considered on three prediction methods, MEMSAT (Jones, 1994), HMMTOP (Tusnady, 1998), and TMHMM (Krogh, 2001), which were based on HMM and showed good performance in the test (Moeller, 2001).
Ho
Figure 3. Configuration of modeling units in MEMSAT Hi
Hm Ho
Hi Hm Out
In
Lo
Li
Lo
Figure 4. Configuration of modeling units in HMMTOP H
e l I x Out
In
Tail
H e l I x Tail
Tail
Outside loop
H e
l I x
H e
l I x
Inside loop
The MEMSAT has modeled membrane proteins with five modeling units as can be seen from Figure 3 : Li (inside loop), Lo (outside loop), Hi (inside helix end), Hm (helix middle), and Ho (outside helix end). The number of residues taken to be in the helix end caps is arbitrarily taken as being four. Each of the structural classes is modeled with one distribution of amino acid residues. The MEMSAT has used dynamic programming algorithm to maximize the sum of log likelihoods over the sequences. In fact this method is one step of the HMM, i. e. finding the best state sequence for the amino acid sequence if the parameters and the models are given.
The HMMTOP also has used five modeling units as illustrated in Figure 4 : inside loop, inside helix tail, membrane helix, outside helix tail and outside loop.
The helix parts are embedded in the membrane. The term loop means the longer part of a sequence outside the membrane, which can form a domain or a simpler structure. The tail is the elongation of the membrane helix, and it can be followed by a loop or another tail, forming a short loop interacting with the outside or inside part of the membrane. Helix tails are not in the membrane, helix ends are the very ends of helices located in the membrane. Loops are modeled with non-fixed length (NFL) states. From an NFL state, there are only two possible transitions: one to the same state and the other to the next structural part.
Common distribution of amino acid residues is used for modeling the NFL states.
Helix and tails are modeled with fixed length (FL) states. There are MAXL states to limit the length of the residues of each structural part. The only transition to the next state is possible from each of the first MINL states. In each state between MINL and MAXL, there is an another possible transition from the current state to next modeling unit. Like the MEMSAT, common distribution of observation-symbol in FL states is used in the HMMTOP.
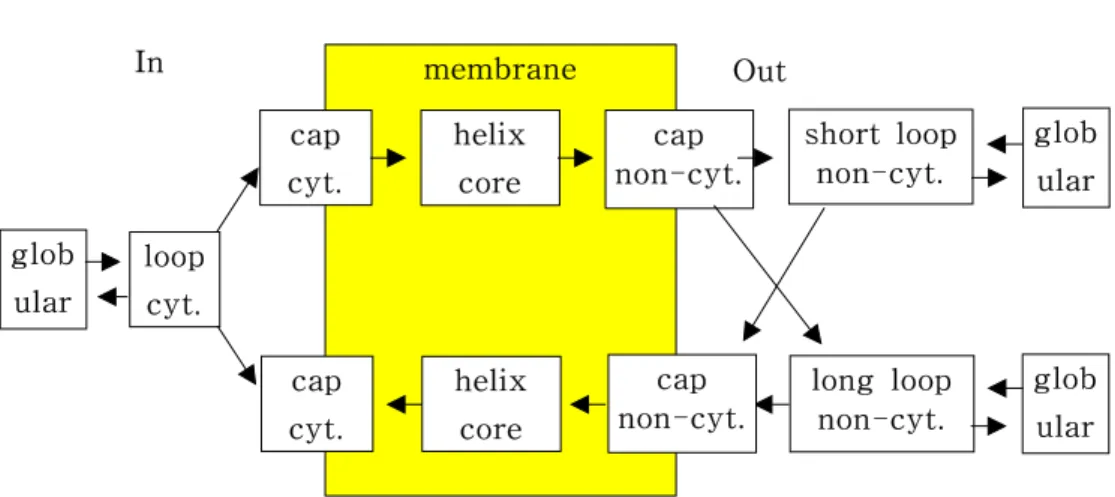
Figure 5 shows the layout of the models in TMHMM. Each box in the drawing corresponds to a HMM designed to model a specific region of a membrane protein. These models contain several HMM states in order to model the lengths of various regions. The arrows show how transitions between models can be made such that they obey the grammatical structure of helical transmembrane proteins. The models labeled "globular" in Figure 5 are identical and consist of just one state with a transition to itself and to a loop model. To capture the topogenic signal of the proteins, the residues close to the membrane are modeled in the models labeled "loop" and "cap". Loops of lengths up to 20 residues are modeled by loop model, whereas longer loops have to use the globular state. All of the 20 loop states of a loop model have the same distribution of amino acid residues, but the three loop models are different. The cap models simply model the five first or last residues of the transmembrane regions. The model for the core
membrane
Figure 5. Configuration of modeling units in TMHMM In Out
loop cyt.
glob ular
cap cyt.
helix core
cap non-cyt.
short loop non-cyt.
glob ular
cap cyt.
helix core
long loop non-cyt.
glob ular cap
non-cyt.
of the transmembrane helices is an array of 25 identical states with the possibility of jumping from one of the states to many of the states down-stream. This topology models sequences of lengths between five and 25, witch translates to helix lengths between 15 and 35 when the caps are included.
3. Modeling structural parts with multiple states and grammar
All of the methods described in 2.2 used only one output probability for modeling the regions of transmembrane protein. But, analyses of membrane proteins show that the amino acid distributions in membrane proteins have different characteristic biases with the position of each structural part. As a result of the tendency for the buried residues to be more polar than the lipid-exposed ones, there is a distinct center-to-end heterogeneity in the distribution of apolar amino acids, with the aromatic residues Phe(F), Tyr(Y), and Trp(W) concentrated at the ends and the aliphatic residues Leu(L), Ile(I), Val(V) more often found near the center (Heijne, 1994).
Multiple states with state-dependent output probability distribution are essential for modeling this changing amino acids distribution with the position of amino acids in each structural part. Chapter 4.2 will present more statistical analysis about the center-to-end heterogeneity in the distribution of amino acid. The present work has modeled multiple states with their own different output distributions for each structural parts of membrane protein. The present work uses simple natural structural parts shown in Figure 1 : inside (cytoplasmic) loop, outside loop, membrane helix.
start
inner loop
outer loop
outer loop
inner loop
end
Figure 6. Grammar for the membrane protein topology helix
helix
helix helix
Grammar has been incorporated to the prediction method in order to capture the biological order of membrane protein topology. As illustrated in Figure 1, membrane proteins follow a "grammar" in which cytoplasmic and non-cytoplasmic loops have to alternate. The present work uses this natural structure of transmembrane proteins, i. e. inside loop is followed by helix, helix is followed by outside loop and outside loop is followed again by helix. Figure 6 shows this grammatical structure of membrane protein topology. The arrows show how the transitions between structural parts can be made ; The existence of the first loop alone is excluded in the present work, although it is possible in Figure 6. The topology of HMM illustrated in Figure 2 has been used for each structural parts, inner loop, helix, and outer loop. The grammar constrains possible topology, and thereby possible transmembrane protein topology. To find the most probable topology, prediction methods search the sequence of structural parts ˆ = wW 1w2…wm that has the maximum posterior probability P(W |X) for the given amino acid sequence X = x1x2…xn . That is,
ˆ = argmaxW
W P( W |X) = argmax W
P( W )P( X|W )
P( X) = argmax
W P( W )P( X|W ) (1) where, P( X|W ) is a probability of amino acid sequence given sequence of structural parts, i. e., given the sequence of HMMs for the structural parts.
Each of the HMM for the structural parts is inserted into the finite state grammar (FSM) in Figure 6. The finite state HMM network that encodes all the legal sequence of structural parts Wˆ = w1w2…wm can be constructed based on this expansion procedure. The decoding process is achieved by performing a time-synchronous Viterbi search on this composite finite state HMM. Since the FSM is used in this work, the following value is used instead of the true probability of a sequence of structural parts.
P( W ) = P( w1w2…wm) ={ 1 for allowed sequence in Figure 6
0 for other wise (2)
4. Experiments and evaluation 4.1 Evaluation criteria and database
The most successful methods attempt to predict the full topology of membrane proteins, i. e. the total number of transmembrane helices and their in/out orientation relative to the membrane. There are several types of mis-prediction that can occur when predicting the topology of a membrane protein. The simplest errors are over-predictions and under-predictions, i. e. predicting a transmembrane region where none is present or missing a true transmembrane region. Another type of error is that two adjoining transmembrane regions are joined together, so that they are predicted as a single long region, which we will term as a "false merge". Similarly, a long transmembrane region can be falsely predicted as being two short regions, here termed a "false split". Of course, all the helices can be predicted correctly, but the overall topology can be predicted as the inverse of the real topology, i. e. an inverted topology.
For an membrane spanning region (MSR) to be evaluated as correct, it must share at least nine residues with the reference annotation's MSR in the test (Moeller, 2001). This evaluation rule is also adopted in the present work. Each program was rated by two values. Firstly, it was rated by the percentage of predicted proteins whose all MSRs are found correctly. Secondly, it was rated by the percentage of the correct sidedness of the protein's membrane integration.
To benchmark the performance of transmembrane protein prediction programs, it is necessary to use a test set of sequences with experimentally confirmed transmembrane regions. The source data for this work were a set of documented transmembrane proteins extracted from Release 23.0 of SWISS-PROT (Moller, 2001). This test set contains 188 proteins with 883 MSRs that have been determined from either their elucidated structures or by fusion experiments. These data will be used for the experiments in table 2. The part of newly updated database was used for the present work from the database A, B, and C (Moeller 2001). The content of this set is almost same with the database in previous database, but some more error correction. The data with explicit annotated orientation will be used for the experiments in table 1 and 3, this test set contains 184 proteins with 870 MSRs.
4.2 Statistical analysis on the distribution of amino acids
The present work used chi-square test to determine whether there was a distinct center-to-end heterogeneity in the distribution of amino acids. Different p segments in structural parts of transmembrane proteins were obtained by dividing the structural part with p equivalent length. The null hypothesis H0 for this test is that these segments all have the same distribution.
pi1= pi2= … = pip, i = 1,2,…,20 (3) where, A1,A2,…,A20 represent 20 types of amino acids, Xj is a random variable for the j-th segment and P{Xj∈Ai} = pij.
This is exactly the problem of testing the equality of p independent multinomial distributions. Let n1,n2,…,np be the number of observations on X1,X2,…,Xp, respectively. Since pij's are not known, these are estimated form the data. The maximum likelihood estimates for the common probability under
H0:pi1= pi2= … = pip,i = 1,2,…,20 are
pi ˆ = ∑p
j = 1Xij
∑
p j = 1nj
, i = 1,2,…,20, (4)
where, Xij is the number of observations on Xj that is amino acid Ai. If n1,n2,…,np are sufficiently large, the random variable
V = ∑p
j = 1 ∑20
k = 1
[
( Xijn- njˆpijˆ)pi 2]
(5) is approximately chi-square random variable with p(20-1)-(20-1)= 19(p-1) degree of freedom. H0 is rejected at level α if the computed value of χ2 is >χ19(p-1),α2 .
Table 1. Chi-square homogeneous test for the structural parts of membrane protein
Structural part v
Membrane helix 420.13
Inner loop 262.35
Outer loop 208.28
In table 1, five segments ( p = 5) from each of the structural part is used. Since the values v = ∑5
j = 1 ∑20
k = 1
[
( xij- nnjˆpijˆ)pi 2]
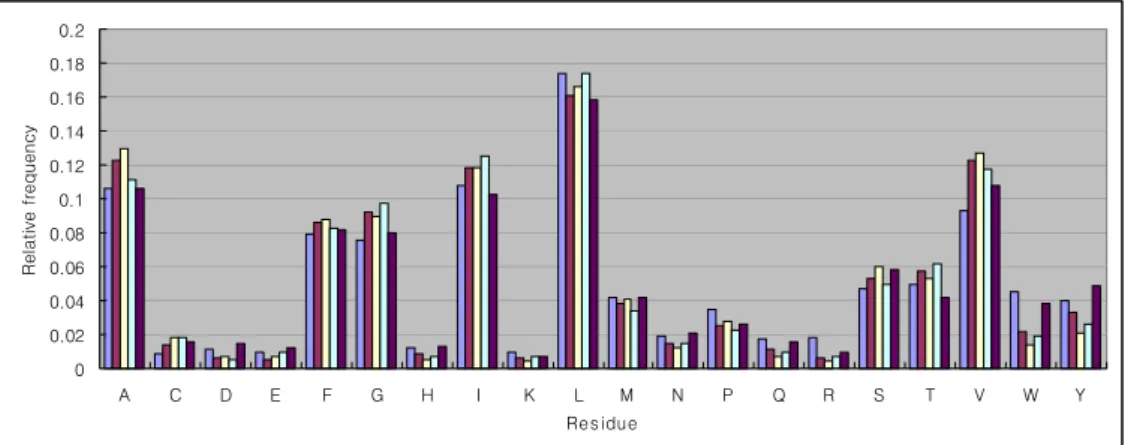
of all structural parts are larger than χ76,0.0012 = 119.85, H0 is rejected at level 0.001. This analysis result shows that the distributions of five segments of each structural parts are not the same. This result supports the requirement of multiple states with their own output probability for the detailed modeling of each structural part.Figure 7 : The relative frequency of amino acids of membrane helix for five segments.
0 0.02 0.04 0.06 0.08 0.1 0.12 0.14 0.16 0.18 0.2
A C D E F G H I K L M N P Q R S T V W Y
Res idue
Relative frequency
Figure 7 shows well-known tendency that the relative frequencies of amino acids are higher at hydrophobic residues, A, F, G, I, L V than at polar and charged residues, K, R, D, E, C, H, N, Q. In addition, the high frequencies of A, F, G, I, V at the center segments and D, E, W, Y at the end segments are in agreement with Heijne(1994). Thus, this figure also shows the usefulness of using multiple output probability for the membrane helix modeling. But, for the inside and outside loop, no decisive pattern of bias for the amino acid distribution with
position was found. Further works should be needed to effectively model the loops, which form a domain or a structure in cytoplasmic side and outer membrane.
4.3 Comparison results of several methods
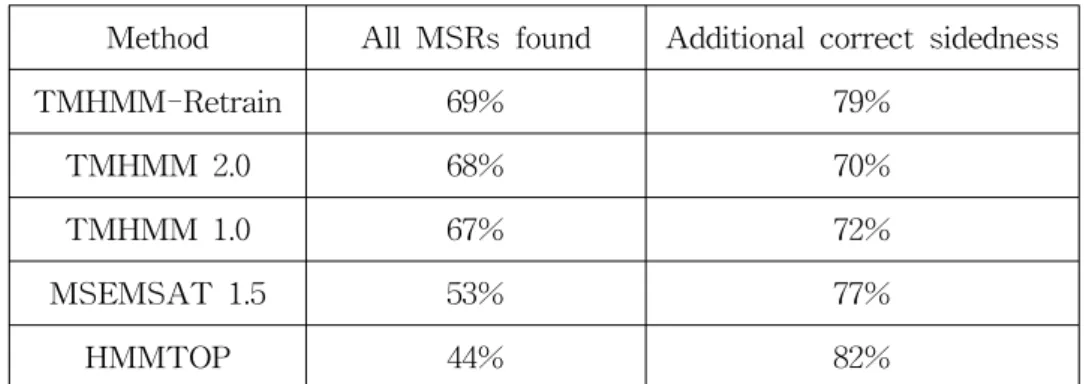
The proposed method will be compared with the results in Table 2, which shows the performance of HMM based methods on all membrane spanning regions (MSRs) in the previous evaluation test (Moeller, 2001). The effectiveness of the proposed modeling is validated step by step. The first experiment, "One output probability", uses single model with one state for modeling units such as inner loop, membrane helix, outer loop. Since this modeling method can not model the position-specific heterogeneity in the distribution of amino acids, the performance of this method is low as can be seen in Table 3.
Table 2. Topology prediction performance of several methods Method All MSRs found Additional correct sidedness
TMHMM-Retrain 69% 79%
TMHMM 2.0 68% 70%
TMHMM 1.0 67% 72%
MSEMSAT 1.5 53% 77%
HMMTOP 44% 82%
Table 3. Topology prediction performance of the proposed method
Method All MSRs found Additional correct sidedness
One output probability 36% 82%
Multiple states 76% 92%
Multiple states (cross-validation) 61% 86%
The proposed method, Multiple states, uses multiple state HMM in order to model the changing distribution of amino acids with the position of amino acid.
Outer loops of lengths up to 15 (half of the total outer loops) are modeled with 3 state HMM, while the outer loops of lengths larger than 16 are modeled with 16 state HMM. Similarly, 3 state HMM for inner loops of lengths up to 20 (half of the total inner loops), 21 state HMM inner loops of lengths larger than 21, 12
state HMM for membrane helices of lengths up to 20 (half of the total membrane helices), 21 state HMM for membrane helices of lengths larger than 21. As can be seen from the table 3, this method gives improved results than the "One output probability" and the previous methods in table 2. The proposed method can predict 76% of the membrane protein's all MSRs correctly and gives marked improvement of correct sidedness, 92% prediction rate for correct sidedness by including the grammar into the search of probable membrane protein topology.
Because of the lack of independent test data, tenfold cross-validation was performed. The test set of 184 membrane proteins was partitioned into ten subsets with 18 or 19 proteins in each. Cross-validation was done by training on all sequences in nine subsets, and testing the accuracy on the subset left out from training. The fourth row of Table 3 shows the results using the cross-validation.
This results show slightly better performance than the previous methods (35 ~ 60% for all MSRs found, 36 ~ 83% for additionally correct sidedness in Moeller(2001)).
5. Conclusion
The proposed method for the prediction of transmembrane topology gave 76 % correctness for the prediction of all MSRs and 92% prediction rate for correct sidedness. These experiments were run on a set of well-characterized transmembrane proteins. The performance of the proposed method was higher than any other HMM based methods for the prediction of all MSRs and their sidedness.
In particular, marked improvement of the determination of the sidedness of transmembrane proteins was obtained by including grammar into the search of probable membrane protein topology.
The proposed method uses multiple states with their own distribution in order to model the position-specific heterogeneity in distribution of amino acids while an identical distribution was used for modeling structural parts of membrane proteins in the previous HMM based methods. From the chi-square test and the relative frequency of amino acids for each segments of membrane helix, the position-dependent heterogeneity in the distribution of amino acids can be seen.
These analyses explain the reason why the use of multiple output probability could give higher performance than one output probability.
Although multiple states were also used for the modeling of inner and outer membrane protein region in this work and gave a improved result, there remains some uncertainty as to structure of inner and outer loop. Further analysis of loop structure will be needed for the fine-tuning of HMM topology.
References
1. Durbin, R. M., Eddy, S. R., Korgh, A. and Mitchison, G. (1998)
Biological Sequence Analysis, Cambridge University Press, Cambridge, UK.
2. Engelman, D. M., Steitz, T. A., and Goldman, A. (1986). Identifying nonpolar transbilayer helices in amino acid sequences of membrane proteins. Annu. Rev. Biophys. Biophys. Chem. 15, 321-353.
3. Eisenberg, D., Schwartz, E., Komaromy, M. and Wall, R. (1984).
Analysis of membrane and surface proteins sequences with the hydrophobic moment plot. J. Mol. Biol. 179, 125-142.
4. Jones, D. T., Taylor, W. R. et al. (1994) A model recognition approach to the prediction of all-helical membrane protein structure and topology.
Biochemistry, 33, 3038-3049.
5. Krogh, A. Larsson, B. Heijne, G. and Sonnhammer, E. L. L. (2001) Predicting transmembrane protein topology with a hidden markov model:
application to complete genomes. J. Mol. Biol. 305, 567-580.
6. Kyte, J., Doolittle, and R. F. (1982). A simple method for displaying the hydrophathic character of a protein. J. Mol. Biol. 157, 105-132.
7. Moller, S., Croning, M. D. R.. and Apweiler, R. (2001) Evaluation of methods for the prediction of membrane spanning regions,
Bioinformatics, Vol. 17, no. 7, 646-653.
8. Persson, B. and Argos, P. (1997) Prediction of membrane protein topology utilizing multiple sequence alignments. J. Protein Chem., 16, 453-457.
9. Tusnady, G. E. and Simon, I. (1998). Principals governing amino acid composition of integral membrane proteins: application to topology prediction. J. Mol Biol. 283, 489-506.
10. von Heijne, G. (1992). Membrane protein structure prediction. J. Mol.
Biol. 225, 487-494.
11 von Heijne, G. (1994). Membrane proteins: from sequence to structure.
Annu. Rev. Biophys. Biomol. Struct. 23, 167-192.
[ received date : Jul. 2004, accepted date : Nov. 2004 ]