반도체디스플레이기술학회지 제18권 제3호(2019년 9월)
Journal of the Semiconductor & Display Technology, Vol. 18, No. 3. September 2019.
Study on the Coupled Effects of Process Parameters on Silicon Growth Using Chemical Vapor Deposition
Zaher Ramadan
*, Dong Kuk Ko
**and Ik-Tae Im
*†*†
Dept. of Mechanical Design Eng., College of Engineering, Chonbuk National University,
**
Dept. of Mechanical Eng., College of Engineering, Chonbuk National University
ABSTRACT
Response surface methodology (RSM) is used to investigate the complex coupling effects of different operating parameters on silicon growth rate in planetary CVD reactor. Based on the computational fluid dynamics (CFD) model, an accurate RSM model is obtained to predict the growth rate with different parameters, including temperature, pressure, rotation speed of the wafer, and the mole fraction of dichlorosilane (DCS). Analysis of variance is used to estimate the contributions of process parameters and their interactions. Among the four operating parameters that have been studied, the influences of susceptor temperature and the operating pressure were the most significant factors that affect silicon growth rate, followed by the mole fraction of DCS. The influence of wafer rotation is the least. The validation tests show that the results of silicon deposition rate obtained from the regression model are in good agreement with those from CFD model and the maximum deviations is 2.15%.
Key Words : Chemical Vapor Deposition, Si Epitaxy, Response Surface Methodology, Computational Fluid Dynamics
1. Introduction
1Selective epitaxial growth (SEG) has received a considerable attention and been used in numerous novel device structures fabrication [1-5]. Much of the attention has focused on SEG of silicon via chemical vapor deposition (CVD) technique [6-11]. CVD is an important technology for growing silicon epitaxial layers due to its advantages such as the large scale deposition, low cost and its capability of conformal deposition. Although many efforts have been made to enhance the deposition growth rate as mentioned above, most of the studies were preceded by investigating signal parameter without considering the interaction between the various operating parameters. To enhance the growth rate, the influence degree of the operating parameters and optimized combination of the parameters are very important. One of the most efficient methods to depict
†
E-mail: [email protected]
the coupled impact between different parameters is the response surface methodology (RSM). RSM is a set of statistical and mathematical techniques useful for developing, improving, and optimizing processes in which multiple variables influence the response of interest and the objective is to optimize this response. RSM’s primary benefit is the reduced number of experimental trials required to assess multiple parameters and their interactions. RSM has been widely used in literature to examine and optimize the CVD process [12-16]. Allaedin et al.[14] employed RSM to investigate and optimize the effect of reaction parameters on the synthesis of the nanocarbons in a CVD reactor. An et al. [15] utilized RSM to investigate the operating parameters effects and their interactions on polysilicon CVD reactor based on two-dimensional CFD model. Their results showed a good agreement with the regression formula obtained by RSM and CFD model.
In this study, RSM is used to investigate the influence of
operating parameters; i.e., inlet flow rate, reactor pressure,
Zaher Ramadan, Dong Kuk Ko and Ik-Tae Im 116
rotation speed of wafer and susceptor temperature, on the silicon deposition profile. Based on previously validated three-dimensional model of heat and mass transfer with complex chemical reactions, Twenty five runs are conducted to generate the design of experiments. Analysis of variances is used to estimate the contribution of process parameters and their interaction. Finally a confirmation runs are performed to compare the silicon deposition results obtained from the regression model with those from CFD model.
2. CVD Reactor Model
The modeling in this paper for the epitaxial silicon growth in a CVD reactor is based on the CFD model to solve continuity, momentum, energy and chemical species. The CVD reactor employed in this work is planetary reactor. The reactor consists of five silicon wafers mounted on the satellites on the top surface of the graphite susceptor. Due to the symmetry only one fifth of the entire susceptor was modeled in this simulation. A schematic diagram of the large scale CVD reactor considered for the simulation is illustrated in Fig. 1. The m ixture of dicloreosilane (DCS), HCl and H
2enters the reactor from a centrally placed inlet.
The inlet gases are introduced at atmospheric pressure and
Fig. 1. Schematic diagram of the CVD reactor and com- putational domain considered in this study.
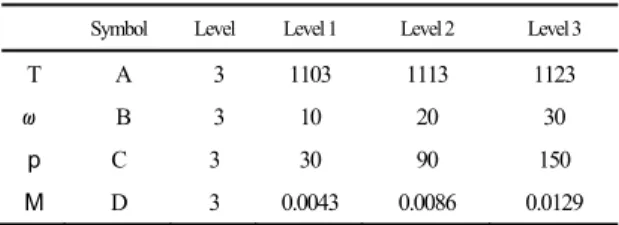
Table 1. CVD process parameters and their levels, units in K, rpm and torr.
Symbol Level Level 1 Level 2 Level 3
T A 3 1103 1113 1123
ω B 3 10 20 30
p C 3 30 90 150
M D 3 0.0043 0.0086 0.0129
300 K. More detailed description of the reactor and the process are given in Ref. [17]. In the present work, this model has been used to study the contribution of several process parameters and its influence on the deposition using RSM.
3. Design of Experiments
The application of RSM to design optimization is intended to reduce the cost of expensive analysis method in a situation where several parameters influence the system performance. This system performance is called the re- sponse. The input variables are called independent variables.
The successful use of RSM critically depends on the experimenter’s ability to develop an appropriate approxi- mating model between the response and the independent variables.Response surface methodology (RSM) consists of a group of mathematical and statistical techniques con- cerned with developing and optimizing process. RSM was developed by Box and Draper [18] to model experimental responses, and then adopted into modeling of numerical experiments. The application of RSM to design optimization is aimed at reducing the cost of expensive analysis method in situation where several parameters influence the system performance. In this study, RSM is used to investigate the influence of operating parameters; i.e., susceptor temper- ature (T), reactor pressure (P), rotation speed of the wafer (ω) and mole fraction of DCS (M), on the silicon deposition to enhance the growth rate. RSM is employed to predict accurate relationship between these parameters.
A second-order model is adopted and given as follows:
(1)
where is the response of the system (silicon growth rate), and are independent variables; is the number of variables; , , and ( = 0, 1, 2, … ;
= 0, 1, 2, … ) are the regression coefficients for the intercept, linear, quadratic and interaction terms respectively;
and ɛ is the statistical error.
In this study, four process parameters with three levels are selected which are shown in Table 1. The search for the optimal solutions was restricted by choosing these three levels to be in the same range used in our previous study
2 1 1
1 2
0 1 i
k
i ii
j i k
i k
j ij
i k
i i
x x x x
y
y
x
ix
jk
0
i
ii
iji k j
k
Study on the Coupled Effects of Process Parameters on Silicon Growth Using Chemical Vapor Deposition 117
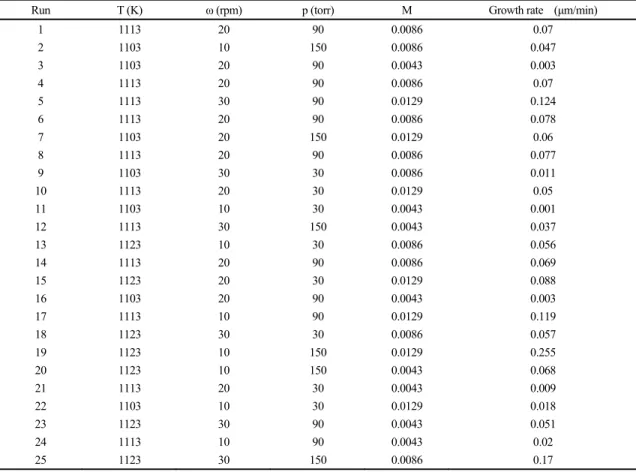
Table 2. Experimental design used in RSM study
Run T (K) ω (rpm) p (torr) M Growth rate (μm/min)
1 1113 20 90 0.0086 0.07
2 1103 10 150 0.0086 0.047
3 1103 20 90 0.0043 0.003
4 1113 20 90 0.0086 0.07
5 1113 30 90 0.0129 0.124
6 1113 20 90 0.0086 0.078
7 1103 20 150 0.0129 0.06
8 1113 20 90 0.0086 0.077
9 1103 30 30 0.0086 0.011
10 1113 20 30 0.0129 0.05
11 1103 10 30 0.0043 0.001
12 1113 30 150 0.0043 0.037
13 1123 10 30 0.0086 0.056
14 1113 20 90 0.0086 0.069
15 1123 20 30 0.0129 0.088
16 1103 20 90 0.0043 0.003
17 1113 10 90 0.0129 0.119
18 1123 30 30 0.0086 0.057
19 1123 10 150 0.0129 0.255
20 1123 10 150 0.0043 0.068
21 1113 20 30 0.0043 0.009
22 1103 10 30 0.0129 0.018
23 1123 30 90 0.0043 0.051
24 1113 10 90 0.0043 0.02
25 1123 30 150 0.0086 0.17
[17]. Twenty-five experimental points were generated to obtain the response of the system under different com- binations of the four factors as shown in Table 2. The results of growth rate shown in the last column of the table are obtained from the CFD model mentioned above. The experimental design was studied using Design-Expert 11, a statistical software package. The data were analyzed by using analysis of variance (ANOVA). The validity of the model involved tests for significance of the regression model, coefficients and test for lack of fit are to insure the adequacy of the model.
4. Results and Discussion
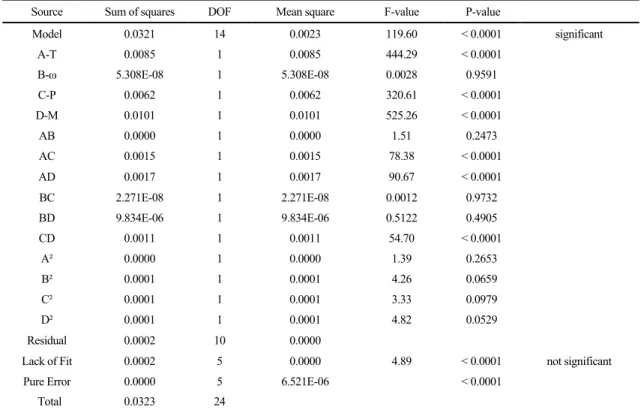
Analysis of variance results of the quadratic model for growth rate are shown in Table 3. The statistical tests p- value, F-value, R-squared, predicted R-squared, and adjusted R-squared were used to prove the goodness of fit of
the quadratic model. The model with probability value (P<0.05) is considered to be statistically significant [19]. In this case A, C, D, AC, AD, and CD are significant model terms. Values greater than 0.1 indicate the model terms are not significant. In order to ensure the best accuracy, the final formula of the regression model between factors and response includes all significant and insignificant terms. The coefficient determination, R-squared, is a measure of variability in the observed response values that can be explained by the experimental independent variables and their interactions. The R-squared value range between 0 and 1 and the model is considered very strong and with better predication of the response when R-squared is close or equal to 1[1 9]. A high R-squared value of 0.957 for this analysis implies that the regression model is significant and only 4.3% of the total variations is not explained by the model.
The predicted versus actual values for silicon deposition are
plotted in Fig. 2. The actual values were obtained from the
Zaher Ramadan, Dong Kuk Ko and Ik-Tae Im 118
Table 3. Analysis of variance (ANOVA) for silicon growth rate
Source Sum of squares DOF Mean square F-value P-value
Model 0.0321 14 0.0023 119.60 < 0.0001 significant
A-T 0.0085 1 0.0085 444.29 < 0.0001
B-ω 5.308E-08 1 5.308E-08 0.0028 0.9591
C-P 0.0062 1 0.0062 320.61 < 0.0001
D-M 0.0101 1 0.0101 525.26 < 0.0001
AB 0.0000 1 0.0000 1.51 0.2473
AC 0.0015 1 0.0015 78.38 < 0.0001
AD 0.0017 1 0.0017 90.67 < 0.0001
BC 2.271E-08 1 2.271E-08 0.0012 0.9732
BD 9.834E-06 1 9.834E-06 0.5122 0.4905
CD 0.0011 1 0.0011 54.70 < 0.0001
A² 0.0000 1 0.0000 1.39 0.2653
B² 0.0001 1 0.0001 4.26 0.0659
C² 0.0001 1 0.0001 3.33 0.0979
D² 0.0001 1 0.0001 4.82 0.0529
Residual 0.0002 10 0.0000
Lack of Fit 0.0002 5 0.0000 4.89 < 0.0001 not significant
Pure Error 0.0000 5 6.521E-06 < 0.0001
Total 0.0323 24
Fig. 2. Actual data versus predicted values of growth rate.
CFD model, and the predicted values were obtained from the regression model. The adjusted R-squared value (adj.R
2=0.985) is close to R-squared value, which is
additional indicator for the goodness of the model [20]. In addition, “adequate precision”, which compares the range of the predicted values at the design points to the average prediction error, is 48.78. A ratio greater than 4 is acceptable [20]. The lack of fit F-value of 4.89 implies the lack of fit is not significant relative to the pure error. Non-significant lack of fit is another indicator of the goodness of fit of the quadratic model. ANOVA analysis confirms a satisfactory adjustment of the reduced quadratic model to the experimental data.
Response equation in terms of actual factors can be used
to predict the response for given levels of each factor. In this
equation, the levels should be specified in the original units
for each factor.
Study on the Coupled Effects of Process Parameters on Silicon Growth Using Chemical Vapor Deposition 119
(a) Effect of temperature and rotation (b) Effect of rotation and DCS fraction
(c) Effect of pressure and DCS fraction (d) Effect of pressure and temperature
(e) Effect of pressure and rotation (f) Effect of temperature and DCS fraction Fig. 3. Response surface for silicon growth rate considering the coupled effects of operating conditions.
Three dimensional response surfaces plots are presented in Fig. 3 to show the effects of the four parameters and their interactions on silicon growth rate. These plots show the combined effect of the two factors on the response at a time while the other two factors are kept at a constant value. Fig.
3 (a) shows the interactive effects of temperature and
rotation speed of the wafer at operating pressure of 120 torr
and DCS mole fraction of 0.0068. The plot implies that the
rotation speed has no significant effect on the silicon
deposition growth rate. It can be seen that increasing the
rotation speed of wafer for a fixed temperature does not
have much effect on the growth rate value. In the other hand,
Zaher Ramadan, Dong Kuk Ko and Ik-Tae Im 120
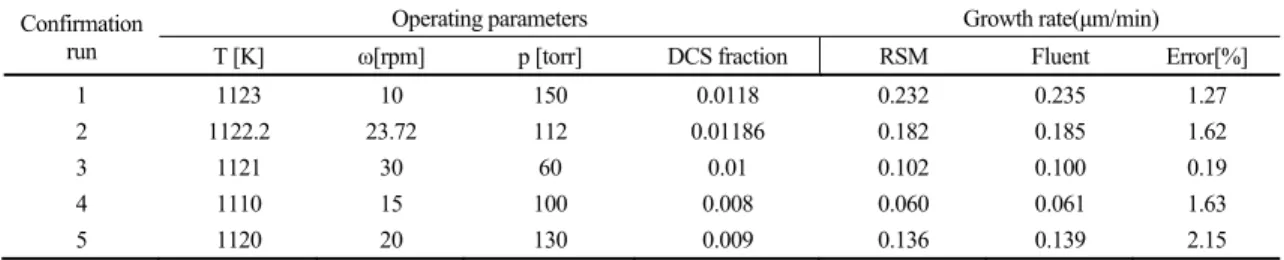
Table 4. RSM model validation results
Confirmationrun
Operating parameters Growth rate(μm/min)
T [K] ω[rpm] p [torr] DCS fraction RSM Fluent Error[%]
1 1123 10 150 0.0118 0.232 0.235 1.27
2 1122.2 23.72 112 0.01186 0.182 0.185 1.62
3 1121 30 60 0.01 0.102 0.100 0.19
4 1110 15 100 0.008 0.060 0.061 1.63
5 1120 20 130 0.009 0.136 0.139 2.15
temperature was found to have the greatest effect on silicon deposition. It can be noticed that the growth rate of silicon increased from around 0.04 (μm/min) to around 0.15 (μm/min) by increasing temperature from 1103 to 1123 K at rotation speed of 30 rpm. The combined effect of rotation speed and DCS mole fraction on silicon growth rate at suscepter temperature of 1110 K and operating pressure of 30 torr is depicted in Fig. 3 (b). It can be noticed that silicon growth rate is almost independent to the variation of wafer rotation speed. Also, the figure reveals that the mole fraction of DCS has a greater effect on the silicon deposition growth rate comparing to the rotation speed. The response surface plot illustrating the effect of DCS mole fraction and operating pressure on silicon growth rate at suscepter temperature of 1110 K and wafer rotation speed of 20 rpm is shown in Fig. 3 (c). It can be notices that DCS mole fraction and operating pressure have a significant effect on in- creasing the growth rate of silicon. Fig. 3 (d) shows the effect of operating pressure and susceptor temperature on the response at the DCS mole fraction of 0.008 and wafer rotation speed of 20 rpm. The plot reveals that the growth rate increases as both temperature and pressure increase.
The interaction of operation pressure and satellite rotation speed and their effect on silicon growth rate at suscepter temperature 1113 K of and DCS mole fraction of 0.0086 is shown in Fig. 3 (e). The resulting 3-D response surface emphases the unpronounced effect of the satellite rotation speed on the growth rate. Finally, the effect of satellite temperature and DCS mole fraction on silicon growth rate is depicted in Fig. 3 (f). The RSM plotted at operating pressure of 60 torr and wafer rotation speed of 20 rpm. It can be noted that the susceptor temperature is the key factor to increase the growth rate. It can also be noticed that the effect of DCS mole fraction becomes more significant at higher temperatures. Silicon growth rate at susceptor temperature
of 1123 K increases from around 0.02 (μm/min) to around 1.4 (μm/min) by increasing the DCS fraction from 0.0043 to 0.0129. In conclusion, among the four operating parameters that have been studied, the influences of sucepter tem- perature and operating pressure were the most significant factors that affect silicon deposition growth rate, followed by the mole fraction of DCS. The influence of the wafer rotation is the least.
The predicted mathematical model of silicon growth rate has already been validated through Analysis of variance in section 4. However, this conclusion is further supported through the confirmation runs. A set of five confirmation runs are performed and compared with the CFD results. The results of the confirmation runs are listed in Table 4. The validation tests show that the results of silicon deposition rate obtained from the regression model are in good agreement with those from CFD model and the maximum deviations is 2.15%.
5. Conclusion
In this study, the influence degree of four process parameters on silicon growth rate in planetary CVD reactor was predicted based on CFD simulation and respond surface methodology. Twenty-five experimental points were ge- nerated to obtain the response of the system under different combinations of the four process parameters chosen in this study. The data were validated using analysis of variance.
The influences of sucepter temperature and the operating
pressure were the most significant parameters, followed by
the mole fraction Of DCS. The influence of the wafer
rotation is the least. A set of five confirmation runs were
carried out to verify the accuracy of the RSM model. The
accuracy of the RSM model was found to be high and it can
be used to optimize the process parameters.
Study on the Coupled Effects of Process Parameters on Silicon Growth Using Chemical Vapor Deposition 121