Vibration-Based Monitoring of Stay-Cable Force Using Wireless Piezoelectric-Based Strain Sensor Nodes
Khac-Duy Nguyen* and Jeong-Tae Kim*
✝Abstract This study presents a method to monitor cable force using wireless sensor nodes and piezoelectric sensors. The following approaches are carried out to achieve the objective. Firstly, the principle of piezoelectric materials (e.g., PZT) as strain sensors is reviewed. A cable force estimation method using dynamic features of cables measured by piezoelectric materials is presented. Secondly, the design of an automated cable force monitoring system using the data acquisition sensor-node Imote2/SHM-DAQ is described. The sensor node is originally developed by University of Illinois at Urbana-Champaign and is adopted in this study to monitor strain-induced voltage from PZT sensors. The advantages of the system are cheap, and eligible for wireless communication and automated operation. Finally, the feasibility of the proposed monitoring system is evaluated on a lab-scaled cable.
Keywords: Cable Force, Monitoring, Wireless, PZT, Strain Sensor, Imote2, SHM-DAQ
[Received: November 2, 2012, Revised: December 3, 2012, Accepted: December 7, 2012] *Department of Ocean Engineering, Pukyong National University, Busan 608-737, Korea ✝Corresponding Author: [email protected]
ⓒ 2012, Korean Society for Nondestructive Testing
1. Introduction
Cable force is one of the critical components of cable structures such as cable-stayed bridges, suspension bridges. For those bridges, cable systems carry most of the loads of decks and transfer those loads to foundations through pylons. However, cables are very flexible components, and they are subjected to various repeated load conditions such as vehicle traffic, wind and temperature variation. As a result, stress relaxation in cables due to loosening of cable anchorages can be strongly occurred and that may lead to significant reduction of loading capacity of the structures. Therefore, monitoring cable force is very essential to ensure the operational safety of the cable-stayed structures.
For monitoring cable force, vibration-based techniques are widely used since these approaches are simple and reliable. Utilizing dynamic characteristics of vibrated cables, many methods of cable force estimation have been proposed and successfully evaluated not only on
small scale cables but also on full scale cables [1,2]. Recently, some researchers have extensively developed wireless sensor nodes for automated cable force monitoring [3]. However, most of them have used acceleration features of cables to estimate cable force. Only a few studies have considered strain responses of cables for cable force monitoring. Li et al. [4]
utilized optical fiber Bragg grating (FBG) strain sensors to monitor cable tension force based on a direct method. Ma and Wang [5] used dynamic strain of cables measured by FBG strain sensors or strain gauges for cable force monitoring.
However, the data acquisition systems associated with those kinds of sensors are expensive, complicated and heavy, which are not very suitable to apply to real structural cables.
Over the last decade, piezoelectric materials
have been widely adopted for SHM
applications [6]. The piezoelectric materials are
commonly used for active monitoring of critical
structural members[7-10]. Although the materials
are capable for strain sensing, they are rarely
used to measure strain responses of structures since they measures only dynamic component of strain. However, for vibration-based cable force estimation in which only dynamic parameters of cables are needed, piezoelectric materials can be used. One of the advantages of piezoelectric strain sensors is that the piezoelectric strain acquisition systems are very simple since they need to measure only voltage induced by strain of the sensors. Also, piezoelectric strain sensors do not need power supply, which is very beneficial for wireless sensor applications.
Additionally, PZT strain sensors are very cheap (about $1) compared with accelerometers (more than $10).
In this study, a new method to monitor cable force using wireless sensor nodes and PZT sensors is presented. The principle of piezoelectric materials (e.g., PZT) as strain sensor is first reviewed. A cable force estimation method using PZT dynamic strain responses is presented. Then the adoption of the data acquisition sensor-node Imote2/SHM-DAQ to monitor strain-induced voltage from PZT sensors is described. The advantages of the system are cheap, and eligible for wireless communication and automated operation. The feasibility of the proposed monitoring system is evaluated on a lab-scaled cable.
2. Cable Force Monitoring Using Piezoelectric Dynamic Strain Responses
2.1 Dynamic Strain of Cables Measured by Piezoelectric Sensors
The principle of piezoelectric materials (PZT) as strain sensors is shown in Fig. 1. As direct effect of the materials, an electrical displacement (related directly to electrical current) is induced since a mechanical stress (or strain) is applied to a piezoelectric sensor. The strain-charge relation for the piezoelectric material can be expressed as
follows[11]:
(1a)
(1b)
where D
3is the electric displacement;
is the dielectric constant of piezoelectric wafer; E
3is the applied external electric field in direction-3 at zero stress; d
31is the piezoelectric coupling constant;
is the stress in direction-1,
is the strain in direction-1,
is the Young's mudulus of the material at zero-electric field. If the PZT patch is surface-bonded on a host structure, the strain of the PZT patch can be expressed in terms of voltage measured from its terminals as:
(2)
where V is the output voltage across the terminals of the PZT patch; t
pis thickness of the PZT patch; k
pis the scale factor between strain and voltage which depends on the characteristics of the PZT patch.
In order to utilize Eq. (2), it is assumed that
only 1-D strain is contributed to the charge
generation and that there is no loss of strain in
the bond layer. Those assumptions are highly
satisfied for stay cables since their vibration
causes longitudinal strain induced by bending
(flexural strain) with large amplitudes. For a
stay cable, the PZT sensor can be embedded to
the cable body to measure strain of the cable as
shown in Fig. 2. The PZT sensor is bonded on
an aluminum tube which tightly covers the
cable. The aluminum tube is designed to
overcome the limitation in sensing capacity that
it is not allowed to bond PZT sensors directly
on real cables. Additionally, bonding condition
between the PZT sensors and cable surfaces
which are made of polyethylene (PE) is not well
maintained. By using the aluminum tube, the
accuracy of dynamic strain in the low frequency
(3)
Fig. 1 Direct piezoelectric effect
Fig. 2 Schematic of PZT-cable interaction
range, required in the vibration method, is not lost significantly. When the cable is vibrated in-plane, dynamic flexural strain of the cable can be expressed as:
where M is the bending moment of the cable caused by the cable vibration, EI is the flexural stiffness of the cable, v(x,t) is displacement of the cable in the direction perpendicular to length of the cable, and c is the distance of the PZT patch from the neutral axis of the cable. As shown in Fig. 2, when the cable is deformed, a voltage is generated due to the PZT’s strain. It is worth to note that, the PZT sensor also measure longitudinal modes of the cable.
However, the longitudinal modes have very high frequencies compared with the in-plane flexural modes.
2.2 Cable Force Estimation Method
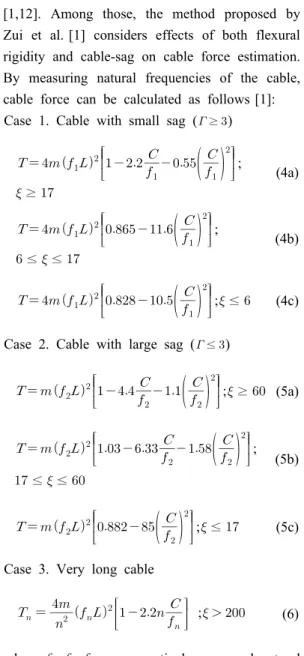
During the last decades, several methods have been proposed for the estimation of cable force by using natural frequencies of cables
[1,12]. Among those, the method proposed by Zui et al. [1] considers effects of both flexural rigidity and cable-sag on cable force estimation.
By measuring natural frequencies of the cable, cable force can be calculated as follows [1]:
Case 1. Cable with small sag (
≥ )
;
≥
(4a)
;
≤ ≤
(4b)
; ≤ (4c) Case 2. Cable with large sag (
≤ )
; ≥ (5a)
;
≤ ≤
(5b)
; ≤ (5c) Case 3. Very long cable
; (6)
where f
1, f
2, f
nare respectively measured natural frequencies corresponding to first, second and n
thmodes (
≥ );
;
;
cos ; EI is the flexural rigidity of cable; L is the span length of cable; m is the mass of cable per unit length; is sag-to-span ratio; and is inclination angle of cable. If cable tension is estimated using Eq. (6) for NM modes, the average value of cable tension is calculated as:
(7)
16-bit ADC/DSP 4-channel QF4A512
Imote2 Op.Amp OPA4344-4ch (Signal Cond. Circuit) Op.Amp
OPA344-1ch (Voltage divider)
Slide Switch 2P2T Analog Signal
-5~5V input 0~5V input
offset 0~5V
1.8V, 3.0V, 5.0V SPI
PZT
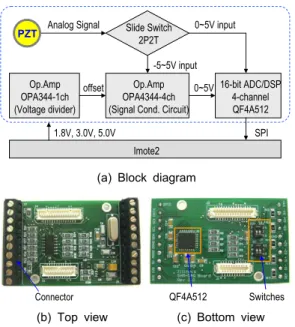
(a) Block diagram
Connector QF4A512 Switches
(b) Top view (c) Bottom view Fig. 3 Hardware design of SHM-DAQ board[17]
Imote2/SHM-DAQ Node UIUC ISHMP Toolsuite RemoteSensing Component
Vibration Data Acquisition
SSeL SHM tools PSD, Peak-Picking Cable Force Estimation
Leaf NodesGateway Node
Data Server
Fig. 4 Embedded software for Imote2/SHM-DAQ
3. Wireless Piezoelectric-Based Strain Sensor Node 3.1 Hardware Design
Recently, the interest on developing wireless smart sensor nodes for efficient SHM systems has been increasing. The advantages of wireless sensor systems over conventional cabling sensor systems have been discussed by many researchers [13-16]. Generally, the cost associated with the wired SHM systems can be greatly
reduced by the adoption of wireless sensor nodes. Furthermore, autonomous operation of the SHM systems is enabled by on-board com- putation integrated on the sensor nodes.
For piezoelectric strain measurement, the data acquisition board SHM-DAQ originally designed by University of Illinois at Urbana- Champaign, USA [17] is utilized. The block diagram of the data acquisition board is shown in Fig. 3(a). This board includes a signal conditioning circuit with a digital filter, QF4A512 ADC. The board has 4 channels for analog inputs according to the capability of the QF4A512 ADC. The available ranges of the input are 0~+5 VDC and -5~+5 VDC.
The preferred range can be selected by turning slide switches on the bottom side of the board. The components of the sensor board are shown in Fig. 3(b) and (c). According to voltage generated from PZT sensors, the switch of SHM-DAQ must be turn appropriately to catch the signal of -5 ~ +5 VDC.
The sensor board is operated on the Imote2 platform which is integrated with a low power, high speed X-scale processor, PXA27x, and a wireless radio, CC2420. It also has 256 kB of SRAM, 32 MB of external SDRAM, and 32 MB of program flash memory, which make the sensor node enabled for complicated operating softwares.
3.2 Software Design
The embedded software for the sensor node is programmed according to the UIUC ISHMP Toolsuite [18] and PKNU SSeL SHM Tools [16], as schematized in Fig. 4. For cable strain measurements, Remotesensing component from ISHMP Toolsuite is implemented. After finishing measuring, the strain signal is transformed to the power spectral density according to Bartlett's procedure as follows [19]:
(8)
6.4 m PZT 1.5 m Imote2/SHM-DAQ Impact
Cable
(a) Schematic of experimental setup
Cable
(b) Lab-scaled cable
Fig. 5 Experimental setup on lab-scaled cable
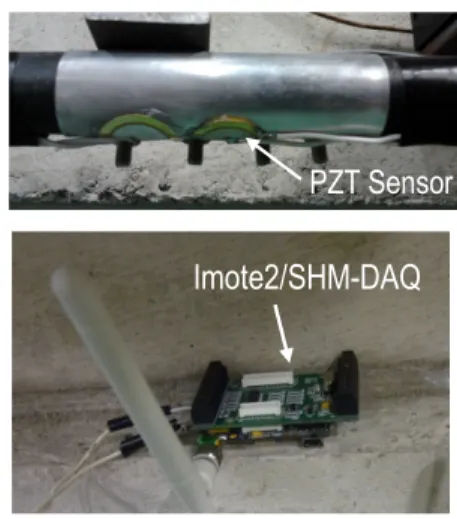
PZT Sensor Imote2/SHM-DAQ
Fig. 6 PZT dynamic strain system on cable
Table 1 Specifications of lab-scaled cable
Nominal diamter (mm) 15.2
Nominal area (mm2) 138.7
Tensile strength (kN) 260
Elastic modulus (kN/m2) 190
Unit mass (kg/m) 1.37
where X
iis the dynamic response transformed into the frequency domain (FFT transform); n
dis the number of divided segments in the time history response; and T is the data length of a divided segment. Here, a hanning window with the number of FFT of 2048 is used to calculate X
ifrom the time-history response.
Subsequently, natural frequencies are extract- ed by a peak-picking method. In this approach, the entire frequency range is divided into N equal sub-frequency ranges. The interval of each range is selected to be smaller than the reduced fundamental frequency of the cable which has 20% of the design cable tension.
The reduced fundamental frequency of the cable is calculated based on the string theory as:
, in which
is taken as 20% of the design cable tension. In each sub-frequency range, the natural frequency is recognized if its magnitude is the largest and at least ten times larger than the magnitude mean in that range.
Once natural frequencies are determined, the cable tension force is estimated. Firstly, the raw value of cable force (T
s) is calculated from the measured fundamental frequency (f
1) based on the string theory as:
. Secondly, values of
,
,
are determined using the tension force calculated in step 1. Note that the sag-to-span ratio is calculated as:
. Finally, the cable tension force is estimated using Eqs. (4)-(7) depending on the values of
,
,
calculated in step 2.
4. Lab-Test Evaluation
The feasibility of the monitoring system was evaluated on a lab-scaled cable model as shown in Fig. 5. The cable is comprised of 7 stainless steel ropes (1x7 strand cable). The length of the cable is 6.4 m. The specifications of the cable are given in Table 1. At 1.5 m from the cable end, a PZT sensor (FT-20T-3.6A1) was bonded
to the cable through an aluminum tube.
The PZT sensor was connected to an
Imote2/SHM-DAQ for strain monitoring as
shown in Fig. 6. Hammer impacts were applied
to the cable at the location of 2 m distanced
from the cable end. The measuring time was set
as 60 second with a sampling rate of 280 Hz.
0 10 20 30 40 50 60 -20
-10 0 10 20
Time (s)
Strain (μ)
(a) PZT dynamic strain
0 10 20 30 40 50 60
-1 -0.5 0 0.5 1
Time (s)
Acceleration (g)
(b) Acceleration
0 10 20 30 40 50 60 70
10-2 100 102 104 106
Frequency (Hz)
Power Spectral Density
(a) PZT dynamic strain
0 10 20 30 40 50 60 70
102 104 106 108
Frequency (Hz)
Power Spectral Density
(b) Acceleration
Fig. 7 Time history responses Fig. 8 Frequency responses of cable
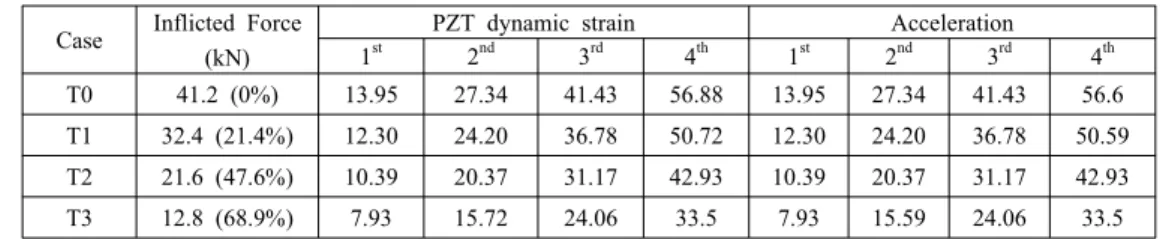
Table 2 Measured natural frequencies using PZT dynamic strain and acceleration
Case Inflicted Force (kN)
PZT dynamic strain Acceleration
1st 2nd 3rd 4th 1st 2nd 3rd 4th
T0 41.2 (0%) 13.95 27.34 41.43 56.88 13.95 27.34 41.43 56.6
T1 32.4 (21.4%) 12.30 24.20 36.78 50.72 12.30 24.20 36.78 50.59 T2 21.6 (47.6%) 10.39 20.37 31.17 42.93 10.39 20.37 31.17 42.93
T3 12.8 (68.9%) 7.93 15.72 24.06 33.5 7.93 15.59 24.06 33.5
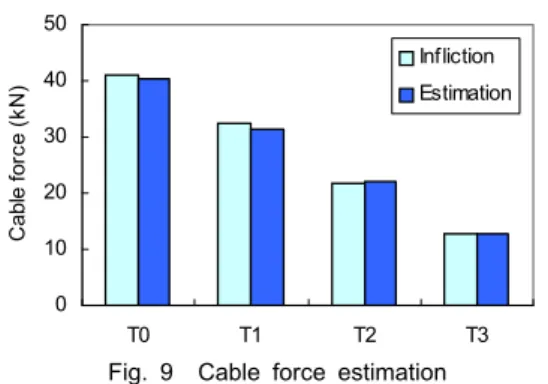
Table 3 Cable force monitoring results using PZT dynamic strain
Case Inflicted Force (kN)
Tension by string
theory (kN) Estimation
Force (kN) Error (%) Formula
T0 41.2 (0%) 43.68 2.46E-4 78.4 43.1 41.21 0.02 4a
T1 32.4 (21.4%) 33.96 3.16E-4 69.2 29.7 31.78 1.91 4a
T2 21.6 (47.6%) 24.23 4.44E-4 58.4 18.1 22.39 3.66 4a
T3 12.8 (68.9%) 14.12 7.62E-4 44.58 8.2 12.71 0.70 4a
For validation, acceleration responses of the cable were measured by an Imote2/SHM-A (developed by Rice et al. [20]) installed at the same position as the PZT sensor.
Axial prestress forces were introduced into the cable by a hydraulic jack as the cable were anchored at one end and pulled out at the other.
Four levels of cable force T0-T3 (i.e., 41.2 kN, 32.4 kN, 21.6 kN and 12.8 kN) were consequently applied to the cable, in which T0 is considered
as the design force. A load cell was installed at one of the cable anchorages to measure the applied tension forces. Each test was conducted after the desired tension force has been applied and the cable has been anchored.
Fig. 7 shows the dynamic strain and acceler- ation responses of the cable. The correspondent power spectral densities are shown in Fig. 8.
Sharp peaks indicating resonant responses of the
cable can be clearly seen from both the power
0 10 20 30 40 50
T0 T1 T2 T3
Cable force (kN)
Infliction Estimation
Fig. 9 Cable force estimation