J Korean Acad Community Health Nurs (지역사회간호학회지) https://doi.org/10.12799/jkachn.2020.31.S.549
Multilevel Analysis of Factors Associated with Perceived Good Health
and Multimorbidity among Older Adults:
Using the 2017 Community Health Survey
Boo, Sunjoo
1· Han, Young Ran
2· Choi, Hye Young
31Associate Professor, College of Nursing ․ Research Institute of Nursing Science, Ajou University, Suwon 2Professor, Department of Nursing, Dongguk University, Gyeongju
3Assistant Professor, Department of Nursing, Kangwon National University, Samcheok, Korea
Purpose: This study aimed to identify individual- and regional-level factors associated with perceived good health and
multimorbidity among older adults. Methods: Secondary analysis of the 2017 Korea Community Health Survey was conducted on a sample of 67,532 older adults. The individual level data set was combined with regional-level factors from the administrative data released on the Korea National Statistical Office website. Distribution of perceived good health and multimorbidity in 254 public health centers were calculated using sampling weights and presented as percentages. Multilevel logistic regression analyses were used to identify individual- and regional-level factors associated with perceived good health and multimorbidity. Results: Overall, 21.1% of subjects perceived their health to be good, ranging from 9.3% to 39.4% by region. The prevalence of multimorbidity was 15.9%, and varied between 6.6% and 22.6% by region. At the individual level, perceived good health was associated with men, younger age, higher educational levels, higher income levels, and those married and living with a partner and maintaining a healthy lifestyle. At the regional level, higher rates of health center personnel among public officials and higher levels of financial independence were associated with perceived good health. Multimorbidity was associated with marital status and healthy lifestyle, and higher rates of health center personnel among public officials. Conclusion: Regional factors such as health care personnel and local economy could affect population health. Our findings suggest the need to consider individual- and regional-level factors to promote good health among older adults and reduce the health gap by region.
Key Words: Aged; Health status; Multimorbidity; Population health; Social determinants of health
Corresponding author: Choi, Hye Young
Department of Nursing, Kangwon National University, 346 Hwangjo-gil, Dogye-eup, Samcheok 25949, Korea. Tel: +82-33-540-3363, Fax: +82-33-540-3363, E-mail: choihy3@kangwon.ac.kr
- This study was supported by the Korean Society for Preventive Medicine funded by a grant from the Korea Centers for Disease Control and Prevention Chronic Disease Control Research(ISSN 2733-5488).
Received: May 31, 2020 / Revised: Sep 11, 2020 / Accepted: Oct 5, 2020
This is an open access article distributed under the terms of the Creative Commons Attribution Non-Commercial License (http://creativecommons.org/licenses/ by-nc/3.0), which permits unrestricted non-commercial use, distribution, and reproduction in any medium, provided the original work is properly cited.
INTRODUCTION
1. Background
Whitehead [1] argued that health equity is emphasized because disadvantaged groups die at younger ages than more advantaged groups. There are large differences in disease experience, health and well-being between more and less advantaged groups Since such health inequities are unfair and unjust, it is necessary to find solutions to them by identifying causes. According to the Regional Health Gap Profile recently published by the Korean
Soci-ety for Equity in Health [2], the difference in life expect-ancy between the regions with the highest and lowest life expectancy is estimated to be 2.6 years. Moreover, even within the same region, the difference in life expectancy between the top 20% and lowest 20% income groups is re-ported to be up to 7.6 years [2]. The differences in health between individuals and between groups can be attrib-uted to various determinants of health which act together in complex ways. Dahlgren and Whitehead's model of social determinants of health addresses the relationship between the individual, their environment and health based on an ecological perspective [3]. The model has led to a growing
awareness that individual lifestyle factors, social and com-munity networks, living and working conditions, and so-cioeconomic, cultural and environmental conditions influ-ences on health [3]. Understanding the health determi-nants is helpful for facilitating development of policies and health promotion programs to reduce health dispari-ties. In other countries, various studies using this model have shown that mortality, morbidity, and perceived health status are related to regional-level characteristics [4]. How-ever, unfortunately, most studies in Korea have been fo-cused on individual-level factors such as income level and health behaviors [5-8], and there have been a limited num-ber of studies including regional-level health determinants. Meanwhile, the Commission on Social Determinants of Health (CSDH) of the World Health Organization (WHO) pointed out differences in accessibility to health resources due to disparities in socioeconomic resources as a major cause of health inequalities between countries and regions [9,10]. In other words, from this perspective, it is consid-ered essential to consider regional-level factors to improve health inequities because living environments and socio-economic and policy factors of local communities affect accessibility to health resources. Since the public sector can reduce or eliminate imbalances in health determinants by improving the physical environment and distributing health resources more uniformly through policies [8], it is necessary to examine differences in health status through multilevel analysis including regional-level factors. In part-icular, considering that older adults are more affected by the physical space and social networks of the local com-munity [11], it is very important to identify regional-level factors when assessing health status to narrow health gaps among older adults.
Since perceived health status can be relatively easily as-sessed and is closely related to morbidity and mortality [12], it has been steadily used to monitor the health status of population or to compare health status levels between countries. Recently, it has been used as an neighborhood environmental factors [13]. However, perceived health sta-tus is a subjective indicator and should be complemented with objective morbidity data by using them in conjunction with each other. According to the National Survey of Older Persons in Korea, 89.5% of older adults have one or more chronic diseases, and the prevalence of multimorbidity or the percentage of older adults with two or more chronic diseases is about 70% [14]. The Organization for Economic Cooperation and Development (OECD) referred to multi-morbidity as one of the major challenges which OECD countries will face in the future [15]. The multimorbidity of chronic diseases in old age causes various types of
dys-function and decreases the ability to perform activities of daily living (ADL), which leads to the deterioration of per-ceived health status and health-related quality of life [16], aggravating health inequities. In particular, hypertension and diabetes are chronic diseases that cause a high burden of medical costs, and they are not only major diseases tar-geted by disease management programs of local commun-ities [17] but also major causes of death [18]. However, there have been few studies to examine the prevalence of multimorbidity with both hypertension and diabetes and factors affecting the prevalence of multimorbidity. As a re-sult of a systematic review of 59 multilevel analysis studies including regional-level variables among studies published from 2000 to 2014 in the field of health care, it was found that 69.5% of the studies used 254 local districts such as si, gun, gu as analysis units, and 20.8% analyzed physical health outcomes including hypertension as main variables. However, there were no studies that examined multi-morbidity as a major variable. Regarding factors affecting physical health outcomes among regional-level character-istics, physical environmental characteristics such as green space accessibility were shown to be influencing factors in 14.7% of the previous studies, and public or private serv-ices such as the number of medical personnel and the budget for social welfare and health were reported as in-fluencing factors in 20% of the studies [19]. Since per-ceived health status and the prevalence of multimorbidity have been selected as health outcome indicators that are linked to health inequalities indicators of the National Health Plan 2020, it is necessary to identify factors influ-encing them by examining both individual- and region-al-level factors.
In order to apply the study results to health promotion programs for narrowing health gaps, it is necessary to ana-lyze data at the level of local districts, which are the ad-ministrative units for the establishment of public health centers, so this study was conducted using the data from the Community Health Survey (CHS), which has been conducted by the Korea Centers for Disease Control and Prevention, because the CHS data presents regional health statistics data at the levels of local districts [20]. For in-dividual-level factors of health determinants, demogra-phic characteristics and healthy lifestyle were included in the analysis. As for regional-level factors, physical living environment (park area and the number of fast food res-taurants), health and welfare services (the number of physicians and the percentage of public health center per-sonnel to public servants), financial independence, the percentage of the health and welfare budget to the general account of the government, and registration status as the
Healthy City were included because the factors were found to be associated with health indicators in previous studies [13,21,22]. Therefore, in order to provide basic data for the development of effective policies and strategies for narrowing health gaps, this study attempted to conduct a multilevel analysis to identify and present individual- and regional-level factors related to perceived and objective health status in older adults aged 65 and older by using CHS data and various other data on local communities, based on Dahlgren and Whitehead's model of health de-terminants [3].
2. Purpose
The aim of this study was to investigate health determi-nants affecting perceived good health and multimorbidity in older adults in terms of individual- and regional-level factors through multilevel analysis. The specific objectives of this study are as follows:
To identify regional gaps in perceived good health and multimorbidity in older adults aged 65 and older; To identify individual- and regional-level factors in-fluencing perceived good health and multimorbidity in older adults aged 65 and older.
METHODS
1. Study Design
This study is a secondary data analysis using the 2017 CHS raw data (https://chs.cdc.go.kr/chs/index.do) and regional statistics data publicly available online via the na-tional statistics portal of the Statistics Korea (http://kostat. go.kr). This cross-sectional study aims to identify the in-dividual- and regional-level factors related to perceived health status and multimorbidity in older adults aged 65 and older.
2. Data source and Participants
In this study, the 2017 CHS, which was the latest raw data publicly available at the time of data analysis, was used after receiving approval for the use of data for aca-demic research from the Centers for Disease Control and Prevention. The 2017 CHS was conducted from August to October 2017 among adults aged 19 or older with a total of 228,381 participants nationwide by surveying appro-cimately 900 people per public health center among the residents of the community served by each of 254 public health centers. The participants of this study were a total
of 67,532 older people aged 65 and older who completed the questionnaire of the 2017 CHS without missing data in the responses to the questionnaire items on perceived good health and multimorbidity, which were the main dependent variables of this study.
3. Measurement and Data Collection
The dependent variables of this study were perceived good health and multimorbidity. In the raw data, per-ceived health status was rated on a 5-point Likert scale (very good, good, fair, poor, and very poor), and in this study, when participants rated their health status as very good or good, their perceived health status was classified as good. Multimorbidity was defined as the case in which the respondent answered yes to each of the questionnaire items asking whether he or she was currently diagnosed with hypertension and diabetes.
Independent variables were classified into individual- level and regional-level variables. The analysis of indivi-dual-level variables was based on the responses regard-ing sociodemographic characteristics and the practice of healthy lifestyle habits included in the CHS raw data, and the analysis of regional-level variables was performed using regional statistical data publicly available via the homepage of the Statistics Korea. The demographic and sociological variables included age, gender, income, edu-cational level, and marital status. The practice of healthy lifestyle habits was defined as cases of satisfying all the cri-teria of smoking cessation, maintenance of regular ex-ercise habits, and eating habits of low-sodium diet pre-ferences. Specifically, regarding smoking cessation, based on the responses to the questions of "Have you smoked 100 or more cigarettes in your life?" and "Do you currently smoke?", nonsmokers were defined as individuals who smoked less than 100 cigarettes in the past and currently do not smoke. A regular exercise habit was defined as per-forming high-intensity physical activity for at least 20 mi-nutes a day for 3 days a week, moderate-intensity physical activity for at least 30 minutes a day for 5 days a week, or walking exercise for 30 minutes a day for at least 5 days a week by using the responses to the question about exercise time by exercise intensity performed continuously for at least 10 minutes in the last week. For low-sodium diet preference, when people answered that they usually ate less salty foods and did not add soy sauce or salt when eat-ing foods in response to the questions "Which of the fol-lowing statements most closely expresses your general eating habits?", "Do you add salt or soy sauce when eating food served on a table?", and "When you eat pan-fried
bat-tered foods, pancakes or fried foods, do you dip them in soy sauce?", the individuals were classified as the low-salt diet preference group. regional-level variables were based on the data of 2017, when the CHS was conducted, and they were classified into living and working conditions and so-cio-economic and environmental conditions. Among the sub-factors of living and working conditions, the physical environment factors included the park area per person and the number of fast food restaurants per 1,000 population, and factors related to health and welfare services included the number of doctors per 1,000 population and the per-centage of public health center personnel to public servants. Socioeconomic and environmental factors in-cluded the degree of financial independence, the percent-age of health and welfare budges in the general account, and the registration status as the Healthy City.
4. Ethical Considerations
The 2017 CHS raw data was exempt from IRB review in accordance with Paragraph 2 or Article 2 of the Bioethics and Biosafety Act, and the present study using the 2017 CHS raw data was granted exemption from IRB review by the IRB of the institution to which the investigator belongs (IRB No.: AJIRB-SBR-EXP-19-207).
5. Data Analysis
To account for the complex sampling design, sampling weights were applied, and weighted means or percen-tages were presented according to the guidelines for the use of the CHS raw data. Statistical analysis was conducted using the SAS 9.4 program and 254 municipalities includ-ing cities, counties, and districts were used as the analysis units. The level of statistical significance was set at .05. First, the percentage or average of individual-level variables of the participants was presented using Proc surveyfreq and Proc surveymeans, and the ranges of the average or ratio of individual-level variables by region were presented to identify the distributions of individual-level variables in 254 municipalities. x2 test was used to examine the differences
in perceived good health status and the prevalence of mul-timorbidity according to individual-level variable. Second, the characteristics of regional-level variables for each of the 254 municipalities were presented using descriptive sta-tistics, and correlation analysis was carried out to identify the relationships between regional-level variables and de-pendent variables in this study. Third, in order to present a visual schematic representation of the distributions of per-ceived good health and the prevalence of multimorbidity
by region, the statistical geographic information service of the Statistics Korea was used to represent the distributions in the form of a diagram. In addition, the top five and bot-tom five municipalities in terms of the percentage of peo-ple with perceived good health and the prevalence of mul-timorbidity were presented. Finally, in order to identify individual- and regional-level factors influencing per-ceived good health and the prevalence of multimorbidity, multilevel logistic regression analysis was performed us-ing the SAS Glimmix Procedure with individual- and re-gional-level variables identified as statistically significant variables at the significance level of .05 in the preceding univariate analysis. First of all, in order to confirm the ne-cessity for multilevel analysis, the null model analysis was carried out to determine whether the regional variance at the local districts level was significant, and the intraclass correlation (ICC) value, which represents the proportion of the variance at the group level relative to the total var-iance of the dependent variable, was calculated. In gen-eral, the ICC value of 0.05 or greater is considered to in-dicate that there is a variation between regions, but even when it is below 0.05, a multilevel analysis can be per-formed if there are empirical research results on the varia-tion between regions [23]. The ICC value for the depend-ent variable in this study was less than 0.05, but the null model was significant, and there were research results on the regional variations in perceived health status and the prevalence of multimorbidity [11,24]. Therefore, a multi-level analysis was performed to estimate the effects. Multicollinearity was examined through correlation anal-ysis between independent variables before conducting multilevel logistic regression analysis.
RESULTS
1. The Characteristics of Individual-Level Variables and
Differences in Perceived Good Health and the
Preva-lence of Multimorbidity according to Individual-Level
Variables
Table 1 shows the characteristics of individual-level var-iables of participants of this study and their distributions by si/gun/gu for a total of 254 local districts. The ages of participants ranged from 70.76 to 76.82 years, with a mean age of 74.33 years. With respect to the characteristics of main dependent variables of this study, the average per-centage of people who rated their health as good was 21.1%, and the percentage of people with perceived good health varied from 9.3 to 39.4% among regions. In the total participants, the prevalence of hypertension was 54.6%,
Table 1. Characteristics of Subjects (N=67,532)
Individual level variables n†(%) or M±SD Range by region (% or Mean)
Age (year) 65~74 ≥75 74.33±6.44 36,300 (58.6) 31,232 (41.4) 70.76~76.82 42.9~76.5 23.5~57.1 Female 39,650 (56.0) 48.0~65.5
Monthly income (<3 million won) 58,110 (78.6) 38.3~97.8
Educational level (<high school) 53,859 (70.6) 12.5~94.7
Married & living together 42,557 (65.4) 48.5~77.0
Healthy lifestyle (yes) Current smoking (yes) Low salt diet preference (yes) Regular activity (yes)
25,305 (40.9) 5,970 (9.1) 55,185 (82.3) 33,526 (53.7) 13.7~69.7 2.6~16.3 47.5~98.9 22.9~80.4
Perceived good health 12,840 (21.1) 9.3~39.4
Multimorbidity (yes) Hypertension (yes) Diabetes (yes) 10,273 (15.9) 37,040 (54.6) 14,523 (22.7) 6.6~22.6 41.3~68.5 13.7~32.9 † Unweighted value.
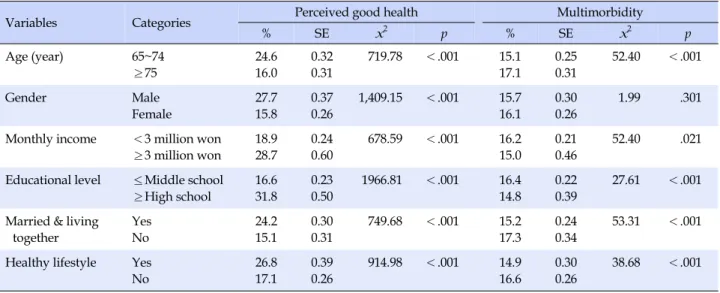
Table 2. Perceived Good Health and Multimorbidity by Subjects' Characteristics (N=67,532)
Variables Categories Perceived good health Multimorbidity
% SE x2 p % SE x2 p Age (year) 65~74 ≥75 24.6 16.0 0.32 0.31 719.78 <.001 15.1 17.1 0.25 0.31 52.40 <.001 Gender Male Female 27.7 15.8 0.37 0.26 1,409.15 <.001 15.7 16.1 0.30 0.26 1.99 .301
Monthly income <3 million won ≥3 million won 18.9 28.7 0.24 0.60 678.59 <.001 16.2 15.0 0.21 0.46 52.40 .021 Educational level ≤Middle school
≥High school 16.6 31.8 0.23 0.50 1966.81 <.001 16.4 14.8 0.22 0.39 27.61 <.001 Married & living
together Yes No 24.2 15.1 0.30 0.31 749.68 <.001 15.2 17.3 0.24 0.34 53.31 <.001 Healthy lifestyle Yes
No 26.8 17.1 0.39 0.26 914.98 <.001 14.9 16.6 0.30 0.26 38.68 <.001 SE=standard error.
and the prevalence of diabetes was 22.7%. The prevalence of multimorbidity having both hypertension and diabetes was 15.9%, varying from 6.6% to 22.6% by regions.
With respect to the differences in perceived good health according to the characteristics of individual-level varia-bles, there were significant differences according to age, gender, income level, educational level, marital status, and the practice of healthy lifestyle habits (Table 2). Specifi-cally, the percentage of perceived good health was statisti-cally significantly higher in the young old group, men, the higher income group, the group with higher educational levels, the married group (living with the spouse), and the
group of people practicing healthy lifestyle habits. On the other hand, the prevalence of multimorbidity was statisti-cally significantly lower in the young old group, the higher income group and the group with higher educational lev-els, the married group (living with the spouse), and the healthy lifestyle practice group.
2. Characteristics of Regional-level Variables and
Rela-tions of Regional-level Variables with Perceived Good
Health and the Prevalence of Multimorbidity by Region
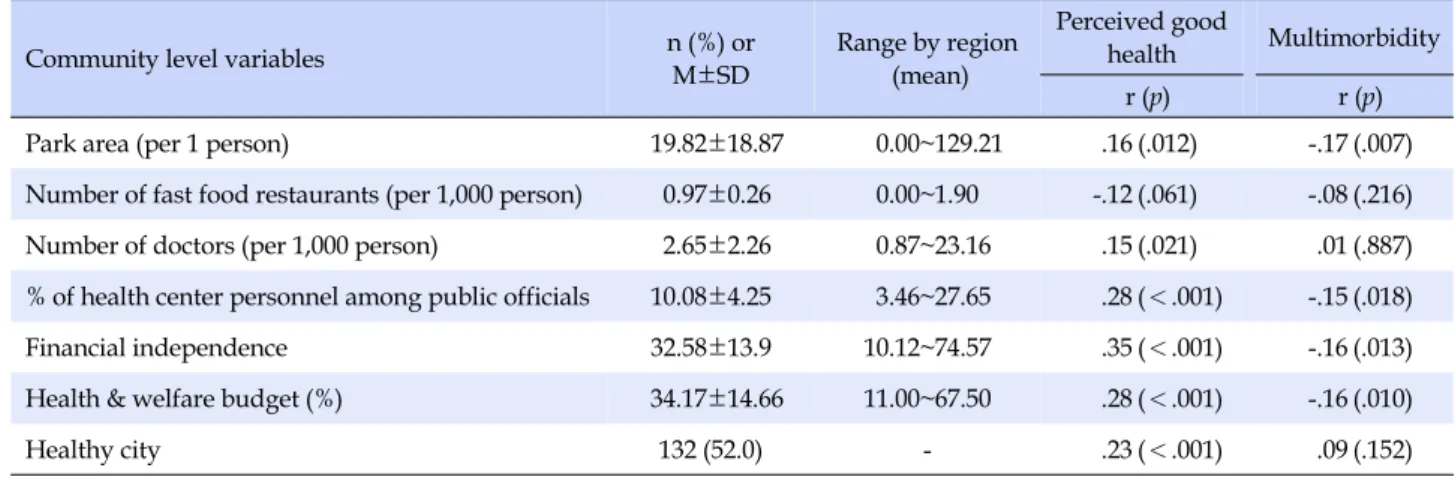
varia-Table 3. Correlations between Dependent Variables (Perceived Good health & Multimorbidity) and Community-level Variables (N=254) Community level variables n (%) or M±SD Range by region(mean)
Perceived good
health Multimorbidity r (p) r (p)
Park area (per 1 person) 19.82±18.87 0.00~129.21 .16 (.012) -.17 (.007)
Number of fast food restaurants (per 1,000 person) 0.97±0.26 0.00~1.90 -.12 (.061) -.08 (.216) Number of doctors (per 1,000 person) 2.65±2.26 0.87~23.16 .15 (.021) .01 (.887) % of health center personnel among public officials 10.08±4.25 3.46~27.65 .28 (<.001) -.15 (.018)
Financial independence 32.58±13.9 10.12~74.57 .35 (<.001) -.16 (.013)
Health & welfare budget (%) 34.17±14.66 11.00~67.50 .28 (<.001) -.16 (.010)
Healthy city 132 (52.0) - .23 (<.001) .09 (.152)
bles and the correlations between regional-level variables and perceived good health and between them and the prevalence of multimorbidity by region. Perceived good health was statistically significantly associated with a larg-er park area, a highlarg-er numblarg-er of doctors, a highlarg-er plarg-ercent- percent-age of public health center personnel to public servants, a higher level of financial independence, a higher percent-age of health & welfare budgets in the general account, and registration as the Healthy City. A lower prevalence rate of multimorbidity was statistically significantly corre-lated with a larger park area, a higher percentage of public health center personnel to public servants, a higher level of financial independence, and a higher percentage of health & welfare budgets.
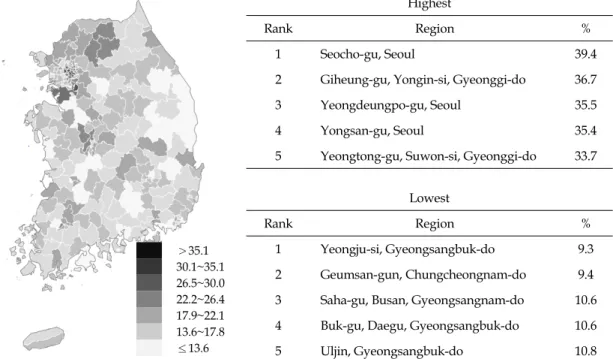
3. Regional Distributions of Perceived Good Health and
the Prevalence of Multimorbidity
The distributions of perceived good health and the pre-valence of multimorbidity by region are shown in Figure 1. In the map, a darker color indicates a higher level of per-ceived good health and a higher prevalence rate of multi-morbidity. In 2017, the average percentage of people who perceived their health status as good among the total resi-dents of each local districts was 21.1%, with a gap of up to 20.1%p between regions. Among all the local districts, Seo-cho-gu, Seoul, showed the highest percentage of people with perceived good health at 39.4%, and Yeongju-si, Gyeongsangbuk-do showed the lowest percentage at 9.3%. The average prevalence of multimorbidity was 15.9%. The prevalence of multimorbidity was the highest at 22.6% in Uiwang-si, Gyeonggi-do, and the lowest at 6.6% in Yeongdo- gu, Busan, showing a gap of up to 16.0%p between regions.
4. Multilevel Influencing Factors for Perceived Good
Health and the Prevalence of Multimorbidity
In this study, the null model, the model of individual- level factors (Model 1), and the model of individual- and regional-level factors (Model 2) were sequentially verified to identify individual- and regional-level factors affecting perceived good health and the prevalence of multi-morbidity (Table 4). The null model is used to estimate the variance between regions for the dependent variable with-out entering independent variables to examine whether there is a difference between regions. In this study, in the null model for perceived good health and the prevalence of multimorbidity, the regional-level variance were stat-istically significant with variance levels of 0.08 (SE=0.01,
p<.001) and 0.02 (SE=0.01, p<.001), respectively, so the
regional differences in perceived good health and the prevalence of multimorbidity were confirmed. In Model 1 and Model 2, multilevel analysis was performed using in-dividual- and regional-level variables that were identified as significant variables in Tables 2 and 3 as independent variables.
First, the results of a multilevel analysis on perceived good health showed that age, gender, educational level, marital status and the practice of healthy lifestyle habits at the individual level and the percentage of public health center personnel to public servants and financial in-dependence at the regional level were identified as statisti-cally significant influencing factors for perceived good health in older adults (Table 4). More specifically, in older adults, as age was increased by one year, the likelihood of perceived good health was decreased by 3% (OR=0.97). Older women were 43% less likely to perceive their health as good compared to older men (OR= 0.57). Older adults
>35.1 30.1~35.1 26.5~30.0 22.2~26.4 17.9~22.1 13.6~17.8 ≤13.6 Highest Rank Region % 1 Seocho-gu, Seoul 39.4
2 Giheung-gu, Yongin-si, Gyeonggi-do 36.7
3 Yeongdeungpo-gu, Seoul 35.5
4 Yongsan-gu, Seoul 35.4
5 Yeongtong-gu, Suwon-si, Gyeonggi-do 33.7 Lowest
Rank Region %
1 Yeongju-si, Gyeongsangbuk-do 9.3
2 Geumsan-gun, Chungcheongnam-do 9.4 3 Saha-gu, Busan, Gyeongsangnam-do 10.6 4 Buk-gu, Daegu, Gyeongsangbuk-do 10.6
5 Uljin, Gyeongsangbuk-do 10.8
Figure 1-A. Regional distribution of perceived good health.
>20.3 18.0~20.3 15.7~17.9 13.5~15.6 11.2~13.4 9.0~11.1 ≤8.9 Highest Rank Region % 1 Uiwang-si, Gyeonggi-do 22.6
2 Danwon-gu, Ansan, Gyeonggi-do 22.5
3 Changwon, Gyeongsangnam-do 22.4
4 Buk-gu, Gwangju, Jeollanam-do 22.4
5 Yeongdeungpo-gu, Seoul 22.1
Lowest
Rank Region %
1 Yeongdo-gu, Busan, Gyeongsangnam-do 6.6
2 Dongducheon-si, Gyeonggi-do 8.7
3 Damyang County, Jeollanam-do 8.9
4 Seongju County, Gyeongsangbuk-do 9.2
5 Hampyeong-gun, Jeollanam-do 9.3
Figure 1-B. Regional distribution of multimorbidity.
Figure 1. Regional distribution of perceived good health and multimorbidity. with an educational level of high school or above are 1.68
times more likely to perceive their health as good than those with a lower educational level (OR=1.68), and the likelihood of perceived good health was 1.42 times higher in older adults with the monthly income of 3 million won or
more than those with the monthly income of less than 3 million won (OR=1.42). The likelihood of perceived good health was 1.06 times higher in older adults who were mar-ried and living with the spouse than those who were not (OR=1.06), and it was also 1.45 times higher in older adults
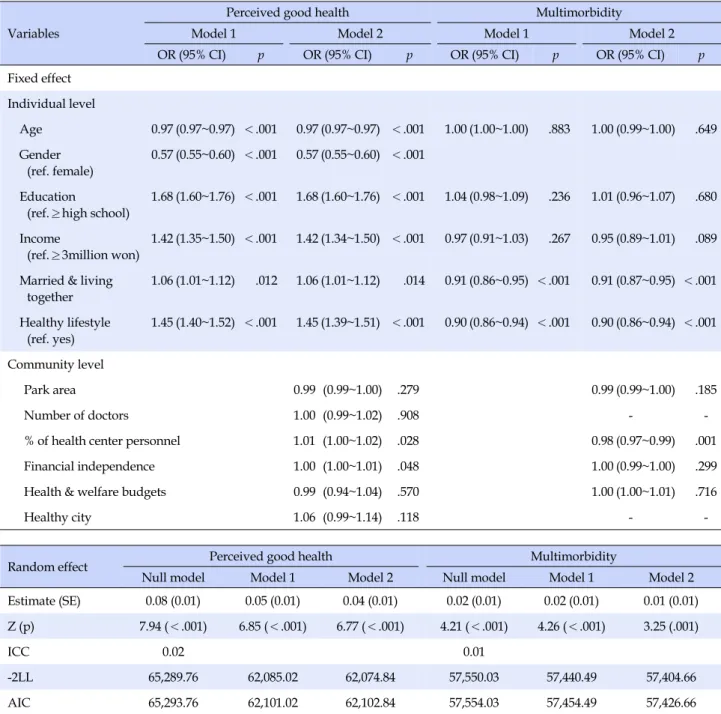
Table 4. Factors Affecting Perceived Good Health and Multimorbidity (N=67,532) Variables
Perceived good health Multimorbidity
Model 1 Model 2 Model 1 Model 2
OR (95% CI) p OR (95% CI) p OR (95% CI) p OR (95% CI) p
Fixed effect Individual level Age 0.97 (0.97~0.97) <.001 0.97 (0.97~0.97) <.001 1.00 (1.00~1.00) .883 1.00 (0.99~1.00) .649 Gender (ref. female) 0.57 (0.55~0.60) <.001 0.57 (0.55~0.60) <.001 Education (ref.≥high school) 1.68 (1.60~1.76) <.001 1.68 (1.60~1.76) <.001 1.04 (0.98~1.09) .236 1.01 (0.96~1.07) .680 Income (ref.≥3million won) 1.42 (1.35~1.50) <.001 1.42 (1.34~1.50) <.001 0.97 (0.91~1.03) .267 0.95 (0.89~1.01) .089 Married & living
together 1.06 (1.01~1.12) .012 1.06 (1.01~1.12) .014 0.91 (0.86~0.95) <.001 0.91 (0.87~0.95) <.001 Healthy lifestyle (ref. yes) 1.45 (1.40~1.52) <.001 1.45 (1.39~1.51) <.001 0.90 (0.86~0.94) <.001 0.90 (0.86~0.94) <.001 Community level Park area 0.99 (0.99~1.00) .279 0.99 (0.99~1.00) .185 Number of doctors 1.00 (0.99~1.02) .908 -
-% of health center personnel 1.01 (1.00~1.02) .028 0.98 (0.97~0.99) .001
Financial independence 1.00 (1.00~1.01) .048 1.00 (0.99~1.00) .299
Health & welfare budgets 0.99 (0.94~1.04) .570 1.00 (1.00~1.01) .716
Healthy city 1.06 (0.99~1.14) .118 -
-Random effect Perceived good health Multimorbidity
Null model Model 1 Model 2 Null model Model 1 Model 2
Estimate (SE) 0.08 (0.01) 0.05 (0.01) 0.04 (0.01) 0.02 (0.01) 0.02 (0.01) 0.01 (0.01) Z (p) 7.94 (<.001) 6.85 (<.001) 6.77 (<.001) 4.21 (<.001) 4.26 (<.001) 3.25 (.001)
ICC 0.02 0.01
-2LL 65,289.76 62,085.02 62,074.84 57,550.03 57,440.49 57,404.66
AIC 65,293.76 62,101.02 62,102.84 57,554.03 57,454.49 57,426.66
OR=odds ratio; 95% CI=95% confidence interval; ICC=Intraclass correlation; -2LL=-2 Log Likelihood; AIC=Akaike Information Criterion.
who practiced healthy lifestyle habits than those who did not (OR=1.45). In addition, as the percentage of public health center personnel to public servants (OR=1.01) and financial independence (OR=1.00) were increased, the likelihood of perceived good health in older adults was in-creased. After considering the fixed effects of individual- level and regional-level factors, the regional-level variance for perceived good health was a statistically significant (SE=0.01, p<.001).
Next, the results of multilevel analysis on the
preva-lence of multimorbidity showed that marital status and the practice of healthy lifestyle habits at the individual lev-el, and the percentage of public servants to public servants at the regional level were statistically significant factors in-fluencing the prevalence of multimorbidity. More specifi-cally, the likelihood of multimorbidity was 9% lower in older adults who were married and living with their spouse than those who were not (OR=0.91), and the like-lihood of multimorbidity was 10% lower in older adults who practiced healthy lifestyle habits than those who did
not (OR=0.90). In addition, for every 1% increase in the percentage of public health center personnel to public ser-vants, the likelihood of prevalence of multimorbidity was decreased by 2%(OR=0.98). After considering the fixed ef-fects of individual-level and regional-level factors on the prevalence of multimorbidity, the regional-level variance for multimorbidity was found to be statistically significant (SE=0.01, p=.001).
DISCUSSION
The analysis results of this study showed that there were differences in perceived good health and the preva-lence of multimorbidity in older adults among 254 local districts and that individual-level and regional-level vari-ables were found to have an impact on these differences. First, regarding regional gaps in perceived good health, in 2017, the average percentage of people with perceived good health was 21.1%, and there was a large gap of up to 20.1%p between regions. In relation to the percentage of people with perceived good health, all of the top 5 regions were identified as districts with high socioeconomic levels in Seoul and the metropolitan area in Gyeonggi-do, but all of the bottom 5 regions were located outside the metropoli-tan area and they consisted of one district in Daegu and in Busan, two in Gyeongsangbuk-do and one in Chungcheong-nam-do. The gaps between urban and rural areas before industrialization were converted into the polarization phenomenon in which the health gap widened depending on whether or not regions were located in the metropoli-tan area after industrialization [25]. Similar to the results of the study, a previous study reported that the health score calculated by adding the perceived health status, de-pression, and ADL/IADL was significantly higher in old-er adults living in the metropolitan area than those living in other regions [25]. These results are related to the cen-tralization of resources in the metropolitan area and the characteristics of the polarization phenomenon of Korea centered on Seocho-gu and Gangnam-gu even within the metropolitan area [26], and they can be interpreted as a pat-tern of health inequalities among older adults arising from regional differences in social and physical environments. Therefore, it is necessary not only to take measures for spe-cific vulnerable groups but also to strengthen the capacity of vulnerable regions in terms of health.
In this study, the percentage of patients with multi-morbidity who were diagnosed with both hypertension and diabetes was 15.9%, showing a maximum gap of 16%p. According to the data from the 2017 National Survey of Older Persons, 89.5% of older adults (mean age: 74.1 years)
had chronic diseases, and 73% of them were patients with multimorbidity diagnosed with two or more chronic dis-eases. Regarding regional differences in multimorbidity, it was reported that the prevalence of multimorbidity was slightly higher in older adults living in Eups and Myeons (74.1%) than those living in Dongs (72.5%), but no further analysis was presented [14], and the polarization phenom-enon depending on the inclusion or non-inclusion in the metropolitan area shown in the analysis of perceived good health was not particularly pronounced, implying that perceived health status is more sensitive to regional-level variables than multimorbidity. This interpretation is sup-ported by the fact that the regional variance of perceived good health was found to be greater than that of the preva-lence of multimorbidity in this study. In addition, with re-spect to the fact that the percentage of people with muti-morbidity was lower in this study than in the 2017 survey data, this can be attributed to the fact that while the 2017 survey included arthritis, hyperlipidemia, and low back pain [14], only the percentage of older adults with hyper-tension and diabetes was calculated in this study. Accord-ing to a report published by the Health Insurance Review and Assessment Service, the prevalence of multimorbidity in older adults aged 65 or older with chronic diseases was found to be 70.9%. Based on the results, the report sug-gested that it is necessary to avoid the current commun-ity-based chronic disease management system focused on patients with a single disease and adopt new strategies and approaches for the management of multimorbidity of chronic diseases [27].
Among individual-level factors, age, gender, educational level, income, marital status, and healthy lifestyle habits were identified as significant influencing factors for per-ceived good health in older adults. Among the region-al-level factors, financial independence and the percent-age of public health center personnel to public servants were found to be significant factors. Regarding previous literature on socioeconomic factors influencing perceived good health in older adults, income, educational level, and spouse support were emphasized as major influencing factors in meta-analysis [28], multilevel analysis [11], and a study which examined only individual-level factors [25]. In addition, among demographic variables, gender and age have also been reported to be significant [11,25]. The life expectancy is reported to be higher by 6.1 years in old-er women than in oldold-er men, and oldold-er women who live alone after divorce or bereavement can be placed in sit-uations of overall vulnerability leading to financial diffi-culty as well as a high level of stress caused by the loss of the spouse, so the expansion of support for older women
living alone is being strongly emphasized [16,28]. It is also worth noting that the results of this study showed that the percentage of people with perceived good health was low-er by 43%p in oldlow-er women than in oldlow-er men. In addition, in terms of education level, the likelihood of perceived good health was 1.68 times higher in older adults with the educational level of high school or above than those with the educational level of middle school or below, indicating a large gap according to educational level. Those with low educational levels can experience difficulties in self-care due to a lower level of health literacy needed to acquire and apply health information, and it has been explained as a fundamental factor causing health inequalities since it can cause low-income and employment problems [29]. In this respect, more consideration and attention should be given to the health status of older adults with low educa-tional levels.
In this study, the practice of healthy lifestyle habits, in-cluding non-smoking, regular exercise, and low-sodium diet preference, was also found to be an important influ-encing factor which can improve perceived health status in older adults. Among health behaviors, smoking, nu-trition, and exercise are important factors that determine the level of perceived health status and they are of great significance in that although they are affected by the social structure and socio-economic factors, they are changeable enough to be improved [5]. In particular, health behaviors such as smoking cessation were reported to have an effect on perceived health, depression, and functional level [25]. Among health behaviors, smoking cessation has been found to be a major factor influencing perceived health sta-tus in men and exercise and stress management have been shown to be major influencing factors in women [6]. In this study, since a review of previous literature on the health status level and drinking in the population revealed con-flicting results [21], controlled drinking drinking was ex-cluded from healthy lifestyle habits, but it is thought that differentiated approaches considering gender and com-prehensive examination of the influencing factors includ-ing drinkinclud-ing are required for the health promotion of com-munity-dwelling older adults.
Financial independence and the percentage of public health center personnel to public servants were found to have a significant impact on perceived good health in old-er adults. Since thold-ere wold-ere no previous studies directly re-lated to these findings, it was not possible to make a direct comparison with the results of other studies, but financial independence was reported to be a major influencing fac-tor for the mortality rate in population groups [21] and subjective stress [8]. Therefore, it was shown that not only
individual-level factors but also the economic level of the local community also plays a major role in improving ceived health status in older adults. In this study, the per-centage of public health center personnel to public serv-ants was derived as a significant regional-level factor in-fluencing not only perceived good health but also the prevalence of multimorbidity in older adults. The health care manpower is a key element that determines the qual-ity of public health services, and is regarded as the basis for service delivery and the improvement of the health sta-tus level in older adults. Therefore, efforts of local govern-ments for quality management of them along with the in-crease of health care manpower are required. On the other hand, the number of physicians was previously reported to have a significant correlation with the mortality rate in the community [21], but the results of multilevel analysis in this study indicated that the number of physicians has no statistically significant impact on perceived good health in older adults. This finding is presumed to be due to the fact that multilevel analysis was conducted after control-ling for economic status, which is the main cause of the non-use of medical services in older adults. Thus, there is a need to conduct further research including qualitative re-search from a multifaceted and integrated perspective.
In addition, in this study, the results of multilevel analy-sis indicated that the percentage of health and welfare budgets has no statistically significantly effect on perceived good health in community-dwelling older adults. On the other hand, accessibility to major facilities in the commun-ity has been shown to have a significant effect on percei-ved good health in the total local residents [13], and a neg-ative correlation between the mortality rate in the commu-nity and the number of welfare facilities has been reported [21]. Since the percentage of health and welfare budgets included in this study cannot be regarded as a concept identical to accessibility to major facilities or the number of welfare facilities, it is suggested that the number and ac-cessibility of health and welfare facilities should be in-cluded as input variables in future studies on perceived good health in older adults.
Regarding individual-level factors that had a significant influence on the prevalence of multimorbidity in older adults, the prevalence of multimorbidity was lower in the married group living with the spouse and the group of people who practiced healthy lifestyle habits. As for re-gional-level factors, a higher percentage of public health center personnel to public servants was correlated with a lower prevalence of multimorbidity. In the case of hyper-tension and diabetes, not only medication administration but also the management of lifestyle habits plays a
sig-nificant role in the prevention of diseases and complica-tions, and especially living with the spouse provides the spouse's support for the management of chronic diseases. It is not possible to make a simple comparison due to the lack of multilevel studies on the factors affecting multi-morbidity involving high blood pressure and diabetes, but a study of the 2011~2012 Canadian CHS data reported that a low income level, insufficient intakes of vegetables and fruits, smoking, and a high level of stress were correlated with the prevalence of multimorbidity of three or more chronic diseases in older adults [24], and these findings are partially in agreement with this study. In Korea, a pre-vious analysis of the 2010 CHS data showed that the pres-ence of the spouse, the number of days of walking, and practice of dietary guidelines were significantly related to the prevalence of at least one chronic disease [8]. The study was conducted with adults aged 19 or over, and although it is difficult to make a simple comparison between the study population with older adults, the findings of this study is consistent with the study in that healthy lifestyle habits and living with the spouse have a positive effect on multimorbidity. Multimorbidity is a disease that can en-hance the therapeutic effects only when medical treatment is accompanied by the patient's own active participation, so it is important to monitor whether patients perform healthy behaviors and it is necessary to help them to grad-ually develop self-care ability to perform health behaviors on their own [30]. The spouse of the patient can contribute to fulfilling these roles. It is thought that since the family environment can motivate health behaviors, living togeth-er with a spouse has a positive effect on chronic disease management and thus can slow the progression of a chro-nic disease to multimorbidity in case of older adults with one chronic disease. Healthy lifestyle habits were shown to be a factor affecting both perceived good health and the prevalence of multimorbidity, and thus they need to be further emphasized as an important intervention strategy in the management of multimorbidity of chronic diseases in the future.
Among the regional-level variables, only the percent-age of public health center personnel to public servants was found to have an effect on the prevalence of multi-morbidity. The percentage of public health center person-nel to public servants is thought to reflect the degrees of in-terest and investment of local governments in the health of residents, and study findings about regional-level varia-bles can be partially attributed to the fact that public health center personnel are in charge of programs for the preven-tion and management of high blood pressure and high blood glucose. In addition, among the regional-level
vari-ables, the number of physicians who are in charge of treat-ment was shown to have no significant impact on multimor-bidity, but the percentage of public health center personnel to public servants had a significant effect. These findings suggest that healthy lifestyle habits have a greater influence on the prevalence of multimorbidity than treatment.
As a result of a systematic analysis of 59 multilevel anal-ysis studies including regional-level variables in the field of health care from 2000 to 2014, it was found that among the regional-level characteristics affecting physical health outcomes, physical environmental characteristics ac-counted for 14.7%, and public and private services (the number of health care manpower, social welfare and health budget, welfare budget ratio, etc.) accounted for 20% [19], which were consistent with the results of the present study. With respect to foreign related studies, ex-cept 2 studies out of 25 multilevel analysis studies on the neighborhood socio-economic context and health out-comes, most previous studies reported a statistically sig-nificant association between at least one social environ-mental variable and health outcome after adjusting the so-cio-economic status at the individual level. Therefore, it was suggested that an innovative approach should be ap-plied for regional-level interventions by paying more at-tention to public health in order to reduce health risks re-lated to the social structure and ecology of neighborhoods [4]. On the other hand, the Healthy Cities Project [29], in which is the project to encourage local governments to or-ganize and coordinate related projects of various depart-ments in consideration of health determinants in terms of the establishment and implementation of policies, was found to have no significant impact on perceived good health and multimorbidity, and other regional-level varia-bles had no significant effects. These results suggest that further research is needed to conduct an in-depth analysis including valid and reliable regional-level variables.
In Korea, there have few studies on health status that re-flect regional characteristics, which has been attributed to the fact that Korea has less regional diversities and sig-nificant effects of regional characteristics have not been found, unlike Western countries. This is explained by the fact that the Korean society is based on characteristics such as rapid propagation spread between regions due to high population density, frequent residential relocations, short residence periods, commuting to workplaces in other dis-tricts, and development of life through other communities [26]. However, since older adults are often dependent on the activities in their residential space and the network types in the local community, dependence on the com-munity and the influence of the comcom-munity among older
adults have been reported to be higher than in other groups [11], so local communities play an important role in improving the health of older adults and alleviating the gap among them. Therefore, the study of multilevel analy-sis focusing on the health of older adults is considered to have significance. In particular, measures to improve ex-planatory power should be devised through a sufficient literature review on regional-level variables that are high-ly correlated with variables associated with the health of older adults. As regional-level factors are emphasized with respect to the health of older adults, it is important for each local government to organize and coordinate region-al programs in consideration of the ecologicregion-al environ-ment, residential and working environments, and human networks in addition to health care services [29].
In this study, in relation to the improvement of health equity, health gaps between regions were identified focus-ing on perceived good health and multimorbidity in older adults, and factors affecting health inequalities were iden-tified through a multilevel analysis of individual-level and regional-level factors. Thus, the findings of this study are expected to contribute to presenting directions of roles of local communities as well as directions of effective inter-ventions to promote healthy lifestyle habits and improve health status centered on the elderly population. In addi-tion, another important implication of this study is that factors influencing health inequalities among older adults were identified through a multilevel analysis encompass-ing individual- and regional-level factors by usencompass-ing the CHS data and national statistical data together reflecting the current situations of local communities.
However, this study was a descriptive study through a secondary data analysis, so the results of this study have limitations in clearly explaining causal relationships be-tween variables related to perceived health status and the prevalence of multimorbidity and this study was con-strained by limitations on securing and identifying vari-ous regional-level variables. Moreover, most previvari-ous stu-dies only analyzed individual-level factors, there have been very few previous studies on the multilevel analysis including regional-level factors, and regional-level varia-bles used were different among studies. Consequently, there were many limitations in securing and comparing a sufficient number of previous studies focused on the re-gional variables and research topics of this study. There-fore, in future studies, it is necessary to find methods for increasing explanatory power by additionally identifying regional-level variables that are highly correlated with health variables among older adults through a literature review and including them in the multilevel analysis.
CONCLUSION
In this study, investigation of health gaps in perceived good health and the prevalence of multimorbidity in older adults revealed that there were significant health gaps be-tween regions, and some individual- and regional-level factors were found to have a significant effect on health gaps. With respect to factors influencing perceived good health, among individual-level variables, age, gender, ed-ucational level, income, marital status, and healthy life-style habits were found to be significantly associated with perceived good health. Among regional-level variables, fi-nancial independence and the percentage of public health center personnel to public servants were identified as sig-nificant variables affecting perceived good health. As for factors influencing multimorbidity, marital status and healthy lifestyle habits were identified as individual-level variables which have a significant impact on multimor-bidity, and the percentage of public health center person-nel to public servants was analyzed as a significant region-al variable affecting multimorbidity. Living region-alone without the spouse and not practicing health lifestyle habits in terms of individual-level variables and a lower percentage of public health center personnel to public servants among regional-level variables were associated with a lower level of perceived health status and a higher prevalence of mul-timorbidity. Also, these factors were shown to act in a complex way, creating health gaps among local districts in older adults. In particular, healthy lifestyle habits and the percentage of public health center personnel to public ser-vants are changeable through interventions, so each local government needs to consider the expansion of public health services, including additional recruitment of public health center personnel and changing its policies into health-friendly policies. In addition, public health centers, which play a key role in the health management of resi-dents of each region, need to further expand and reinforce effective health programs for promoting healthy lifestyle habits and managing chronic diseases, taking into account the coresidents of older adults, and also need to continu-ously monitor health behaviors, perceived health status, the prevalence of multimorbidity in older adults in order to play a pivotal role in improving health status and health inequalities in older adults. Considering the characteristics of older adults who show a high degree of dependence on the community and are influenced by the community to a greater extent compared to other populations groups, fur-ther research is required to conduct repeated multilevel analysis including regional-level variables that are highly correlated with major health variables in older adults.
REFERENCES
1. Whitehead M. The concepts and principles of equity and health. InternationalJournal of Health Services. 1991;22(3):429-445. https://doi.org/10.2190/986l-lhq6-2vte-yrrn
2. The Korean Society for Equity in Health. Regional health gap pro-file [Internet]. Seoul: The Korean Society for Equity in Health. 2018 [cited 2019 March 02]. Available from:
http://www.healthequity.or.kr/bbs/zboard.php?id=pds_the sis
3. Dahlgren G, Whitehead M. Policies and strategies to promote social equity in health. Background document to WHO-Strategy paper for Europe. Stockholm: Institute for Futures Studies; 2007. 67 p.
4. Agurs-Collins T, Persky S, Paskett ED, Barkin SL, Meissner HI, Nansel TR, et al. Designing and assessing multilevel inter-ventions to improve minority health and reduce health dis-parities. American Journal of Public Health. 2019;109(S1): S86-S93. https://doi.org/10.2105/ajph.2018.304730
5. Kim H. Implication of health behaviors in socioeconomic health inequalities and policy directions. Health and Welfare Policy Forum. 2009;149(4):36-47.
6. Kim M, Chung W, Lim S, Yoon S, LeeJ, Kim E, et al. Socio-economic inequity in self-rated health status and contribution of health behavioral factors in Korea.Journal of Preventive Medicine and Public Health. 2010;43(1):50-61.
https://doi.org/10.3961/jpmph.2010.43.1.50
7. KimJH. The relationship among socioeconomic status, health behavior, and self-rated health status in employees: Gender difference. KoreanJournal of Health Education and Promo-tion. 2011;28(1):57-67.
8. LeeJ. The regional health inequity, and individual and neigh-borhood level health determinants. Health and Social Welfare Review. 2016;36(2):345-384.
9. Marmot M, AllenJJ. Social determinants of health equity. 2014, American Journal of Public Health. 2014;104(Suppl 4):S517- S519. https://doi.org/10.2105/AJPH.2014.302200
10. World Health Organization. A conceptual framework for action on the social determinants of health[Internet]. Geneva: WHO Press. 2010 [cited 2019 February 26]. Available from: https://www.who.int/sdhconference/resources/Conceptual frameworkforactiononSDH_eng.pdf?ua=1.
11. Kim YH, Cho YT. Impact of area characteristics on the health of vulnerable populations in Seoul. KoreaJournal of Population Studies. 2008;31(1):5-30.
12. GuimarãesJMN, Chor D, Werneck GL, Carvalho MS, Coeli CM, Lopes CS, et al. Association between self-rated health and mortality: 10 years follow-up to the Pró-Saúde cohort study. BMC Public Health. 2012.12:676;1-10.
https://doi.org/10.1186%2F1471-2458-12-676
13. Lee K. Effects of neighborhood environment on residents' sub-jective health-A case study of Changwon.Journal of the Korea Academia-Industrial cooperation Society. 2013;14(8):4019-4027.
https://doi.org/10.5762/KAIS.2013.14.8.4019
14. Jeong KH, Oh YH, Kang EN, Kim GR, Lee YG, Oh MA, et al. 2017 Elderly survey. Policy Report. Sejong: Ministry of Health and Welfare, Korea Institute for Health and Social Affairs; 2017 November. Report No.: 11-1352000-000672-12.
15. Organization for Economic Cooperation and Development. Health reform: Meeting the challenge of ageing and multiple morbidities. Paris: OECD iLibrary; 2011. 224 p.
16. Kim YB, Lee SH. Effects of the elderly's health statuses, health behavior, and social relations on their health-related quality of Life: Focusing on family types.Journal of Korean Academy of Community Health Nursing. 2018;29(3):310-321.
https://doi.org/10.12799/jkachn.2018.29.3.310
17. Ministry of Health and Welfare & Chronic Disease Manage-ment Demonstration Team in Primary Medical care. Guideline for chronic disease management demonstration program in primary medical care. Sejong: Ministry of Health and Welfare, & Seoul: Chronic Disease Management Demonstration Team in Primary Medical care; 2019 December. Report No.: 11- 1352000-002362-10.
18. Statistics Korea. 2018 Cause of death statistics [Internet]. Daejeon: Statistics Korea. 2019 [cited 2020 August 22]. Available from: http://www.index.go.kr/potal/main/EachDtlPageDetail.do ?idx_cd=1012
19. Shin SS, Shin YJ, Woo KS. A systematic review of studies on public health using multilevel analysis: Focused on research trends and the assessment of risk of bias. Health and Social Welfare Review. 2015;35(4):157-189.
20. Korea Center for Disease Control & Prevention. Community Health Survey [Internet]. Osong-eup: Korea Centers for Dis-ease Control and Prevention. 2019 [cited 2019 March 02]. Available from: https://chs.cdc.go.kr/chs/index.do
21. Park E. A comparison of community health status by region and an investigation of related factors using community health indicators.Journal of Korean Academic Community Health Nursing. 2012;23(1):31-39.
22. Heuvel Wim JA van den, Olaroiu M. How important are health care expenditures for life expectancy? A comparative, European analysis.Journal of the American Medical Directors Association. 2017;18(3):276.e9-276.e12.
https://doi.org/10.1016/j.jamda.2016.11.027
23. Heck R, Thomas S. An introduction to multilevel modeling techniques. 2nd ed. NewYork, NY: Routledge; 2009. 280 p. 24. Roberts KC, Rao DP, Bennett TL, Loukine L, Jayaraman GC.
Prevalence and patterns of chronic disease multimorbidity and associated determinants in Canada. Health Promotion and Chronic Disease Prevention in Canada: Research, Policy
and Practice. 2015;35(6):87-94.
https://doi.org/10.24095/hpcdp.35.6.01
25. Lee YJ. Elderly healthy level of regional disparities compare. TheJournal of the Korea Contents Association. 2015;15(11): 347-358. https://doi.org/10.5392/JKCA.2015.15.11.347 26. Jung SW, Cho YT. Neighborhood characteristics and
in-dividual health under Korean Context.Journal of Preventive Medicine and Public Health. 2005;8(3):259-266.
27. Jeong YH. Analysis of multimorbidity in the elderly: focusing on outpatient. National Policy Agenda in Health & Welfare 2013. Research Report. Sejong: Korea Institute for Health and Social Affairs; 2013 December. Report No.: 2013-05.
28. Rhee OJ. Meta-analysis of the factors related to self-rated health among elderly-Focused on psychological dispositions, social- economic status. TheJournal of the Korea Contents Associ-ation. 2017;17(4):424-433.
https://doi.org/10.5392/JKCA.2017.17.04.424
29. Park SW, Jang SR,Jeong YH. Policy direction for improving health inequality 2018. Research Report. Seoul: Korea Health Promotion Institute; 2018 March. Report No.: 2018-01B-004. 30. Kim GH. Frailty, perceived health status and self-management
behaviors of older south Korean adults with multimorbidity using a senior center [dissertation]. [Seoul]: Seoul National University; 2015. 99 p.