Corresponding author: Kyung Jae Cha
Department of Field Application Scientist Team, Shinyang Chemical Co.,Ltd., 14 Bongeunsa-ro 43 gil, Gangnam-gu, Seoul 06103, Korea
E-mail: [email protected]
ORCID: https://orcid.org/0000-0003-2708-2811 ORIGINAL ARTICLE
Analysis of a Comparability Test between LX Detergent
Cleaning Solution and OC Detergent Cleaning Solution
Using OC Sensor PLEDIA
Kyung Jae Cha
Department of Field Application Scientist Team, Shinyang Chemical Co.,Ltd., Seoul, Korea
OC Sensor PLEDIA를 이용한 LX Detergent Cleaning
Solution과 OC Detergent Cleaning Solution의 동등성 평가
차경재
신양화학약품(주) 학술팀
ARTICLE INFO ABSTRACT
Received November 17, 2020 Revised 1st January 7, 2021 Revised 2nd January 22, 2021 Revised 3rd January 25, 2021 Accepted February 1, 2021
This study aimed at comparing the performance of imported LX detergent cleaning solution (LX-CS) and the self-manufactured OC cleaning solution (OC-CS), based on functional and quantitative analysis. The functional analysis was carried out using apparent diffusion coefficient (ADC) values. For quantitative analysis, precision, linearity, and carry-over rates were measured with commercial control materials according to the Clinical and Laboratory Standards Institute (CLSI) guidelines. Using OC-Sensor PLEDIA (Eiken Chemical, Japan), the ADC value of all cuvettes satisfied the acceptance criteria. For quantitative analysis, precision was less than 5.0% for the two products, and carry-over rates were less than ±1.00%. The linearity slopes and r2 values were 1.0017 and 0.9982 in the LX-CS, and 0.9924 and 0.9996 in the OC-CS, respectively. The correlation coefficient (r) was found to be 0.9997. Also, the percent difference in correlation with 40 artificial-stool specimens was less than 10% and the p-value was less than 0.1. The result of standard deviation ratio (D: ±1 SD ratio) was similar for both products. In conclusion, the functional and quantitative analyses of the two products were compared and showed similar results. In the future, the self-manufactured OC-CS will be able to provide a much more stable and faster supply than the imported LX-CS.
Copyright Ⓒ 2021 The Korean Society for Clinical Laboratory Science. All rights reserved.
Key words
Fecal occult blood test LX detergent cleaning solution Precision
INTRODUCTION
In modern society, cancer incidence and mortality continue to rise due to the aging population, and the incidence of colorectal cancer in Koreans is signi-ficantly increasing due to westernized diet. In 2014,
colorectal cancer ranked 3rd among all the cancers. In Korea, colorectal cancer has been included in the targets of the national cancer screening project since 2004, and according to the colorectal cancer screening program recommendations, a fecal occult blood test (FOBT) should be performed every year or two in asymptomatic adults aged 45 to 80 as a colorectal cancer screening test [1]. In the case of colorectal cancer, since the stage when the cancer is diagnosed is an important factor that affects the survival rate, thus Korean Society for
Clinical Laboratory Science
colorectal cancer screening test plays a huge role in the early detection and elimination of cancer [2].
There are qualitative and quantitative methods of the fecal occult blood test. In the chemical method (Guaiac method), the colorimetric reaction with pseudoperoxidase of hemoglobin is used, so it has the advantage of being inexpensive and easy to use. However, it has a high frequency of false positives and false negatives, and dietary restrictions need to be imposed, and its sensitivity and specificity are so low that even upper gastrointestinal bleeding is shown as positive. Thus, it can increase the false-positive rate in colorectal cancer screening [3]. For this reason, the guaiac method is inappropriate for use in the national cancer screening program because dietary restrictions and medication intake are required before diagnostic testing. In the fecal immunological test (FIT method), a globin antigen of human hemoglobin and a reaction of a single or polyclonal antibody to it were used to enhance the sensitivity and specificity of the test [4]. There are other methods: immunochromatography assay (ICA), a qualitative method using an aggregation method, and a quantitative method using a turbidity measurement method or a colorimetric method. Compared to chemical methods, immunological qualitative methods are easier to use for screening colorectal cancer because they have no restrictions on diet or me-dications, and only detect lower gastrointestinal bleeding. Therefore, immunological tests are used more often in the national cancer screening program [5, 6].
Recently, more than 10 types of the fully automated quantitative analyzer for the fecal occult blood test have been introduced to diagnostic laboratory medicine departments in Korea [7]. The OC Sensor Series diagnostic analyzer, which has a high domestic market share of external quality control standards managed by external quality assessment agencies in Korea, is widely used as a fecal blood screening test for early diagnosis of colorectal cancer. The OC Sensor PLEDIA is divided into the main body for detecting occult blood in feces, data management system (DMS),
main reagent, buffer solution, and other consumables [8]. Currently, the main reagents used in the OC sensor series are measured with immunoturbidimetry (IT) at 660 nm using polyethylene latex particles, and the buffer solutions are to maintain an appropriate pH and to facilitate antigen-antibody binding. Besides, the consumable cleaning solutions are used for analyzer instrument maintenance and cleaning and removal of contaminants in flexible plastic nozzle tubing. The purpose of this study sought to compare the perform functional and quantitative analysis of the imported LX detergent cleaning solution (LX-CS) and the self- manufactured detergent for rapid product supply and stable storage through localization of cleaning solution of the OC sensor series.
MATERIALS AND METHODS
1. Sample collection and preparation
For evaluation, OC DIANA Latex reagents, buffer solutions, quality controls, and calibrators were used for OC Sensor PLEDIA. The imported LX-CS and self-manufactured OC-CS were verified in the same method and volume under the same condition.
The artificial-stool specimens used in the current work were sampled by homogeneously mixing the surface of the specimen using a sampling bottle, which was dipped in 5∼6 places, and inspected after collection. The substance in the sampling bottle corresponds to artificial-stool specimens of about 10 mg and it was strongly shaken so that it was enough homogeneously suspended in 2 mL buffer solution. After being left at room temperature, it was subjected to the test. The pre-processed sampling bottle was mounted on the specific rack and an automated analyzer produces the inspection results. And then, the main reagent and the internal quality control substance were sufficiently warmed to room temperature and tested, and calibration was conducted based on the criteria appropriate to the conditions. The reference value was 100 ng/mL, which was equivalent to 20 μg of
Table 1. Work standard for artificial-stool manufacturing
Raw material powder NOC buffer
Materials Proportion (%) Materials Concentration
Bean flour 15 DW 10 L
Weak flour 10.5 HEPES 20 mM
Strong flour 22 NaCl 0.90%
Sucrose 22 CyDTA 1.0 mM
Hb 30.5 NaN3 0.10%
Total 100 BSA 0.10%
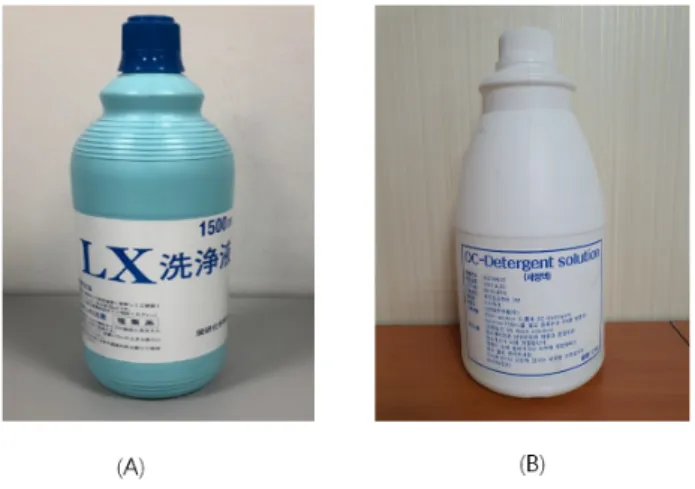
4N NaOH Adjusted to pH 7.0 Figure 1. The appearance of evaluation products.
hemoglobin in 1 g of feces. The analytical measurable range (AMR) of OC sensor PLEDIA was 50∼1000 ng/mL, and if over 1000 ng/mL, it was recorded as over-range (OR).
2. Preparation of artificial-stools
Artificial-stools was a substance that replaces the patient’s feces and was prepared by dividing the basic raw material powder and NOC buffer. The base raw powder was prepared by mixing bean flour, weak flour, strong flour, and sucrose. The hemoglobin (Hb) powder (Sigma Aldrich, Korea) was accurately weighed and mixed after dissolved in the NOC buffer solution. The NOC buffer solution used in this study was prepared as fresh as possible with distilled water, HEPES, NaCl,
CyDTA, NaN3, BSA, and its pH is adjusted to 7.0 using 4N
NaOH. After repeatedly measuring the prepared artificial-stools, they were prepared for each concen-tration and replaced with the evaluation materials (Table 1).
3. Preparation of products
The imported LX-CS using LC-MS (Liquid Chro-matography-Mass Spectrometry) contained 5∼6% of sodium hypochlorite (NaClO) and 0.5∼0.8% of sodium hydroxide (NaOH) as a result of component analysis. The component analysis of the self-manufactured OC-CS showed that it contained 5∼6% sodium hypochlorite (5.5% on average NaClO) and 0.5∼0.8% sodium hydroxide (0.6% on average NaOH). Moreover, the cleaning solutions as other consumables were
evaluated in consideration of the functional evaluation of the cuvettes, probes, and tubing wash cleaning power. And then, the quantitative evaluation that may affect precision, cross-contamination rate (carry-over rate), correlation coefficient, and linearity analysis was performed (Figure 1).
4. Functional evaluation procedure and criteria
With the imported LX-CS was loaded, ADC value (Analog Digital Convert; calculated as the amount of change in absorbance) was measured through the cell blank check. And after the imported LX-CS was replaced by the self-manufactured OC-CS under the same conditions, ADC value was measured through the cell blank check. For the 55th cell, ADC mean value is calculated using ADC value measured during the time between dispensing of purified water with the 3rd nozzle and absorbing of purified water with the 4th nozzle (four-cycle), and ADC mean value is used as the reference value [9]. The evaluation criteria for 55 cuvettes and 3 probe wash and tubing cleaning were based on −500∼+500 ADC value range specified in the Service Part Manual (Eiken chemical, Japan). However, in this study, to reflect the clear cleaning power of semi-disposal acryl cuvettes, ±200% difference was accepted when ADC value was less than 10, and ±100% difference was accepted when ABS value was 10 or more. This was to evaluate by applying more strictly the
criteria [10].
Reference value=ADC mean value=Four-cycle accumulation of ADC values÷4 cycles --- Equation (1)
Cell blank value=Log10 (Reference value÷ADC
average)×10,000 --- Equation (2)
5. Quantitative evaluation procedures and criterion 1) Precision analysis
Precision was estimated using low (level 1) and high concentration (level 2) of OC quality control materials (Lot 8X010) for OC sensor PLEDIA. The acceptable range was 122 to 175 ng/mL (mean 149 ng/mL) for low concentration level 1 for quality control and 386 to 522 ng/mL (mean 454 ng/mL) for high concentration level 2. The quality control material was stored in refri-geration (2∼8°C) before use.
Precision was evaluated for repeatability, between runs, and between days, intermediate data. Also, the results were determined by analyzing five runs per day with duplicates for each concentration daily for five days, and a total of 25 times was performed. Precision was evaluated according to the method specified in the Clinical and Laboratory Standards Institute (CLSI) EP05-A3 [11]. The acceptable coefficient of variation (%CV) was <5.0%.
2) Linearity analysis
The five levels of standard materials for each concentration were manufactured using the calibrator material and diluent for OC sensor PLEDIA. The standard material was evaluated for linearity at the highest concentration of 1000 ng/mL, the quantitative limitation of OC sensor PLEDIA. And then diluted with a buffer solution, so that the specimen-to-buffer ratio can be respectively 4:0, 3:1, 2:2, 1:3, 0:4 for 5 levels of concentration (0.0, 250.0, 500.0, 750.0, 1000.0 ng/mL) according to CLSI EP06-A2 [12]. After each treatment with the imported LX-CS and the self-manufactured OC-CS, the standard materials were measured in duplicate. The correlation coefficient and regression
line were calculated between the expected value on the X-axis and the measured value on the Y-axis. The criterion were % difference <±10% and % recovery <±10% [13].
3) Carry-over analysis
Once per week for 5 weeks, carry-over rate was determined by low (level 1) and high concentration (level 2) of OC quality control materials (Lot 8X010) for OC sensor PLEDIA replaced high-concentration and low-concentration of patient specimens. After the high concentration, OC control level 2 (H1, H2, H3, H4) were measured four times, and the low concentration OC control level 1 (L1, L2, L3, L4) were also measured four times in a row. Carry-over rate was calculated by [L1-(L3+L4)/2]/[(H2+H3)/ 2-(L3+L4)]×100 [14], and the result was considered acceptable if the rate was <±1.0%.
4) Correlation analysis
After preparing 7 normal samples and 33 abnormal samples of various concentrations, they were homo-geneously pre-treated using a sampling bottle under the same conditions as the test method performed by the inspector during the collection process. And then they were measured after standing at room tem-perature. According to CLSI EP09-A3 [15], they were treated with the imported LX-CS and the self- manufactured OC-CS to analyze the correlation. A total of 40 artificial-stools of various concentrations were prepared in the analytical measurement range of 50 to 1000 ng/mL, and the results were estimated for 5 runs per day to obtain averages. In the case of more than 1000 ng/mL, it was considered as 1000 ng/mL, and a linear regression graph with the correlation coefficient(r) was calculated. And then, the P-values through t-test, the mean differences, the percent difference [% difference=Difference/(mean1+mean2)/2×100], and the difference: standard deviation ratio (D: ±1 SD ratio) were obtained.
Tabl e 2. A DC val ue c om pari so n of LX dete rgen t cl eani ng s ol ut io n and O C de terge nt cl eani ng sol uti on th ro ugh ce ll bl ank che ck for 10 day s (uni t: A DC val ue) Cel l No . 1 day 2 day 3 da y 4 d ay 5 day 6 da y LX -CS (A D C ) OC-C S (A D C ) Di ff Di ff (% ) LX-CS (ADC ) OC-C S (A D C ) Di ff Di ff (% ) LX-CS (A DC ) OC-C S (A DC ) Di ff Di ff (% ) LX -CS (A D C ) OC-C S (A D C ) Di ff Di ff (% ) LX -CS (A D C ) OC-C S (A DC ) Di ff Di ff (% ) LX -CS (A D C ) OC-C S (A DC ) Di ff Di ff (% ) 15 1 55 − 4 − 7 4 8 47 1 2 515 0 1 2 485 2 − 4 − 85 8 5 3 − 5 − 96 2 62 0 0 2 71 62 9 15 62 67 − 5 − 7 72 63 9 14 68 72 − 4 − 66 4 6 4 0 0 74 74 0 0 35 1 49 2 4 4 9 50 − 1 − 2 525 0 2 4 505 1 − 1 − 25 0 4 8 − 2 − 45 7 57 0 0 4 49 42 7 1 7 5 7 43 14 33 49 58 − 9 − 16 44 51 − 7 − 14 46 3 5 − 11 − 3 1 41 38 3 8 53 2 30 2 7 3 0 33 − 3 − 9 323 2 0 0 343 2 2 6 33 3 1 − 2 − 64 1 40 1 3 63 5 33 2 6 3 3 35 − 2 − 6 353 4 1 3 363 5 1 3 35 3 3 − 2 − 64 6 45 1 2 77 1 71 0 0 7 1 81 − 10 − 1 2 70 72 − 2 − 3 81 72 9 13 73 69 − 4 − 67 4 72 2 3 82 8 26 2 8 2 7 28 − 1 − 4 292 9 0 0 292 9 0 0 30 2 8 − 2 − 73 8 37 1 3 95 9 63 − 4 − 6 5 6 53 3 6 595 7 2 4 536 0 − 7 − 12 67 6 1 − 6 − 1 0 66 65 1 2 10 92 10 3 − 11 − 11 107 98 9 9 94 1 09 − 15 − 14 99 93 6 6 11 3 109 − 4 − 4 115 11 3 2 2 11 54 41 13 3 2 4 2 39 3 8 54 43 1 1 26 40 56 − 16 − 29 42 4 5 3 7 52 50 2 4 12 28 23 5 2 2 3 1 23 8 35 28 32 − 4 − 13 23 28 − 5 − 18 27 1 9 − 8 − 4 2 26 24 2 8 13 14 5 14 5 0 0 144 14 3 1 1 1 45 1 45 0 0 14 3 14 6 − 3 − 2 14 5 144 − 1 − 1 147 14 5 2 1 14 79 77 2 3 7 7 79 − 2 − 3 797 8 1 1 808 0 0 0 81 7 9 − 2 − 38 6 84 2 2 15 80 78 2 3 8 1 80 1 1 80 81 − 1 − 18 0 80 0 0 80 7 9 − 1 − 18 4 83 1 1 16 52 51 1 2 5 3 53 0 0 52 53 − 1 − 25 3 53 0 0 53 5 2 − 1 − 25 7 56 1 2 17 37 35 2 6 3 4 37 − 3 − 8 373 7 0 0 383 8 0 0 38 3 5 − 3 − 94 3 41 2 5 18 13 2 13 1 1 1 132 13 3 − 1 − 11 33 1 34 − 1 − 1 13 4 13 4 0 0 13 3 133 0 0 13 9 1 36 3 2 19 13 7 12 6 11 9 126 12 3 3 2 1 27 1 26 1 1 11 8 13 5 − 17 − 13 12 2 132 1 0 8 13 3 1 30 3 2 20 26 26 0 0 2 6 27 − 1 − 42 7 28 − 1 − 42 8 28 0 0 28 2 4 − 4 − 1 7 30 30 0 0 21 64 60 4 7 5 4 61 − 7 − 1 1 65 56 9 16 58 67 − 9 − 13 63 6 2 − 1 − 26 5 67 − 2 − 3 22 96 95 1 1 9 4 97 − 3 − 3 989 6 2 2 989 8 0 0 97 9 3 − 4 − 49 9 98 1 1 23 59 58 1 2 5 9 60 − 1 − 2 606 0 0 0 606 0 0 0 61 5 8 − 3 − 56 5 64 1 2 24 30 29 1 3 2 8 31 − 3 − 1 0 31 30 1 3 32 31 1 3 32 2 8 − 4 − 1 4 36 35 1 3 25 0 0 0 0 − 20 − 2 0 10 1 0 10 1 0 0 − 3 − 31 0 0 4 3 1 33 26 79 81 − 2 − 28 2 87 − 5 − 6 94 85 9 11 84 93 − 9 − 10 90 7 8 − 12 − 1 5 88 81 7 9 27 65 65 0 0 6 5 67 − 2 − 3 666 6 0 0 676 7 0 0 67 6 5 − 2 − 37 0 69 1 1 28 15 30 − 15 − 50 1 6 25 − 9 − 3 6 19 18 1 6 32 21 1 1 5 2 25 1 3 − 12 − 9 2 26 18 8 44 29 30 31 − 1 − 32 7 30 − 3 − 1 0 31 29 2 7 33 31 2 6 29 2 7 − 2 − 73 2 32 0 0 30 63 63 0 0 6 2 67 − 5 − 7 706 5 5 8 667 0 − 4 − 66 8 6 0 − 8 − 1 3 70 67 3 4 31 66 64 2 3 6 3 70 − 7 − 1 0 65 64 1 2 66 65 1 2 71 6 5 − 6 − 97 3 69 4 6 32 22 20 2 1 0 1 9 22 − 3 − 1 4 22 21 1 5 23 22 1 5 22 1 8 − 4 − 2 2 26 25 1 4 33 14 13 1 8 1 1 15 − 4 − 2 7 15 14 1 7 16 15 1 7 15 1 1 − 4 − 3 6 18 18 0 0 34 11 1 97 14 1 4 9 3 91 2 2 83 96 − 13 − 14 10 3 83 2 0 2 4 91 109 1 8 17 94 1 15 − 21 − 18 35 10 5 10 7 − 2 − 2 119 98 21 21 1 14 1 20 − 6 − 51 1 1 11 4 − 3 − 3 10 0 105 5 5 10 2 1 09 − 7 − 6 36 9 3 6 200 − 11 − 2 − 200 6 2 4 20 0 9 19 − 10 − 53 10 9 − 1 − 1 1 11 12 − 1 − 8 37 13 16 − 3 − 19 1 0 14 − 4 − 2 9 14 13 1 8 17 15 2 1 3 14 1 0 − 4 − 4 0 17 15 2 13 38 17 2 16 8 4 2 167 17 0 − 3 − 2 1 73 1 73 0 0 17 5 17 5 0 0 17 4 173 − 1 − 1 192 19 5 − 3 − 2 39 88 86 2 2 8 6 90 − 4 − 4 898 8 1 1 908 9 1 1 92 8 7 − 5 − 69 6 94 2 2 40 27 27 0 0 2 7 28 − 1 − 42 9 30 − 1 − 33 0 29 1 3 30 2 5 − 5 − 2 0 31 30 1 3
Tabl e 2. C onti nued Cel l No . 1 day 2 day 3 da y 4 d ay 5 day 6 da y LX -CS (A D C ) OC-C S (A D C ) Di ff Di ff (% ) LX-CS (ADC ) OC-C S (A D C ) Di ff Di ff (% ) LX-CS (ADC ) OC-C S (A DC ) Di ff Di ff (% ) LX -CS (A D C ) OC-C S (A D C ) Di ff Di ff (% ) LX -CS (A D C ) OC-C S (A DC ) Di ff Di ff (% ) LX -CS (A D C ) OC-C S (A DC ) Di ff Di ff (% ) 41 67 66 1 2 6 5 70 − 5 − 7 696 8 1 1 696 8 1 1 69 6 4 − 5 − 87 2 72 0 0 42 78 74 4 5 7 2 76 − 4 − 5 777 6 1 1 787 7 1 1 78 7 6 − 2 − 37 9 84 − 5 − 6 43 14 1 13 9 2 1 139 14 2 − 3 − 2 1 43 142 1 1 14 3 14 3 0 0 14 4 140 − 4 − 3 124 14 2 − 18 − 13 44 78 79 − 1 − 17 9 79 0 0 78 8 1 − 3 − 48 0 79 1 1 80 7 6 − 4 − 57 7 83 − 6 − 7 45 0 0 0 0 0 1 − 1 − 10 0 10 1 0 31 2 20 0 2 − 2 − 42 00 7 8 − 1 − 13 46 59 53 6 1 1 5 0 52 − 2 − 44 8 5 3 − 5 − 9 56 48 8 17 52 5 7 5 9 54 64 − 10 − 16 47 18 18 0 0 1 4 19 − 5 − 2 6 18 1 7 1 6 21 18 3 17 19 1 4 − 5 − 36 24 24 0 0 48 11 7 10 8 9 8 103 11 5 − 12 − 10 12 3 10 6 17 16 113 123 − 10 − 8 11 7 116 − 1 − 1 119 12 4 − 5 − 4 49 22 21 1 5 1 9 23 − 4 − 1 7 23 2 2 1 5 24 23 1 4 23 1 9 − 4 − 21 29 29 0 0 50 23 22 1 5 2 0 24 − 4 − 1 7 26 2 4 2 8 25 27 − 2 − 72 5 2 0 − 5 − 25 29 31 − 2 − 6 51 31 28 3 1 1 2 7 31 − 4 − 1 3 31 3 0 1 3 31 31 0 0 31 2 8 − 3 − 11 35 38 − 3 − 8 52 38 36 2 6 3 4 38 − 4 − 1 1 40 3 8 2 5 40 40 0 0 40 3 5 − 5 − 14 44 44 0 0 53 21 20 1 5 1 7 21 − 4 − 1 9 22 2 1 1 5 23 22 1 5 23 1 8 − 5 − 28 28 28 0 0 54 12 9 12 5 4 3 121 13 2 − 11 − 8 1 32 124 8 6 12 3 12 0 3 3 13 3 131 − 2 − 2 137 13 9 − 2 − 1 55 − 10 − 10 − 20 − 2 0 00 0 0 00 0 0 0 − 2 − 21 00 0 0 0 0 Cel l No. 7 day 8 day 9 da y 10 day M ea n (N=1 0) LX-CS (ADC ) OC-C S (A DC ) Di ff Di ff (% ) LX-CS (ADC ) OC-C S (A D C ) Di ff Di ff ( % ) LX -CS (A D C ) OC-C S (A DC ) Di ff D iff (% ) LX-CS (ADC ) OC-C S (A DC ) Di ff Di ff (% ) LX-CS (ADC ) OC-C S (A D C ) D iff Diff (% ) 1 5 8 57 1 2 62 60 2 3 58 5 8 0 0 6 4 59 5 8 56 55 1 1 2 7 7 76 1 1 75 73 2 3 77 7 7 0 0 7 0 71 − 1 − 17 1 70 1 2 3 5 8 57 1 2 58 58 0 0 58 5 8 0 0 5 5 56 − 1 − 25 4 53 0 1 4 4 7 49 − 2 − 44 1 62 − 21 − 34 47 48 − 1 − 24 8 61 − 13 − 21 47 49 − 2 − 4 5 4 4 42 2 5 41 42 − 1 − 2 434 3 0 0 3 84 0 − 2 − 53 7 37 0 1 6 4 8 46 2 4 47 47 0 0 48 4 8 0 0 4 4 45 − 1 − 24 1 40 1 1 7 8 4 86 − 2 − 2 75 75 0 0 85 7 7 8 1 0 7 7 75 2 3 76 75 1 1 8 3 7 36 1 3 36 37 − 1 − 3 373 5 2 6 3 43 5 − 1 − 33 3 32 1 2 9 5 8 59 − 1 − 2 67 634 6 59 5 54 7 7 0 646 9 61 601 2 10 113 1 12 1 1 1 15 12 1 − 6 − 5 11 4 109 5 5 117 1 21 − 4 − 3 1 08 10 9 − 1 − 1 11 4 5 44 1 2 52 49 3 6 45 4 6 − 1 − 24 6 48 − 2 − 44 7 46 1 2 12 2 9 29 0 0 26 38 − 12 − 32 30 31 − 1 − 33 0 38 − 8 − 21 28 29 − 1 − 2 13 144 1 47 − 3 − 2 1 49 14 7 2 1 14 8 148 0 0 149 1 48 1 1 1 46 14 6 0 0 14 8 6 86 0 0 87 86 1 1 87 8 8 − 1 − 1 8 5 850 0 83 821 1 15 8 5 88 − 3 − 3 85 841 1 85 8 50 0 8 3 84 − 1 − 18 2 82 0 0 16 5 8 60 − 2 − 3 58 580 0 59 5 90 0 5 6 57 − 1 − 25 5 55 0 0 17 4 4 43 1 2 43 43 0 0 44 4 6 − 2 − 4 4 2 420 0 40 400 1 18 136 1 37 − 1 − 1 1 39 13 5 4 3 13 7 138 − 1 − 1 135 1 36 − 1 − 1 1 35 13 5 0 0 19 125 1 23 2 2 1 33 12 7 6 5 12 5 124 1 1 126 1 31 − 5 − 4 1 27 12 8 − 10
Tabl e 2. C onti nued Cel l No. 7 day 8 day 9 da y 10 day M ea n (N=1 0) LX-CS (ADC ) OC-C S (A DC ) Di ff Di ff (% ) LX-CS (ADC ) OC-C S (A D C ) Di ff Di ff ( % ) LX -CS (A D C ) OC-C S (A DC ) Di ff D iff (% ) LX-CS (A DC ) OC-C S (A DC ) Di ff Di ff (% ) LX-CS (ADC ) OC-C S (A D C ) D iff Diff (% ) 20 3 2 34 − 2 − 63 2 33 − 1 − 3 323 2 0 0 3 03 2 − 2 − 62 9 29 0 − 1 21 6 4 64 0 0 71 61 1 0 16 67 7 0 − 3 − 46 0 67 − 7 − 10 63 64 0 − 1 22 100 1 00 0 0 1 01 10 0 1 1 10 2 102 0 0 101 1 00 1 1 99 98 1 1 23 6 6 66 0 0 66 66 0 0 66 6 6 0 0 6 4 65 − 1 − 26 3 62 0 0 24 3 7 36 1 3 37 37 0 0 37 3 7 0 0 3 5 36 − 1 − 33 4 33 1 2 25 43 1 3 3 4 400 550 023 − 1 − 33 2 2 0 27 26 9 0 84 6 7 95 87 8 9 83 9 6 − 13 − 1 4 8 6 81 5 6 87 85 2 2 27 7 1 70 1 1 71 70 1 1 71 7 1 0 0 6 9 70 − 1 − 16 8 68 0 0 28 2 7 36 − 9 − 25 23 21 2 10 20 2 6 − 6 − 2 3 2 0 19 1 5 22 23 0 − 2 29 3 3 35 − 2 − 6 35 332 63 5 3 50 03 2 33 − 1 − 33 2 32 0 0 30 7 1 68 3 4 74 70 4 6 69 7 5 − 6 − 8 6 9 681 16 8 671 1 31 7 4 70 4 6 70 69 1 1 72 7 1 1 1 6 8 71 − 3 − 46 9 68 1 1 32 2 7 27 0 0 27 27 0 0 28 2 8 0 0 2 5 26 − 1 − 42 4 24 1 2 33 1 9 18 1 6 20 19 1 5 20 2 0 0 0 1 7 19 − 2 − 11 17 16 0 2 34 94 10 5 − 11 − 10 86 10 0 − 14 − 14 11 6 8 8 28 32 9 8 1 16 − 18 − 16 97 10 0 − 3 − 3 35 102 1 14 − 12 − 11 11 8 124 − 6 − 5 11 1 119 − 8 − 7 122 1 10 12 1 1 1 10 11 2 − 2 − 1 36 11 7 4 57 13 5 8 16 0 16 22 − 6 − 27 3 15 − 12 − 80 9 10 − 1 − 8 37 1 7 18 − 1 − 6 17 170 01 7 1 70 01 4 16 − 2 − 13 15 15 0 − 1 38 193 1 95 − 2 − 1 1 90 19 0 0 0 19 3 191 2 1 183 1 87 − 4 − 2 1 81 18 2 − 10 39 9 7 95 2 2 95 96 − 1 − 1 97 9 61 19 4 96 − 2 − 29 2 92 1 1 40 3 2 32 0 0 32 34 − 2 − 6 32 3 20 03 2 311 33 0 300 1 41 7 4 72 2 3 73 73 0 0 73 7 3 0 0 7 0 71 − 1 − 17 0 70 0 1 42 8 2 81 1 1 82 82 0 0 85 8 2 3 4 7 8 83 − 5 − 67 9 79 0 0 43 144 1 45 − 1 − 1 1 45 14 4 1 1 14 6 146 0 0 141 1 43 − 2 − 1 1 41 14 3 − 2 − 1 44 8 5 86 − 1 − 18 5 87 − 2 − 2 85 8 50 07 8 780 08 1 81 − 1 − 1 45 1 0 9 1 1 1 9 900 880 046 − 2 − 33 4 4 0 10 46 5 7 62 − 5 − 85 4 60 − 6 − 10 65 5 3 12 23 5 5 63 − 8 − 13 55 57 − 2 − 3 47 2 5 27 − 2 − 72 4 25 − 1 − 4 25 2 50 02 1 27 − 6 − 22 21 21 − 1 − 2 48 122 1 20 2 2 1 30 11 5 1 5 13 12 6 130 − 4 − 3 109 1 22 − 13 − 11 11 8 118 0 0 49 3 0 29 1 3 30 30 0 0 31 3 0 1 3 2 7 29 − 2 − 72 6 26 0 1 50 3 1 30 1 3 32 30 2 7 31 3 2 − 1 − 32 7 29 − 2 − 72 7 27 0 0 51 3 8 36 2 6 37 37 0 0 35 3 5 0 0 3 3 37 − 4 − 11 33 33 0 − 1 52 4 4 43 1 2 45 44 1 2 44 4 4 0 0 4 1 44 − 3 − 74 1 41 0 1 53 2 8 27 1 4 28 28 0 0 27 2 6 1 4 2 5 27 − 2 − 72 4 24 0 2 54 137 1 31 6 5 1 27 13 2 − 5 − 4 13 1 125 6 5 128 1 30 − 2 − 2 1 30 12 9 1 1 55 00 000 000 000 0 − 20 − 20 − 10 0 1 50
Table 3. Analytical imprecision of LX detergent cleaning solution and OC detergent cleaning solution using internal quality control materials
Reagent Level Mean SD %CV
Repeatability Between run Between day Intermediate
LX detergent cleaning solution Level 1 142.8 5.30 1.63 1.70 3.30 3.70
Level 2 442.1 17.40 1.01 1.00 3.80 3.90
OC detergent cleaning solution Level 1 145.1 4.10 1.90 1.90 2.10 2.80
Level 2 445.4 11.20 1.23 1.20 2.20 2.50
%CVs were calculated by EP evaluator Release 11.
5) Statistical analysis
All statistical analyses were performed using MedCalc Software version 14.12.0 (Mariakerke, Belgium) and EP evaluator Release 11 (David G. Rhoads Assoc., Kennett Square, PA, USA).
RESULTS
1. Cuvettes cleaning check
OC Sensor PLEDIA was composed of 55 semi- disposal acryl cuvettes. The cleaning power of cuvettes was determined using the ADC value measured by optical absorbance. After conducting a sufficient cleaning solution prime under the same conditions for 10 days, a cell blank check was performed. After performing a sufficient cleaning solution prime under the same conditions once a day for 10 days, a cell blank check was evaluated. An analog digital conversion circuit was used to quantitatively measure the cleaning power of both products. If the ADC value was less than 10, it was allowed as a percentage difference of ±<200, and if the ADC value was more than 10, it was allowed as a percentage difference of ±<100. As a result of the measurement, all of 55 cuvettes satisfied the accep-tance criteria (Table 2).
2. Precision
I calculated the mean, standard deviation, coefficient of variation for repeatability, between runs, between days, and intermediate data using the OC quality control materials. And as a result of evaluation by OC Sensor PLEDIA in LX-CS, low concentration material was 142.8±5.3 ng/mL, 1.63%, 1.70%, 3.30%, 3.70% and
high concentration material was 442.1±17.4 ng/mL, 1.01%, 1.00%, 3.80%, 3.90%. And in OC-CS, low con-centration material was 145.1±4.10 ng/mL, 1.90%, 1.90%, 2.10%, 2.80% and high concentration material was 445.4±11.20 ng/mL, 1.23%, 1.20%, 2.20%, 2.50%, respectively (Table 3).
3. Linearity
As a result of using the OC calibrator, the imported LX-CS and the self-manufactured OC-CS showed excellent linearity within each analytical measurable range in the linear regression plots shown in Figure 2. The linearity regression of LX-CS was y=1.0017 x-5.7
(r2=0.9982) and the self-manufactured OC-CS was
y=0.9924 x-2.7 (r2=0.9996), respectively.
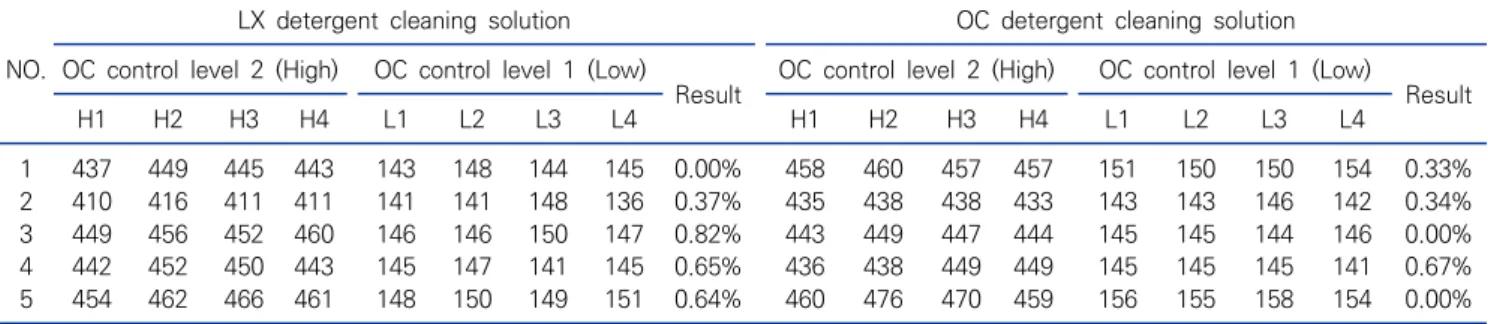
4. Carry-over
I measured the high concentration OC control level 2 (H1, H2, H3, H4) four times and then the low concentration OC control level 1 (L1, L2, L3, L4) four times in a row. As a result of the imported LX-CS and the self-manufactured OC-CS were evaluated once a week for 5 days with OC sensor PLEDIA, the carry-over rates (%) of all results were within 1%, which is acceptable (Table 4).
5. Correlation
Based on the AMR of 50 to 1000 ng/mL, the total of 40 artificial-stool specimens of 7 normal samples and 33 abnormal samples were treated using OC detergent cleaning solution for 5 days and measured with OC Sensor PLEDIA (Table 5). Under the same conditions, they were also treated using LX detergent cleaning
Figure 2. Linearity analysis of LX detergent cleaning solution (A) and OC detergent cleaning solution (B).
Table 4. Carry-over for 5 days once a day of OC sensor PLEDIA
NO.
LX detergent cleaning solution OC detergent cleaning solution
OC control level 2 (High) OC control level 1 (Low)
Result OC control level 2 (High) OC control level 1 (Low) Result
H1 H2 H3 H4 L1 L2 L3 L4 H1 H2 H3 H4 L1 L2 L3 L4 1 437 449 445 443 143 148 144 145 0.00% 458 460 457 457 151 150 150 154 0.33% 2 410 416 411 411 141 141 148 136 0.37% 435 438 438 433 143 143 146 142 0.34% 3 449 456 452 460 146 146 150 147 0.82% 443 449 447 444 145 145 144 146 0.00% 4 442 452 450 443 145 147 141 145 0.65% 436 438 449 449 145 145 145 141 0.67% 5 454 462 466 461 148 150 149 151 0.64% 460 476 470 459 156 155 158 154 0.00%
Table 5. Artificial-stool sample number for interval range and ratio
Artificial-stool Total N=40 (50∼1000 ng/mL)
0∼100 101∼200 201∼500 501∼700 701∼900 >901
7 (17.5%) 9 (22.5%) 5 (12.5%) 14 (35%) 3 (7.5%) 2 (5%)
solution. The result of linear regression graph was
y=0.9978 x-6.5683, where r2=0.9997. Besides, when the
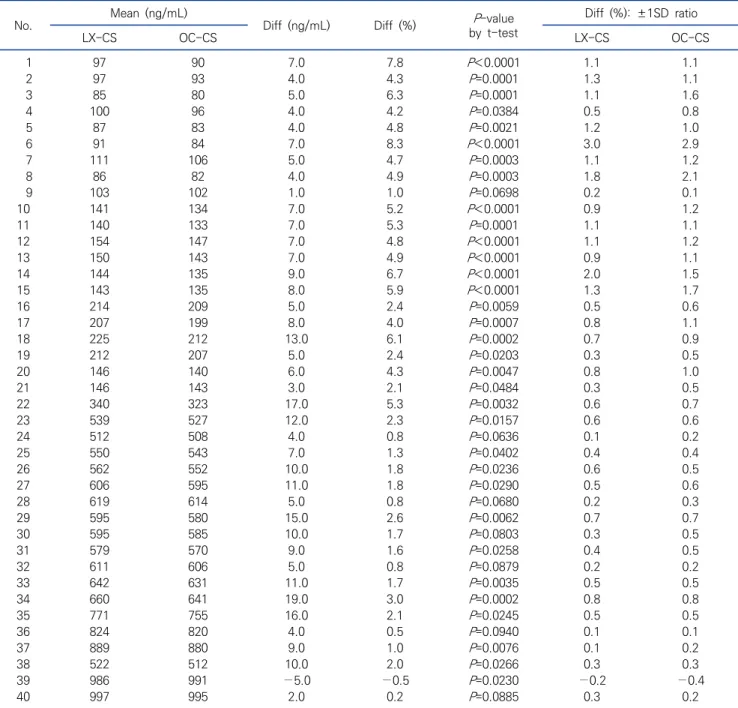
averages of 40 artificial-stool specimens were com-pared, the % difference was less than 10, and the P-value was less than 0.1, showed little difference between the two products. The ratio of ±1 SD based on % difference showed similar results for both products (Table 6).
DISCUSSION
For colorectal cancer screening, many general medical institutions use the OC Sensor series as a
quantitative method [16]. Depending on the OC sensor series, OC Sensor PLEDIA requires LX detergent cleaning solution, buffer solution, and OC Diana latex reagent. Especially, LX detergent cleaning solutions are responsible for cleaning cuvettes, nozzles, and probes cleaning. As for the functional analysis of the imported LX detergent cleaning solution (LX-CS) and the self-manufactured OC detergent cleaning solution (OC-CS), the role of cleaning in each instrument part plays a very important role in results stability. To check the cleaning power, there were cases where the contamination rate was measured by evaluating the residual amount per unit area or calculating the ppm,
Table 6. Mean, % difference, P-value, and % difference: ±1SD ratio using artificial-stool
No. Mean (ng/mL) Diff (ng/mL) Diff (%) by t-testP-value Diff (%): ±1SD ratio
LX-CS OC-CS LX-CS OC-CS 1 97 90 7.0 7.8 P<0.0001 1.1 1.1 2 97 93 4.0 4.3 P=0.0001 1.3 1.1 3 85 80 5.0 6.3 P=0.0001 1.1 1.6 4 100 96 4.0 4.2 P=0.0384 0.5 0.8 5 87 83 4.0 4.8 P=0.0021 1.2 1.0 6 91 84 7.0 8.3 P<0.0001 3.0 2.9 7 111 106 5.0 4.7 P=0.0003 1.1 1.2 8 86 82 4.0 4.9 P=0.0003 1.8 2.1 9 103 102 1.0 1.0 P=0.0698 0.2 0.1 10 141 134 7.0 5.2 P<0.0001 0.9 1.2 11 140 133 7.0 5.3 P=0.0001 1.1 1.1 12 154 147 7.0 4.8 P<0.0001 1.1 1.2 13 150 143 7.0 4.9 P<0.0001 0.9 1.1 14 144 135 9.0 6.7 P<0.0001 2.0 1.5 15 143 135 8.0 5.9 P<0.0001 1.3 1.7 16 214 209 5.0 2.4 P=0.0059 0.5 0.6 17 207 199 8.0 4.0 P=0.0007 0.8 1.1 18 225 212 13.0 6.1 P=0.0002 0.7 0.9 19 212 207 5.0 2.4 P=0.0203 0.3 0.5 20 146 140 6.0 4.3 P=0.0047 0.8 1.0 21 146 143 3.0 2.1 P=0.0484 0.3 0.5 22 340 323 17.0 5.3 P=0.0032 0.6 0.7 23 539 527 12.0 2.3 P=0.0157 0.6 0.6 24 512 508 4.0 0.8 P=0.0636 0.1 0.2 25 550 543 7.0 1.3 P=0.0402 0.4 0.4 26 562 552 10.0 1.8 P=0.0236 0.6 0.5 27 606 595 11.0 1.8 P=0.0290 0.5 0.6 28 619 614 5.0 0.8 P=0.0680 0.2 0.3 29 595 580 15.0 2.6 P=0.0062 0.7 0.7 30 595 585 10.0 1.7 P=0.0803 0.3 0.5 31 579 570 9.0 1.6 P=0.0258 0.4 0.5 32 611 606 5.0 0.8 P=0.0879 0.2 0.2 33 642 631 11.0 1.7 P=0.0035 0.5 0.5 34 660 641 19.0 3.0 P=0.0002 0.8 0.8 35 771 755 16.0 2.1 P=0.0245 0.5 0.5 36 824 820 4.0 0.5 P=0.0940 0.1 0.1 37 889 880 9.0 1.0 P=0.0076 0.1 0.2 38 522 512 10.0 2.0 P=0.0266 0.3 0.3 39 986 991 −5.0 −0.5 P=0.0230 −0.2 −0.4 40 997 995 2.0 0.2 P=0.0885 0.3 0.2
P-values were calculated by MedCalc Software version 14.12.0.
but in this paper, it was replaced with the ADC value [17, 18]. And then the quantitative cleaning power of each instrument part can be determined by measuring the ADC value based on the Technical Service Manual (Eiken chemical, Japan). The percent differences were compared to the ADC values of 55 cuvettes concerning the cell blank value for 10 days, to see if there was any difference in functional analysis of the cleaning power
of LX-CS and OC-CS. The ADC values of 10 or less showed a rather high % difference, but this seems to be a relatively large bias difference for low values. Comparing the functional analysis differences between OC-CS and LX-CS, they were all acceptable given the acceptance range of ADC 10 or less ±200 % difference and ADC 10 or more ±100 % difference (Table 2). Besides, before this, the equivalence was confirmed
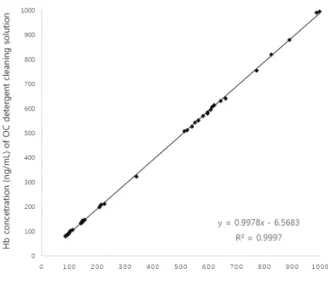
Figure 3. The correlation of hemoglobin (Hb) concentrations quantified by LX detergent cleaning solution and OC detergent cleaning solution.
using component analysis through LC-MS.
The %CVs of repeatability and within-laboratory precision using low concentration and high concen-tration were performed. When the coefficients of variation that were tested for repeatability, between runs, between days, and in intermediate data were compared, LX-CS and OC-CS were both less than 5.0% in high and low concentrations of quality control materials, showed excellent results. As a result of evaluating OC Sensor PLEDIA using LX-CS, the intermediate coefficient of variation was 3.50% for low concentration materials, and 3.61% for high concentration materials, showed good precision results in low concentration. As a result of evaluating OC Sensor PLEDIA using OC-CS, the intermediate coefficient of variation was 2.70% for the low-con-centration materials and 2.33% for high-conlow-con-centration materials, which showed better precision in high-concentration materials. Regarding precision, OC-CS showed a little higher precision than the LX-CS, and both products were less than 5.0%, which was excellent quality for quantitative validation performance. In a previous study that evaluated OC NEO and OC DIANA among the OC sensor series, it can be seen that the precision was higher than that measured at 7.8% and 3.1% for low-concentration materials, and 3.5% and 2.0% for high-concentration materials, respec-tively [19]. Besides, in a previous study evaluating HM-JACK (Kyowa Medex, Japan) and OC IO (Eiken Chemical, Japan) at various concentrations, repeatability of positive specimens using HM JACK is 3.5% in high concentration materials and 4.8% in low concentration specimens [20]. And then repeatability using OC sensor IO was 2.0∼4.3% in various levels of concentration [21]. As shown in Table 3, the precision performance was excellent in this study.
Linearity analysis of LX-CS and OC-CS measured
with OC sensor PLEDIA had r2 values of 0.9982 and
0.9996, respectively, which showed excellent linearity in all concentration ranges. However, both products showed a slightly higher % difference, 3.0∼6.0% in the
middle range of AMR 50 to 1000 ng/mL. These results were similar to those in previous studies in which OC sensor series were evaluated, and it was thought that there was no significant difference in linearity between LX-CS and OC-CS [22].
Since correlation between LX-CS and OC-CS cannot be handled with clinical samples, the results of using artificial-stool samples for external quality control materials, coefficients of determination between two
products were excellent at r2=0.9997. In a linear
regression analysis, LX-CS comparing with OC-CS was shifted upward to 6.568 ng/mL, confirmed that it was lower than OC-CS in the same sample, which was consistent with the linearity evaluation compared to correlation (Figure 3). These results could not be seen as a significant difference when the site variation of the collection process was reflected in consideration of the characteristics of inhomogeneous raw materials, small sample volume, calibration curve change according to the different lot, and could be confirmed through similar studies [23]. When LX-CS and OC-CS were compared, the proportion of artificial specimens of 500∼700 ng/mL was the highest (Table 5). In correlation evaluation, t-test showed no significant difference (P<0.1). As the results of mean and ratio of
% difference versus ±1SD were calculated for five days, there was no difference in an acceptable range for the two products. Therefore, the results showed no significant difference in the quantitative analysis between the two products. Also, the equation used based on the acceptance criteria for the two products using the equation as shown in Table 6 could be used the % difference normally cited in Korea or the range validation formula described in CLSI C54-A. However, since the range validation formula was similar to % difference except for determining the number repeatability, the % difference was applied in this study [24].
In this study, the imported LX detergent cleaning solution and the self-manufactured OC detergent cleaning solution showed excellent precision and linearity in fecal occult blood test using OC Sensor PLEDIA, and both products showed excellent quantitative performance due to the low carry-over rate using commercial materials. Also, in the functional analysis of two products, cleaning power and correlation using artificial-stools showed a high equivalency between two products. I suggested that showed no significant difference between LX-CS and OC-CS based on quantitative data.
In conclusion, this study clearly showed that the self-manufactured OC detergent cleaning solution than the imported LX detergent cleaning solution is a good choice since it could provide a faster and more stable supply to domestic OC Sensor PLEDIA users than the imported LX detergent solution. However, the evaluation period was relatively short when considering the functional analysis, and it was recognized that additional research using patient samples was necessary.
요 약 이 연구의 목적은 기능적, 정량적 분석을 바탕으로 수입 LX 세정액(LX-CS)과 자가제조 OC 세정액(OC-CS)의 성능을 비 교하였다. 기능적 분석은 ADC값을 사용하여 평가하였다. 정량 적 분석을 위해 CLSI 지침에 따라 정도 관리 물질을 이용하여 정 밀도, 직선성 및 오염률을 평가하였다. OC-Sensor PLEDIA (Eiken Chemical, Japan)를 이용한 모든 cuvette의 ADC값 은 허용기준을 만족하였다. 정량적 분석의 경우 두 제품의 정밀 도는 5.0% 미만이었고, 오염율은 ±1.00% 이하였다. 직선성 기 울기와 r2 값은 LX-CS에서 각각 1.0017와 0.9982였으며, OC-CS에서 0.9924와 0.9996이였다. 상관계수(r)는 0.9997 이였다. 또한 40개의 가변을 이용한 % difference는 10% 미만, P값은 0.1 미만이였다. 각 각 차이: 표준 편차 비(D: ±1 SD 비) 에 기초한 두 제품 모두 유사한 결과를 보였다. 결론적으로 두 제 품의 기능적, 정량적 분석을 비교한 결과 유사하였다. 향후 자가 제조한 OC세정액은 수입 LX세정액보다 훨씬 더 안정적이고 빠 른 공급을 제공할 수 있을 것이라 기대된다. Acknowledgements: None Conflict of interest: None
Author’s information (Position): Cha KJ, M.T.
REFERENCES
1. Lee ES. Health insurance corporation colorectal cancer screening guidelines. 2nd ed. Goyang: National Cancer Center; 2018. p40-48.
2. Limin X. Clegg, Frederick P. Li, Benjamin F. Hankey, Kenneth Chu, Brenda K. Edwards. Cancer survival among US Whites and Minorities. Arch Intern Med. 2002;162:1985-1993.
3. Allison JE. Colon cancer screening guidelines 2005: the fecal oc-cult blood test option has become a better FIT. Gastroenterology. 2005;129:745-748.
4. Allison JE, Tekawa IS, Ransom LJ, Adrain AL. A comparison of fe-cal occult blood tests for colorectal-cancer screening. N Engl J Med. 1996;334:155-159.
5. Jochim STD, Frank AO, Rene WMH, Henk AH, Rund JL, Sietze TT, et al. Higher fecal immunochemical test cutoff levels: lower pos-itivity rates but still acceptable detection rates for early-Stage colorectal cancers. Cancer Epidemiol Biomarkers Prev. 2011;20:272-280. https://doi.org/10.1158/10559965
6. Don C. Rockey. Occult gastrointestinal bleeding. N Engl J Med. 1999;341:38-46.
7. Jeon CH, Lee AJ, Kim KD. Annual report on external quality as-sessment scheme for urinalysis and faecal occult blood testing in Korea (2014). J Lab Med Qual Assur. 2015;37:179-189.
8. Inger DB. Colorectal cancer screening. Prim Care. 1999;26: 179-187.
9. Walter A. Kester. Characterizing and testing A/D and D/A con-verters for color video applications. IEEE Trans Circuits Sys I Regul Pap.1978;25:539-550.
10. Shinichi Touzuka, Keiko Aoyama. OC sensor series PLEDIA serv-ice manual. 2nd ed. Tokyo: Eiken chemical and Hitachi, Ltd;
2019. p343-368.
11. McEnroe R, Durham A, Goldford M, Kondratovich M, Lababidi S, Magari R, et al. Evaluation of precision of quantitative measure-ment procedures, approved guideline. CLSI documeasure-ment EP5-A3. Wayne, PA: Clinical and Laboratory Standards Institute; 2014. 12. Daniel W, Martin K, Astles J. Evaluation of the linearity of
quanti-tative measurement procedures: a statistical approach, approved guideline. CLSI document EP6-A2. Wayne, PA: Clinical and Laboratory Standards Institute; 2003.
13. Clinical and Laboratory Standards Institute. Verification of com-parability of patient results within one health care system, ap-proved guideline. Wayne, PA: Clinical and Laboratory Standards Institute; 2012.
14. Krouwer JS, Cembrowski GS, Tholen DW. Preliminary evaluation of quantitative clinical laboratory measurement procedures, ap-proved guideline. CLSI document EP10-A3. Wayne, PA: Clinical and Laboratory Standards Institute; 2006.
15. Budd J, Durham A, Gwise T, Iriarte B, Kallner A, Linnet K, et al. Measurement procedure comparison and bias estimation using subject samples, approved guideline. CLSI document EP09-A3. Wayne, PA: Clinical and Laboratory Standards Institute; 2013. 16. Jeon CH, Lee AJ, Kim SG. Suh HS, Bae YC. Annual report on
ex-ternal quality assessment scheme for urinalysis and faecal occult blood testing in Korea (2017). J Lab Med Qual Assur. 2018;40: 128-139.
17. Apolline A, Laure C, Johann-Francois O, Sebastien G, Nicolas C, Jean-Francois B. Comparison of decontamination efficacy of cleaning solutions on a biological safety cabinet workbench
con-taminated by cyclophosphamide. Can J Hosp Pharm. 2017;70: 407-414. https://doi.org/10.4212/cjhp.v70i6.1708
18. Nefise O, Filiz K, Dugu P. Comparison of steam technology and a two-step cleaning(water/detergent) and disinfecting(1,000 resp.5,000ppm hypochlorite) method using microfiber cloth for environmental control of multidrug-resistant organisms in an in-tensive care unit. GMS Hyg Infect Control. 2019;14:1-7. https://doi.org/10.3205/dgkh000330
19. Kim JH, Kim HS, Chung HJ, Yoon NS, Pyo YJ, Bae HG, et al. Evaluation of the OC-SENSOR neo System for testing fecal occult blood. J Lab Med Qual Assur. 2007;27:210-215.
20. Hong SB, Kim HS, Park HS, Lee DH. Evaluation of the HM-JACK automatic analyzer for fecal occult blood test. J Lab Med Qual Assur 2002;24:221-224.
21. Kim DC, Cho SS, Song J, Kim EC, Kim JQ. Evaluation of the OC-SENSOR (Automatic Measuring Apparatus) for immuno-logical fecal occult blood test. J Clin Pathol Qual Control. 1998;20:281-287.
22. Kim JH, Chung HJ, Yoon NS, Pyo YJ, Bae HG. Evaluation of the OC-SENSOR neo System for testing fecal occult blood. Korean J Lab Med. 2007;27:210-215.
23. Park YM, Choi Q, Kwon GC, Koo SH. Performance evaluation of the HM-JACKarc analyser for fecal occult blood test. J Lab Med Qual Assur. 2016;38:137-142.
24. Kim BH, Cha YJ. Verification of comparability among quantita-tive results obtained using multiple instruments within a health care system. Lab Med Online. 2014;4:65-70.