Optical fine-needle imaging biopsy of the brain
Jun Ki Kim,1,2,4 Jin Woo Choi,1,3,4 and Seok H. Yun1,2,*
1Harvard Medical School and Wellman Center for Photomedicine, Massachusetts General Hospital, 40 Blossom
Street, Boston, Massachusetts 02114, USA
2WCU Graduate School of Nanoscience and Technology, Korea Advanced Institute of Science and Technology,
Daejeon, 305-701, South Korea
3Currently with the Department of Dental Pharmacology and Institute of Biomaterials-Implant, School of Dentistry,
Wonkwang University, Iksan, Chonbuk 570-749, South Korea
4 Equal Contribution
*syun@hms.harvard.edu
Abstract: We demonstrate optical fine-needle imaging biopsy (FNIB),
combining a fine needle (22 gauge) and a high-resolution side-view probe (350-μm diameter) for minimally invasive interrogation of brain tissue in
situ. We apply this technique to examine pathogenesis in murine models of
neurodegeneration, brain metastasis of melanoma, and arterial occlusion, respectively. The demonstrated ability to obtain cellular images in the deep brain without craniotomy may be useful in the longitudinal studies of brain diseases.
©2013 Optical Society of America
OCIS codes: (170.2150) Endoscopic imaging; (180.1790) Confocal microscopy; (180.2520) Fluorescence microscopy.
References and links
1. J. Tilgner, M. Herr, C. Ostertag, and B. Volk, “Validation of intraoperative diagnoses using smear preparations from stereotactic brain biopsies: intraoperative versus final diagnosis--influence of clinical factors,”
Neurosurgery 56(2), 257–265, discussion 257–265 (2005).
2. W. Feiden, U. Steude, K. Bise, and O. Gündisch, “Accuracy of stereotactic brain tumor biopsy: comparison of the histologic findings in biopsy cylinders and resected tumor tissue,” Neurosurg. Rev. 14(1), 51–56 (1991). 3. F. Helmchen and W. Denk, “Deep tissue two-photon microscopy,” Nat. Methods 2(12), 932–940 (2005). 4. A. Holtmaat, T. Bonhoeffer, D. K. Chow, J. Chuckowree, V. De Paola, S. B. Hofer, M. Hübener, T. Keck, G.
Knott, W. C. Lee, R. Mostany, T. D. Mrsic-Flogel, E. Nedivi, C. Portera-Cailliau, K. Svoboda, J. T.
Trachtenberg, and L. Wilbrecht, “Long-term, high-resolution imaging in the mouse neocortex through a chronic cranial window,” Nat. Protoc. 4(8), 1128–1144 (2009).
5. G. Yang, F. Pan, C. N. Parkhurst, J. Grutzendler, and W. B. Gan, “Thinned-skull cranial window technique for long-term imaging of the cortex in live mice,” Nat. Protoc. 5(2), 201–208 (2010).
6. R. P. J. Barretto, T. H. Ko, J. C. Jung, T. J. Wang, G. Capps, A. C. Waters, Y. Ziv, A. Attardo, L. Recht, and M. J. Schnitzer, “Time-lapse imaging of disease progression in deep brain areas using fluorescence
microendoscopy,” Nat. Med. 17(2), 223–228 (2011).
7. L. Fu, A. Jain, C. Cranfield, H. K. Xie, and M. Gu, “Three-dimensional nonlinear optical endoscopy,” J. Biomed. Opt. 12(4), 040501 (2007).
8. J. K. Kim, W. M. Lee, P. Kim, M. Choi, K. Jung, S. Kim, and S. H. Yun, “Fabrication and operation of GRIN probes for in vivo fluorescence cellular imaging of internal organs in small animals,” Nat. Protoc. 7(8), 1456– 1469 (2012).
9. J. K. Kim J. W. Choi and S. H. Yun, “350 μm sideview optical probe for imaging the murine brain in vivo from the cortex to the hypothalamus,” J. Biomed. Opt. 18, 050502 (2013).
10. P. Kim, M. Puoris’haag, D. Côté, C. P. Lin, and S. H. Yun, “In vivo confocal and multiphoton microendoscopy,” J. Biomed. Opt. 13(1), 010501 (2008).
11. K. Nagashima, Y. Fujii, T. Tsukamoto, S. Nukuzuma, M. Satoh, M. Fujita, Y. Fujioka, and H. Akagi, “Apoptotic process of cerebellar degeneration in experimental methylmercury intoxication of rats,” Acta Neuropathol. 91(1), 72–77 (1995).
12. A. Hara, M. Niwa, N. Yoshimi, and H. Mori, “Apoptotic cell death in vulnerable subpopulation of cerebellar granule cells,” Acta Neuropathol. 94(5), 517–518 (1997).
13. L. Beni-Adani, I. Gozes, Y. Cohen, Y. Assaf, R. A. Steingart, D. E. Brenneman, O. Eizenberg, V. Trembolver, and E. Shohami, “A peptide derived from activity-dependent neuroprotective protein (ADNP) ameliorates injury response in closed head injury in mice,” J. Pharmacol. Exp. Ther. 296(1), 57–63 (2001).
14. T. V. Arumugam, S. L. Chan, D. G. Jo, G. Yilmaz, S. C. Tang, A. Cheng, M. Gleichmann, E. Okun, V. D. Dixit, S. Chigurupati, M. R. Mughal, X. Ouyang, L. Miele, T. Magnus, S. Poosala, D. N. Granger, and M. P. Mattson,
“Gamma secretase-mediated Notch signaling worsens brain damage and functional outcome in ischemic stroke,” Nat. Med. 12(6), 621–623 (2006).
15. G. Stoll, C. Kleinschnitz, and B. Nieswandt, “Combating innate inflammation: a new paradigm for acute treatment of stroke?” Ann. N. Y. Acad. Sci. 1207(1), 149–154 (2010).
16. R. Jin, G. Yang, and G. Li, “Inflammatory mechanisms in ischemic stroke: role of inflammatory cells,” J. Leukoc. Biol. 87(5), 779–789 (2010).
17. A. F. Eichler, E. Chung, D. P. Kodack, J. S. Loeffler, D. Fukumura, and R. K. Jain, “The biology of brain metastases-translation to new therapies,” Nat Rev Clin Oncol 8(6), 344–356 (2011).
18. Y. Chudnovsky, P. A. Khavari, and A. E. Adams, “Melanoma genetics and the development of rational therapeutics,” J. Clin. Invest. 115(4), 813–824 (2005).
19. T. H. Chia and M. J. Levene, “Microprisms for in vivo multilayer cortical imaging,” J. Neurophysiol. 102(2), 1310–1314 (2009).
20. D. E. Bredesen, R. V. Rao, and P. Mehlen, “Cell death in the nervous system,” Nature 443(7113), 796–802 (2006).
21. K. Saijo, B. Winner, C. T. Carson, J. G. Collier, L. Boyer, M. G. Rosenfeld, F. H. Gage, and C. K. Glass, “A Nurr1/CoREST pathway in microglia and astrocytes protects dopaminergic neurons from inflammation-induced death,” Cell 137(1), 47–59 (2009).
22. M. Fuhrmann, T. Bittner, C. K. E. Jung, S. Burgold, R. M. Page, G. Mitteregger, C. Haass, F. M. LaFerla, H. Kretzschmar, and J. Herms, “Microglial Cx3cr1 knockout prevents neuron loss in a mouse model of Alzheimer’s disease,” Nat. Neurosci. 13(4), 411–413 (2010).
23. M. Gelderblom, F. Leypoldt, K. Steinbach, D. Behrens, C. U. Choe, D. A. Siler, T. V. Arumugam, E. Orthey, C. Gerloff, E. Tolosa, and T. Magnus, “Temporal and spatial dynamics of cerebral immune cell accumulation in stroke,” Stroke 40(5), 1849–1857 (2009).
24. E. Storkebaum, A. Quaegebeur, M. Vikkula, and P. Carmeliet, “Cerebrovascular disorders: molecular insights and therapeutic opportunities,” Nat. Neurosci. 14(11), 1390–1397 (2011).
25. I. J. Fidler, G. Schackert, R. D. Zhang, R. Radinsky, and T. Fujimaki, “The biology of melanoma brain metastasis,” Cancer Metastasis Rev. 18(3), 387–400 (1999).
26. R. P. Barretto, B. Messerschmidt, and M. J. Schnitzer, “In vivo fluorescence imaging with high-resolution microlenses,” Nat. Methods 6(7), 511–512 (2009).
27. W. M. Lee and S. H. Yun, “Adaptive aberration correction of GRIN lenses for confocal endomicroscopy,” Opt. Lett. 36(23), 4608–4610 (2011).
28. F. Zhang, V. Gradinaru, A. R. Adamantidis, R. Durand, R. D. Airan, L. de Lecea, and K. Deisseroth,
“Optogenetic interrogation of neural circuits: technology for probing mammalian brain structures,” Nat. Protoc. 5(3), 439–456 (2010).
1. Introduction
Brain needle biopsy is an established clinical procedure, allowing tissue samples to be extracted from the brain by using a fine, hollow needle and examined under a microscope [1]. This technique provides useful cellular-level information about diseases such as tumor, infection, and inflammation in the brain [2]. However, during needle aspiration the structural information of the tissue sample is destroyed, and the functional information, such as blood flow and neural activity, cannot be obtained. Because of this limitation, needle biopsy is rarely used in animal research, where histological examination and live imaging are more common. In particular, intravital fluorescence microscopy [3] is a powerful technique by allowing cells and blood flows in intact brain tissue to be visualized in live animals. Imaging is usually performed through a surgically prepared, transparent window [4] or a thinned skull [5], but small-diameter objective lenses offer a promising approach to increase the accessible region [6–8]. Recently, we have developed a thin, side-view probe made of graded-index (GRIN) lenses with a diameter of only 350 μm. The probe was inserted into the mouse brain through a hole drilled into the skull [9].
In this paper, we describe an approach combining such optical probes with fine needles, demonstrating a novel procedure we term optical fine-needle imaging biopsy (FNIB). In the mouse brain, a fine needle can penetrate the thin skull directly without craniotomy and provide a channel for the optical probe enabling cellular imaging in deep (>1 mm) brain tissue in situ. Compared to the previous methods based on optical implants [3–6], the FNIB technique does not require time-consuming surgical procedures, provides a greater imaging range in depth, and allows long-term monitoring of an animal without implant-induced complications. We demonstrate the utility of this technique in three pilot studies using mouse models of neurodegeneration, stroke, and cancer, respectively. FNIB is performed in live
animals in a relatively quick procedure (<10 min) and multiple times at desired intervals of one to several days.
2. Methods
2.1 Fabrication of an imaging-needle probe
The probe was constructed with triplet GRIN lenses and a 90°-angle prism mirror to have a length of 32 mm and a diameter of 350 μm (Fig. 1(a)) [9]. The triplet structure is comprised of a coupling lens (pitch0.25), a relay lens (pitch2), and an imaging lens (pitch0.16), to which the prism mirror was attached. The probe was then inserted into a 22-gauge hypodermic needle (BD Eclipse 22G; OD = 716μm; ID = 410 μm). After aligning the prism surface parallel to the beveled surface of the needle, the probe was glued to the needle with epoxy (EPO-TEK, 353ND) to build an integrated unit (Fig. 1(b)). The fabricated needle probe was mounted on a 3-axis translational and rotational stage and coupled to a video-rate confocal microscope system [10]. The working distance of the probe was variable over 0-100 µm (from the surface of the epoxy) by translating the coupling objective lens (40X, NA = 0.6) in the microscope without physically moving the probe. The intrinsic field of view (FOV) of the probe was about 90 μm; however, translating and rotating the needle along the axis allows a large tissue area to be visualized. The transverse and axial resolutions (in air) were about 1 and 10 μm, respectively.
Fig. 1. (a) Photographs of a side-view probe. The bright area at the center of the prism is due to the illumination light coupled into the probe at the proximal end (not shown). (b) A fabricated needle probe. Inset, a schematic showing focused laser light (blue).
2.2 Animal disease models
Neuronal degeneration model. We generated a model of intoxication by intraperitoneal
injection of methyl-mercury and trimethyltin hydroxide (TMT). These chemicals are known to cause acute neuronal degeneration localized to the granule cells in the cerebellum by enhancing apoptosis [11,12]. We used Thy1-YFP transgenic mice (10-weeks old) on C57B6 background, in which the yellow fluorescent protein (YFP) is expressed in granule cells and mossy fibers in the cerebellum. The first treatment group (n = 5) was injected with methyl mercury (10mg/kg) in 10% DMSO based on PEG400; the second group (n = 5) was treated with trimehyltin hydroxide (TMT, 2mg/kg) in 0.9% saline; and the control group (n = 5) was injected with 0.9% saline only. The chemical was delivered intraperitoneally at 2-day intervals. On each animal, in vivo optical needle biopsy was performed at three time points: Day 0 prior to the chemical treatment and Days 15 and 30 during the chemical treatment. At each time point, the needle probe was inserted directly into the cerebellum through the intact posterior skull. Images were obtained over a tissue area in a depth range of, approximately, 500-1000 µm from the surface of the brain tissue. On day 30, the mice were euthanized, and the excised cerebellar tissues were examined using conventional histopathology. In addition, a behavioral test based on the Neurological Severity Score (NSS) [13] was performed on separate animals in the treatment group (n = 5 each) and control group (n = 5); in this study, no needle biopsy was performed on the animals to preclude any side effects related to the biopsy procedure.
Stroke model. Cerebral ischemia was induced in 10-week-old MHC-class-II GFP mice
using the previously described method [14]. Briefly, after anesthetization, a midline incision was made in the neck that allowed for the identification of the common carotid artery (CCA), external carotid artery (ECA)and internal carotid artery (ICA). After carefully separating these blood vessels from the surrounding tissues, a ligature was made on the CCA, ECA, and then on the ICA using 6.0strings. An 8.0 monofilament was inserted and advanced along the middle cerebral artery (MCA) until it reached the bifurcation site. After achieving the occlusion of the MCA for 1 hour, the filament was removed to initiate reperfusion. The skin incision in the neck was closed with the remaining knots. Following the surgery, in vivo imaging of the MHC-II + GFP + cells was performed on days 1, 2 and 3.
Brain metastasis model. B16 melanoma cell line was transfected with RFP and GFP
lentiviral vectors (Genetarget, Inc.), respectively. The cells were selected with puromycin (3 μg/ml) treatment for 2 weeks. Afterwards, a p53 vector was introduced into the RFP + cells, and an empty pcDNA3.1 vector was administered into the GFP + cells using a transfection reagent (FuGene 6). The cells were treated with G418 at a concentration of 1 mg/ml for 2 weeks. To determine the expression level of p53, a western blot was performed with the FL-393 polyclonal antibody (Santa Cruz Biotechnology). A mixture of the GFP + B16 cells and the p53 overexpressing RFP + B16 cells was loaded in a syringe, and the syringe was mounted with a33-gauge needle (TSK Laboratory Japan) on a holder. A ten week-old wild type mouse in C57B6/L background (Jackson Laboratory) was anesthetized and placed on a plate heated to 37°C. A small skin flap was made over the skull, and the skull was thinned with a micro drill to facilitate the insertion of the33-gauge needle. Twenty microliters of the GFP-B16 and the p53 over-expressing RFP + B16 cell mixture (2,000,000 cells) per mouse were injected into the cerebral cortex area at an injection speed of 2 μl/sec. After the injection, the needle hole in the skull was covered with a biocompatible plastic (poly-lactic acid) and the skin flap was closed and sutured.
3. Results
3.1 Imaging neuronal degeneration
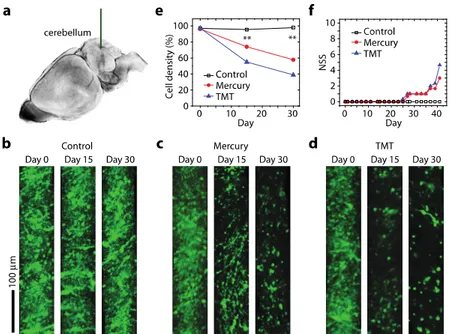
Experimental studies of neuronal degeneration using animal models have been traditionally performed with isolated tissues. However, the terminal method provides only a snapshot of information and, therefore, is limited in its ability to define the dynamic interactions involved. By contrast, an animal behavior test allows for longitudinal monitoring but cannot provide cellular details. To apply the optical biopsy technique in the assessment of neuronal degeneration in cerebellum (Fig. 2(a)), we produced mouse models of intoxication using intraperitoneal injections of methyl mercury and trimethyltin hydroxide (TMT). The time-lapse images revealed a dramatic decrease in the number of fluorescent granule cells over time in both the mercury- and TMT-treated animals but not in the control animals (Fig. 2(b)-2(d)). On day 15of intoxication, the average fluorescence intensity had decreased by 25% and 45% in the mercury- and TMT-treated groups, respectively; this trend continued on day 30 as the average fluorescence intensity had decreased by 40% and 60% in mouse groups treated with mercury and TMT, respectively (n = 5 each; Fig. 2(e)). To determine whether a correlation exists between the onset of neuronal cell death and behavioral impairment, we conducted the NSS test on additional animal groups (n = 5 each) in which needle biopsy was not performed. The behavior of the animals appeared normal (i.e., NSS = 0) until day 23, when presumably more than 30%of the neurons have already been damaged. Their behavioral impairment became apparent at day 25 and remained thereafter (Fig. 2(f)). This result indicates that significant cell death precedes the onset of detectable behavioral deficits at the animal level. This finding may be attributed to the physiological adaptability of animals against brain damage.
Fig. 2. Longitudinal monitoring of neuronal cell death in intoxication models. (a) Schematic of FNIB of the cerebellum (blue) with a 22-gauge needle-assisted probe is drawn here. (b) Images of Thy1-YFP cells at days 0, 15, and 30 in a control mouse. (c) Images of Thy1-YFP cells in a mouse treated with methyl mercury. (d) Images of Thy1-YFP cells in a mouse treated with trimethyltin hydroxide(TMT). The images in (b-d) were obtained at 500-1000 µm below the cortical surface of the cerebellum. (e) The changes in cell density over time acrossthe three treatment groups are plotted here. **, P<0.01 (f) The neurological severity scores(NSS) measured for three animal groups (n = 5 each).
3.2 Imaging immune cells after stroke
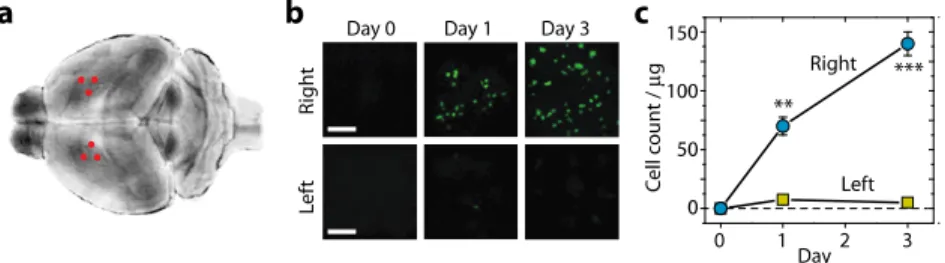
Cerebral ischemia-reperfusion injury triggers an inflammatory response that leads to neuronal cell death. Upon blockage of the blood supply, resident microglia is activated and secrete pro-inflammatory cytokines, which recruit neutrophils and monocytes/macrophages to the ischemic lesion. Understanding the dynamics of immune cell infiltration is important for the development of novel anti-inflammatory treatments for ischemia [15,16]. However, direct imaging of inflammatory cells in the deep ischemic sites of the middle of cerebrum has not been demonstrated in vivo. To quantify the infiltration of antigen-presenting immune cells, we used MHC Class II + GFP + transgenic mice. Stroke was experimentally induced in the right hemisphere of the brain by blocking the blood flow in the right middle cerebral artery (MCA) for one hour using the filament insertion method. An optical needle biopsy was performed immediately before the surgical occlusion and again on days 1 and 3 after the temporary occlusion. The needle probe was inserted into the cerebrum through the skull at two symmetrical coordinates, approximately corresponding to 1.0 mm posterior and 2.0 mm lateral to the bregma in both hemispheres (Fig. 3(a)). In different time points of biopsy, the needle was inserted at different sites (indicated by three red dots in each hemisphere). The distance between biopsy sites was about 500 µm, which ensured little effect of tissue damage from the previous biopsies (see Section 3.4). By direct visualization, we counted the number of MHC-II + GFP + cells in the deep region, which was defined as 1-1.5 mm below the cortical surface (Fig. 3(b)). In the ischemic right hemisphere, the significant infiltration of MHC Class-II cells (approximately 70,000 cells in 1 mm3) was observed within one day after
the occlusion, and the cell number had doubled by day 3 (Fig. 3(c)). In the opposite sham-treated hemisphere, little infiltration of inflammatory cells was observed (Fig. 3(c)). These results demonstrate the feasibility of monitoring complex inflammatory cascades in the deep brain tissue of mice after stroke.
Fig. 3. Visualizing immune cells in a stroke model. (a) Biopsy sites (red dots) in both hemispheres of the brain after occlusion and reperfusion of the right middle cerebral artery. (b) Images of MHC-Class-II + GFP + cells at Days 0, 1, and 3 in the right and left hemispheres. Scale bars, 100 μm. (c) The numbers of MHC-Class-II-GFP cells over time. There is a significant increase of GFP + cells in the right hemisphere. **, P<0.01; ***, P<0.001.
3.3 Imaging brain metastasis
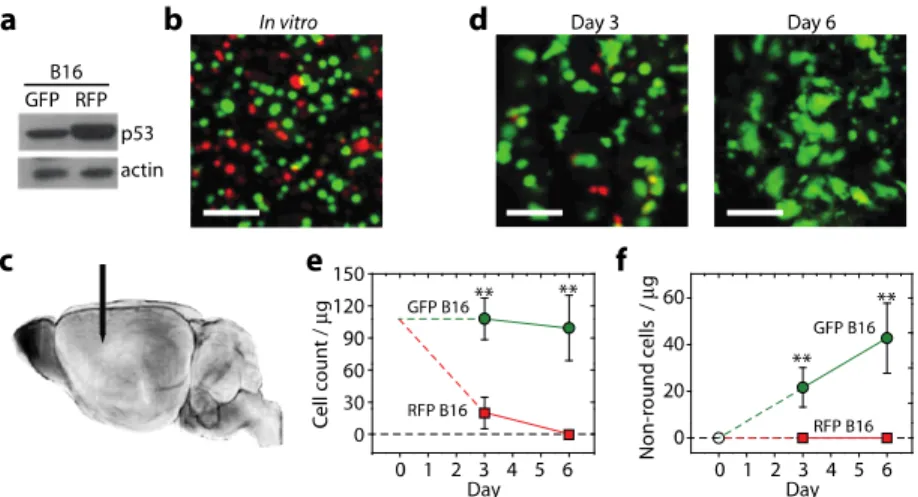
Melanoma is one of the cancers prone to brain metastasis [17]. The anti-metastatic role of p53 is known in melanoma [18]. We applied in vivo needle biopsy to visualize p53expression during metastasis of melanoma cells in the brain. First, we prepared two cell lines: GFP + , p53-low B16cells and RFP + , p53-high cells from the B16 murine melanoma cell line. The p53-high cells were selected in the presence of G418 for 7days following transfection with the p53 gene, which resulted in a two-fold increase in the expression level of p53 (Fig. 4(a)). The selected p53 over-expressing cells showed similar rates of apoptosis as the untransfected B16 and the GFP + B16 cells in vitro (Fig. 4(b)). A mixture of the RFP + cells and GFP + cells (50 millions each) was injected into the cerebral cortex at a depth of about 1.5 mm (Fig. 4(c)). In vivo imaging of the cerebral cortex at days 3 and 6 showed a rapid decrease in the number of RFP + cells, indicating the recession of cells overexpressing p53 in the early stage of dissemination. The sampling sites at days 3 and 6 were separated by 300-500 µm to avoid the artifact due to the needle-induced tissue damage occurred at Day 3 (see Section 3.4). The p53-high cells were almost completely cleared at day 6. In contrast, the density of the GFP + B16 cells was nearly invariant (Fig. 4(d)). Interestingly, the p53-low cells continued to proliferate and exhibited a marked change in cellular morphology from a round to an irregular, non-round shape over time (Fig. 4(c)). The irregular shapes are indicative of the stable settlement of these cells in the brain parenchyma. The total number of non-round p53-lowcells was found to increase linearly with time (Fig. 4(e)). Almost none of the p53-high cells remaining at day 3 exhibited an irregular morphology. Taken together, as expected, the activation of p53 inhibits the dissemination of melanoma cells in the brain, supporting that the metastatic potential of melanoma depends on the p53-regulated pathway.
Fig. 4. Assessing the brain metastasis of melanoma cells. (a) Western blots showing the normal and overexpression levels of p53 for the GFP + and RFP + B16 melanoma cells, respectively. (b) An in vitro image of a mixture of equal numbers of the GFP + and RFP + cells.(c) In vivo imaging of the injected melanoma cells in the deep cortex (blue) with the needle probe (arrow). (d) In vivo images of the melanoma cells at 3 days and 6 days after cell injection. (e) The numbers of neuronal cells, calculated per 1μg (0.001 mm3) of tissue, that were determined to be RFP + or GFP + using the side-view optical probe over a 6-day time course. (f) The numbers of irregularly shaped cells in the brain parenchyma are plotted here. Green circles represent the GFP + B16 cells; red squares represent the RFP + B16 cells. Scale bars in b and d, 100 μm. **,P<0.01. Error bars, standard deviation (n = 3).
3.4 Needle-induced cell death and side effects
While some needle-induced tissue loss is inevitable, it is important to understand the extent to which cell death occurs in the procedure. We harvested brain tissues around the biopsy sites in the cerebellum at 1 hour, Day7, andDay15 after biopsy from three different animals, respectively. Histological examination based on TUNEL staining showed that cell death occurred immediately around the insertion site within 1 hour (Fig. 5). The collateral tissue damage seemed to extend 100-200 µm from the surface of the needle, which is consistent with previous results [19]. At Day 7, cell death no longer persisted and the formation of scar tissue was observed (Fig. 5). Apoptotic regions almost completely disappeared at Day 15.
Fig. 5. Histological slides of brain sections at 1 hours (left), 7 days (middle), and 15 days (right) after needle insertion. Hematoxylin and eosin (H&E) stains of the cerebellar granular layers show the tissue damage (upper panels). In situ TUNEL (terminal deoxy- nucleotidyl transferase dUTP nick-end labeling) staining shows the apoptotic and necrotic regions across the needle’s path (lower panels). Scale bars, 100 μm.
The needle-induced damage can influence brain function to varying degrees depending on the specific insertion sites, frequency, and the size of the probe. To investigate the effect on cell death at the animal level, we performed the behavioral NSS test [13]. An optical biopsy was conducted on each animal on days 0, 14, and 27. We found that insertion of the needle into the thalamus or cerebrum did not cause a noticeable effect on the behavior (NSS = 0; n = 3) (Fig. 6(a)) [19]. However, when performed in the cerebellum, which plays a central role in motor control, the needle injection resulted in immediate and substantial behavioral impairment (NSS = 6; n = 3). The animals returned to the normal behavior (NSS = 0) in 7-10 days after each needle insertion (Fig. 6(b)), indicating a nearly full recovery even after repeated procedures.
Fig. 6. (a) The neurological severity score (NSS) results for mice (n = 3) receiving biopsy in the thalamus (triangles) and cerebrum (circles). (b) NSS results of a mouse receiving FNIB in the cerebellum. In both cases, the procedures were performed on days 0, 14, and 27, respectively.
4. Discussion
Many neurodegenerative diseases, such as multiple sclerosis, Parkinson’s, Alzheimer’s, and Huntington’s disease, are characterized by the progressive loss of the structure or function of neurons, which involves atypical protein assemblies, inflammation, and increased cell death [20,21]. We have shown that the optical needle probe can be used to quantify the amount of neuronal death and immune infiltration over time in vivo. In the chemically induced model of neuronal degeneration, fluorescence imaging revealed the occurrence of apoptotic cell death prior to the detection of behavioral impairments. This finding implies that the behavioral symptoms manifest only after substantial neuronal death occurs. The ability to visualize the cellular-level changes in the deep brain may be useful in research aimed at understanding the disease mechanisms, developing early diagnosis or treating neurodegenerative disorders [22].
Inflammation contributes to brain damage in the ischemic environment. Activated resident microglia secrete pro-inflammatory cytokines, which recruit monocytes, macrophages, and neutrophils into the ischemic lesion. The regulation of these inflammatory cells is an emerging approach for the treatment of ischemic injury after stroke [15,16]. Using optical biopsy, we showed that the number of MHC-Class-II inflammatory cells increases linearly over time in the ischemic hemisphere but not in the unaffected hemisphere. This result is supported by the histological findings of a previous cross-sectional ex vivo study [23]. The ability to observe the blood flow and the infiltration of immune cells longitudinally in living mice is expected to be useful for assessing anti-inflammatory drugs and for developing novel therapeutic strategies to treat stroke [24].
Brain metastasis is one of the most feared complications associated with cancer. Once metastasis occurs, the prognosis is poorer due to chemoresistance [25]. Optical biopsy showed a remarkable recession of p53-overexpressing cells in the early stage of dissemination in the brain. This result suggests that the activation of wild type p53 or the introduction of extrinsic p53 into metastatic melanoma may be a therapeutic option for brain metastases.
The current imaging depth is limited to <100 μm from the surface of the prism. It is possible to extend the penetration depth to 300-500 μm by using long-wavelength imaging [3]
and aberration correction [26,27]. This anticipated improvement will allow the larger tissue volume (>3 mm3) to be imaged at a single needle insertion site.
The optical probe may be used in optogenetic studies [28] for simultaneous modulation and monitoring of deep brain functions. Furthermore, this technique may be applicable to other organs, permitting the real-time examination of pathologies at the cellular level in deep tissue in quick procedures.
Acknowledgments
This work was supported by grants from National Institutes of Health (U54CA143837) and National Research Foundation of Korea (R31-2008-000-10071-0,NRF-2011-357-C00141).