R E S E A R C H A R T I C L E
Open Access
Characteristics associated with progression
in patients with of nontuberculous
mycobacterial lung disease : a prospective
cohort study
Soo Jung Kim
1, Soon Ho Yoon
2, Sun Mi Choi
3, Jinwoo Lee
3, Chang-Hoon Lee
3, Sung Koo Han
3and Jae-Joon Yim
3*Abstract
Background: Patients with distinctive morphotype were more susceptible to nontuberculous mycobacterial lung disease (NTM-LD). However, little is known about the association between body morphotype and progression of NTM-LD. The aim of this study was to elucidate predictors of NTM-LD progression, focusing on body morphotype and composition.
Methods: Data from patients with NTM-LD who participated in NTM cohort which started in 1 July 2011 were analyzed. Patients with more than 6 months of follow up were included for analysis. NTM-LD progression was defined as clinician-initiated anti-NTM treatment, based on symptomatic and radiologic aggravation. Body morphotype and composition was measured at entry to the cohort using bioelectrical impedance analysis.
Results: NTM-LD progressed in 47 out of 150 patients with more than 6 months of follow up. Patients with middle (adjusted hazard ratio [aHR], 2.758; 95% confidence interval [CI], 1.112–6.843) or lowest tertile (aHR, 3.084; 95% CI, 1.241–7. 668) of abdominal fat ratio had a higher risk of disease progression compared with the highest tertile. Other predictors for disease progression were presence of cavity on chest computed tomography (aHR, 4.577; 95% CI, 2.364–8.861), and serum albumin level <3.5 g/dL (aHR, 12.943; 95% CI, 2.588–64.718).
Conclusions: Progression of NTM-LD is associated with body composition. Lower abdominal fat ratio is an independent predictor of NTM-LD progression.
Trial registration: ClinicalTrials.gov, NCT01616745 Registered 25 March 2012
Keywords: Abdominal fat, Anthropometry, Body composition, Nontuberculous mycobacteria Background
Nontuberculous mycobacterial lung disease (NTM-LD) has been increasing prevalence in many part of the world [1–4]. Unlike Mycobacterium tuberculosis (TB), the diagnosis of NTM-LD does not necessitate initiation of therapy, and treatment should be decided based on the potential risks and benefits of therapy for individual patients [1]. Previous reports have indicated that about
half of patients with Mycobacterium avium complex (MAC) lung disease required treatment eventually [5, 6]. Given the difficulties in predicting which patients with NTM-LD will experience disease progression, an obser-vation period is usually needed to decide whether or not to initiate treatment [7, 8]. In MAC lung disease, the presence of cavities or consolidation on initial chest computed tomography (CT) was suggested to be associ-ated with disease progression and treatment [5]. Thinner chest subcutaneous fat thickness on chest CT or higher number of involved lung segments were also suggested as risk factors for radiologic deterioration [9]. Another study demonstrated that patients with M. intracellulare
* Correspondence:yimjj@snu.ac.kr
3Division of Pulmonary and Critical Care Medicine, Department of Internal
Medicine, Seoul National University College of Medicine, 101 Daehak-RoJongno-Gu, Seoul 110-744, Republic of Korea Full list of author information is available at the end of the article
© The Author(s). 2017 Open Access This article is distributed under the terms of the Creative Commons Attribution 4.0 International License (http://creativecommons.org/licenses/by/4.0/), which permits unrestricted use, distribution, and reproduction in any medium, provided you give appropriate credit to the original author(s) and the source, provide a link to the Creative Commons license, and indicate if changes were made. The Creative Commons Public Domain Dedication waiver (http://creativecommons.org/publicdomain/zero/1.0/) applies to the data made available in this article, unless otherwise stated.
lung disease, positive sputum smears, or fibrocavitary form were more likely to receive anti-NTM treatment [10].
It has been shown that patients with a distinctive body morphotype are more susceptible to NTM-LD; patients with pulmonary NTM infection were taller and leaner than controls, while skin fold and circumference measure-ments were also significantly leaner [11]. In addition, lower body mass index (BMI) [12, 13], lower percent body fat and total body fat [12], and low subcutaneous fat [14] have been reported among patients with NTM-LD.
However, little is known about the association between body morphotype or composition and the progression of NTM-LD. The objective of the present study was to elu-cidate the impact of body morphotype and composition on the progression of NTM-LD through analysis of a prospective cohort of patients with NTM-LD.
Methods
Participants
Patients with NTM-LD who participated in a previously described ongoing observational, prospective study [13], which begun on 1 July 2011 at Seoul National University Hospital were included and analyzed. Study inclusion criteria were: aged between 20 and 80 years, NTM-LD that fulfilled the diagnostic criteria reported in the 2007 American Thoracic Society/Infectious Diseases Society of America guidelines [1]. Patients previously treated for NTM-LD were excluded from this study. The clinical trial registration number for the study is NCT01616745 (www.ClinicalTrials.gov). All patients provided written informed consent before enrollment. Retrieval of data for the current study was performed on 1 April 2015. Patients followed for fewer than 6 months, and patients without follow-up CT scans, were excluded.
Study design
At study enrollment of the participants, demographic, clinical, laboratory, and radiographic data, and body morphotype characteristics were collected and analyzed. Body morphotype and composition including height, weight, BMI, total body muscle, total body fat, percent-age body fat, abdominal fat ratio, waist circumference, and hip circumference were measured using InBody 720 (Biospace Co, Seoul, South Korea) which utilized the bioelectrical impedance analysis method. This body composition analyzer assumes the body comprises five cylinders: four limbs and the trunk, and measures im-pedance of these parts separately. This method provides segmental measurement of body water and fat-free mass. The abdominal fat ratio is the ratio of fat stored in the waist to fat stored in the hips. Each morphometric meas-urement was categorized according to tertiles for ana-lysis. The levels of adipokines were also measured at study entry. Serum level of leptin was measured using
radioimmunoassay (RIA) kit (LINCO Research, Inc., U.S.A) and serum level of adiponectin was measured using an enzyme-linked immunosorbent assay (ELISA) kit (Biovendor, Brno, Czech Republic).
All patients had a chest CT scan at study entry. CT scans were evaluated by a board-certified radiologist using a previously published scoring system [15]. A total of six lung lobes (right upper lobe, right middle lobe, right lower lobe, upper division of the left upper lobe, lingular division of the left upper lobe, and left lower lobe) in each patient were assessed for the presence of lung parenchymal ab-normalities. Scores were assigned by considering the pres-ence, severity, and extent of bronchiectasis (maximum score, 9), cellular bronchiolitis (maximum score, 6), cavity (maximum score, 9), nodules (maximum score, 3), and consolidation (maximum score, 3).
Progression of NTM-LD was defined as initiation of anti-NTM treatment by the duty physician based on symptomatic (e.g., increased amount of sputum) or radiographic aggravation (e.g., cavity formation). Four of the authors (Choi, J Lee, CH Lee, and Yim) participated in the care of and discussed the treatment initiation for each patient. Patients who refused treatment despite the physician’s recommendation were also classified as hav-ing disease progression.
Mycobacterial culture and Species identification of NTM
Acid-fast bacilli (AFB) smears and mycobacterial cul-tures were performed as recommended in the standard guidelines [16]. All cultures were grown in both solid Ogawa media and the BACTEC MGIT 960 system. NTM species were identified using sequence analysis of the 16S rRNA gene by the algorithm descried in the Clinical and Laboratory Standards Institute (CLSI) guidelines [17]. Sequencing of the rpoB and tuf genes was performed for further identification. In particular, differentiation between M. abscessus and M. massiliense was based on analysis of the rpoB gene sequence [18, 19]. Taxonomy of subspecies of the M. abscessus com-plex was described based on recent suggestions [20]. Pa-tients were considered to have a mixed NTM species infection if NTM species other than the original one were isolated at least twice during the follow-up period until the start of treatment.
Statistical analysis
Baseline characteristics at the study initiation date (includ-ing age, sex, comorbidities, symptoms at initial visit, ab-normal breathing sound, anxiety, depression, St. George’s Respiratory Questionnaire (SGRQ) score, chest CT score, presence of cavities, pulmonary function, cholesterol and albumin levels, body morphotype and composition) for patients with and without disease progression were sum-marized using descriptive statistics such as proportion,
median and interquartile range (IQR). Continuous vari-ables were categorized into tertiles (for example, body morphotype and composition such as abdominal fat ratio) or appropriate categorical variables based on normal range (for example, albumin levels).
Cumulative disease progression was estimated using the Kaplan-Meier method. A cox-proportional hazard regression model was used to find predictors of disease progression. Covariates with a p- value <0.2 were used in multivariate analyses. Multivariate analyses were con-structed using the stepwise backward elimination method, which accounts for collinearity problems. All statistical analyses were performed using SPSS 18.0 (SPSS Inc., Chicago, IL, USA).
Results
Baseline patient characteristics
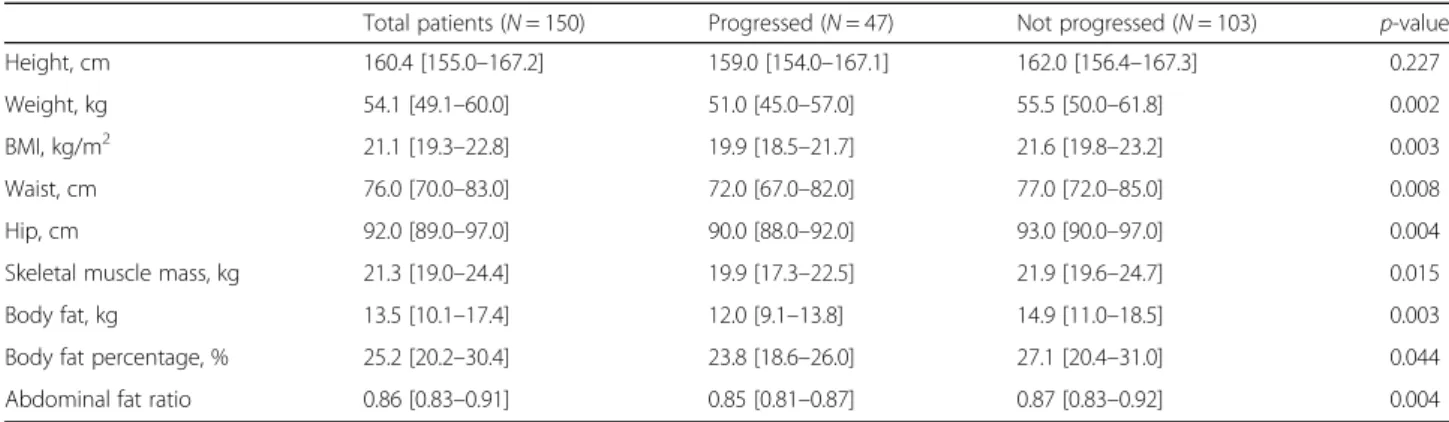
Since July 1st 2011, 207 patients with NTM-LD have been enrolled into the original study. 51 patients without follow up CT scans of the chest and six patients followed up shorter than 6 months were excluded. Finally, data for 150 patients were analyzed in the current study. The median age of the 150 patients was 64 years, 92 patients (61.3%) were female, and 110 (73.3%) were never smokers (Table 1). Median height was 160.4 cm, median weight was 54.1 kg, and median BMI was 21.1 kg/m2. Median body fat and abdominal fat ratio were 13.5 kg and 0.86 (Table 2).
Nontuberculous mycobacterial species isolated from participants
MAC was most commonly isolated from participants: M. avium (54 patients, 36.0%), M. intracellulare (40 patients, 26.7%), M. chimaera (1 patient, 0.7%), M. yongonense (1 patient, 0.7%), M. avium and M. intra-cellulare (10 patients, 6.7%), M. avium and M. chi-maera (1 patient, 0.7%), and MAC and other species (2 patients, 1.3%). M. abscessus complex (MABC) was the second most common isolate: M. abscessus subsp. abscessus (14 patients, 9.3%), M. abscessus subsp. massiliense (12 patients, 8.0%), mix of both species (4 patients, 2.7%), and MABC and other species (1 pa-tient, 0.7%) (Table 3).
Progression of nontuberculous mycobacterial lung disease
Median duration of follow-up of the 150 study partici-pants was 28 months (IQR: 18–36 months). During the study period, NTM-LD progressed in 47 of 150 patients. 1- and 2-year disease progression rates were 18.2 and 28.1%, respectively (Fig. 1). Follow-up CT scans taken before the initiation of treatment were available in 27 of 47 patients in whom NTM lung disease progressed. The proportion of patients with radiographic worsening (de-fined as a one-point increment in the CT score on
follow-up) was higher in the group that progressed than in the group that did not progress (77.8 vs. 35.9%, P < 0.001) (Table 1).
Predictors of disease progression
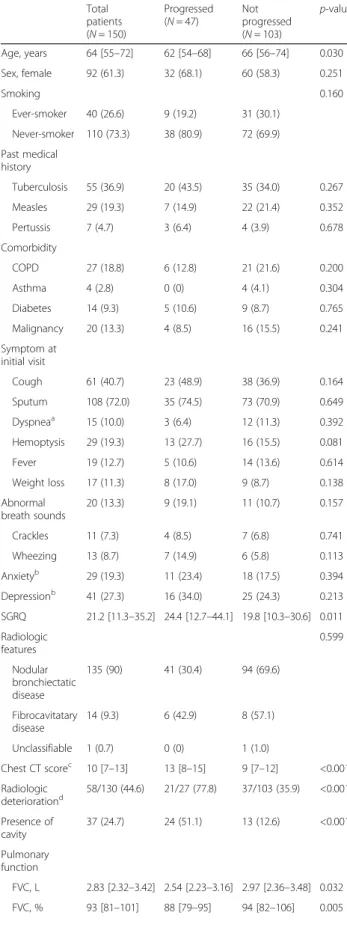
Patients with progression of NTM-LD were younger (62.0 vs. 66.0 years, p = 0.030), had higher SGRQ (24.4 vs. 19.8, p = 0.011) and chest CT (13 vs. 9, p < 0.001) scores, and lower FVC (88 vs. 94%, p = 0.005) and albu-min levels (4.2 vs. 4.3 g/dL, p = 0.031), compared with those without progression (Table 1).
Univariate analysis was performed to find predictors of disease progression. The lowest tertiles of weight, BMI, waist and hip circumference, skeletal muscle mass, body fat, and body fat percentage or abdominal fat ratio, were related to progression of NTM-LD (Table 4). Additionally, higher chest CT score, presence of cavities, serum albumin level < 3.5 g/dL, and FVC < 80% were also associated with disease progression.
The final multiple logistic regression model showed that presence of cavities (adjusted hazard ratio [aHR], 4.577; 95% CI, 2.364–8.861), middle (aHR, 2.758; 95% CI; 1.112–6.843) or low tertiles (aHR, 3.084; 95% CI, 1.241–7.668) of abdominal fat ratio, and albumin level <3.5 g/dL (aHR, 12.943; 95% CI, 2.588–64.718) were as-sociated with progression of NTM-LD (Table 5).
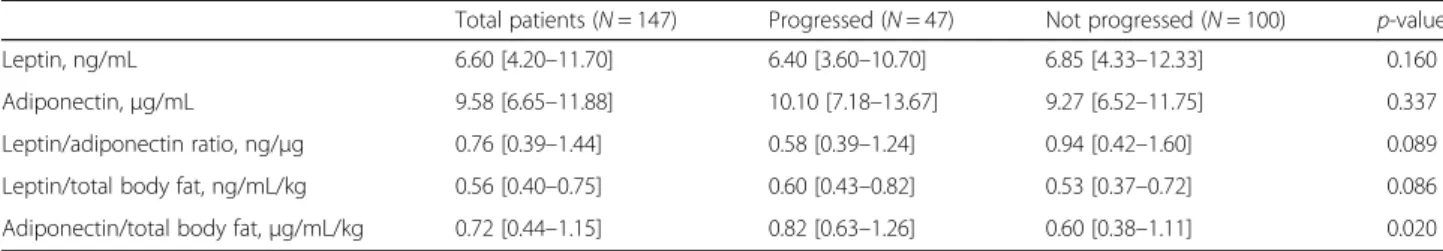
Serum adipokine levels
Serum leptin and adiponectin levels were not different between patients with or without progression of NTM-LD. However, the leptin/adiponectin ratio (0.58 vs. 0.94 ng/μg, p = 0.089) was lower, and the leptin normal-ized to total body fat ratio was higher (0.60 vs. 0.53 ng/ mL/kg, p = 0.086) among patients with progression, al-though statistical significance (p < 0.05) was not reached. The adiponectin normalized to total body fat ratio was higher among NTM-LD patients with progression (0.82 vs. 0.60 μg/mL/kg, p = 0.02) (Table 6).
Discussion
Through analysis of a cohort from a prospectively recruited, observational study, we showed that body composition (lower abdominal fat), radiographic feature (presence of cavity), and nutritional status (low serum albumin level) [21, 22] were associated with progression of NTM-LD.
Previous studies reported that presence of cavity [5] and fibrocavitary form [10, 23] of NTM-LD were associ-ated with disease progression. Our study confirmed these previous observations and suggested that a higher bacterial burden in the cavity could be the reason for this association [24, 25].
Hypoalbuminemia is associated with increased complica-tions and worse prognosis in various settings [22, 26–29]. Especially in patients with TB, a low albumin level was
negatively associated with in-hospital death and 30-day sur-vival [27]. Similarly, we demonstrated that hypoalbumin-emia was associated with progression of NTM-LD. Hypoalbuminemia could be the result of the combined ef-fects of inflammation and malnutrition. A vicious cascade of events ensues in which inflammation induces anorexia and reduces the effective use of dietary protein as well as augmenting the catabolism of the key somatic protein, al-bumin [30]. Therefore, a low alal-bumin level reflects severe inflammation, which may affect disease progression.
Our study also showed that lower abdominal fat is as-sociated with the progression of NTM-LD. In fact, previ-ous studies reported that thinner chest subcutaneprevi-ous fat thickness or low BMI were a risk factor for radiologic deterioration in MAC lung disease [9, 31]. Although dis-ease progression could cause loss of fat, the fact that self-reported BMI before diagnosis of NTM-LD was lower among patients than in the general population [11] suggests that a lower amount of fat could be a risk factor for disease progression.
It has been recognized that adipose tissue participates actively in inflammation and immunity, producing and releasing a variety of pro-and anti-inflammatory factors including adipokines, such as leptin and adiponectin [32]. Previous studies reported higher serum levels of adiponectin [33] or adiponectin normalized for total body fat [12] among patients with NTM-LD than in healthy controls. Our data also showed increased serum levels of adiponectin normalized for total body fat and decreased leptin/adiponectin ratios among patients in whom NTM-LD progressed than in patients without
Table 1 Baseline characteristics of 150 participants with nontuberculous mycobacterial lung disease at study entry
Total patients (N = 150) Progressed (N = 47) Not progressed (N = 103) p-value Age, years 64 [55–72] 62 [54–68] 66 [56–74] 0.030 Sex, female 92 (61.3) 32 (68.1) 60 (58.3) 0.251 Smoking 0.160 Ever-smoker 40 (26.6) 9 (19.2) 31 (30.1) Never-smoker 110 (73.3) 38 (80.9) 72 (69.9) Past medical history Tuberculosis 55 (36.9) 20 (43.5) 35 (34.0) 0.267 Measles 29 (19.3) 7 (14.9) 22 (21.4) 0.352 Pertussis 7 (4.7) 3 (6.4) 4 (3.9) 0.678 Comorbidity COPD 27 (18.8) 6 (12.8) 21 (21.6) 0.200 Asthma 4 (2.8) 0 (0) 4 (4.1) 0.304 Diabetes 14 (9.3) 5 (10.6) 9 (8.7) 0.765 Malignancy 20 (13.3) 4 (8.5) 16 (15.5) 0.241 Symptom at initial visit Cough 61 (40.7) 23 (48.9) 38 (36.9) 0.164 Sputum 108 (72.0) 35 (74.5) 73 (70.9) 0.649 Dyspneaa 15 (10.0) 3 (6.4) 12 (11.3) 0.392 Hemoptysis 29 (19.3) 13 (27.7) 16 (15.5) 0.081 Fever 19 (12.7) 5 (10.6) 14 (13.6) 0.614 Weight loss 17 (11.3) 8 (17.0) 9 (8.7) 0.138 Abnormal breath sounds 20 (13.3) 9 (19.1) 11 (10.7) 0.157 Crackles 11 (7.3) 4 (8.5) 7 (6.8) 0.741 Wheezing 13 (8.7) 7 (14.9) 6 (5.8) 0.113 Anxietyb 29 (19.3) 11 (23.4) 18 (17.5) 0.394 Depressionb 41 (27.3) 16 (34.0) 25 (24.3) 0.213 SGRQ 21.2 [11.3–35.2] 24.4 [12.7–44.1] 19.8 [10.3–30.6] 0.011 Radiologic features 0.599 Nodular bronchiectatic disease 135 (90) 41 (30.4) 94 (69.6) Fibrocavitatary disease 14 (9.3) 6 (42.9) 8 (57.1) Unclassifiable 1 (0.7) 0 (0) 1 (1.0) Chest CT scorec 10 [7–13] 13 [8–15] 9 [7–12] <0.001 Radiologic deteriorationd 58/130 (44.6) 21/27 (77.8) 37/103 (35.9) <0.001 Presence of cavity 37 (24.7) 24 (51.1) 13 (12.6) <0.001 Pulmonary function FVC, L 2.83 [2.32–3.42] 2.54 [2.23–3.16] 2.97 [2.36–3.48] 0.032 FVC, % 93 [81–101] 88 [79–95] 94 [82–106] 0.005
Table 1 Baseline characteristics of 150 participants with nontuberculous mycobacterial lung disease at study entry (Continued) FEV1, L 2.09 [1.76–2.48] 2.11 [1.77–2.38] 2.08 [1.73–2.51] 0.532 FEV1, % 97 [82–110] 93 [82–105] 99 [81–113] 0.205 DLCO, % 93 [80–106] 93 [80–104] 93 [81–107] 0.998 Cholesterol, mg/dL 182 [161–204] 178 [146–202] 183 [167–205] 0.229 Albumin, g/dL 4.3 [4.0–4.4] 4.2 [4.0–4.4] 4.3 [4.1–4.5] 0.031
Data are presented as median [interquartile range] or proportion (%) COPD, chronic obstructive pulmonary disease; SGRQ, St. George’s Respiratory Questionnaire; CT, computed tomography; FVC, forced vital capacity; FEV1,
forced expiratory volume in 1 s; DLCO, diffusing capacity for carbon monoxide
a
Dyspnea was defined as modified Medical Research Council score≥ 2
b
Hospital Anxiety and Depression Scale (HADS), same or > 8
c
Scores were given by considering the severity of bronchiectasis (maximum score, 9), cellular bronchiolitis (maximum score, 6), cavity (maximum score, 9), nodules (maximum score, 3) and consolidation (maximum score, 3). Maximum score possible was 30
d
Radiologic deterioration was defined as a one-point increment in the CT score on follow-up CT scans of the chest. Follow-up CT scans taken before the initiation of treatment were available in 27 out of 47 patients in whom nontuberculous mycobacterial lung disease progressed
progression. Previous reports and our study results sug-gest that a lower amount of fat, possibly associated with dysregulation of adipokines, may affect the development and progression of NTM-LD. The precise mechanism of these associations should be assessed in future studies.
Our study has some limitations. First, there is no glo-bal consensus regarding the definition of NTM-LD pro-gression. One study defined the progression of NTM-LD as initiation of treatment [10], while another defined it as radiologic deterioration [9]. We defined the progres-sion of NTM-LD as treatment required for NTM-LD by duty physicians. This could be a potential confounder because physicians might be more likely to initiate treat-ment for patients who are younger or patients with MAC rather than MABC lung disease. Second, we did not perform subgroup analysis according to each of the NTM species because of the small number of pa-tients in each group. Differences in terms of predictors
Table 2 Body morphotype and composition of 150 participants with nontuberculous mycobacterial lung disease at study entry
Total patients (N = 150) Progressed (N = 47) Not progressed (N = 103) p-value
Height, cm 160.4 [155.0–167.2] 159.0 [154.0–167.1] 162.0 [156.4–167.3] 0.227
Weight, kg 54.1 [49.1–60.0] 51.0 [45.0–57.0] 55.5 [50.0–61.8] 0.002
BMI, kg/m2 21.1 [19.3–22.8] 19.9 [18.5–21.7] 21.6 [19.8–23.2] 0.003
Waist, cm 76.0 [70.0–83.0] 72.0 [67.0–82.0] 77.0 [72.0–85.0] 0.008
Hip, cm 92.0 [89.0–97.0] 90.0 [88.0–92.0] 93.0 [90.0–97.0] 0.004
Skeletal muscle mass, kg 21.3 [19.0–24.4] 19.9 [17.3–22.5] 21.9 [19.6–24.7] 0.015
Body fat, kg 13.5 [10.1–17.4] 12.0 [9.1–13.8] 14.9 [11.0–18.5] 0.003
Body fat percentage, % 25.2 [20.2–30.4] 23.8 [18.6–26.0] 27.1 [20.4–31.0] 0.044
Abdominal fat ratio 0.86 [0.83–0.91] 0.85 [0.81–0.87] 0.87 [0.83–0.92] 0.004
Data are presented as median [interquartile range] BMI, body mass index
Table 3 Mycobacterial species isolated from 150 participants
Species Total patients (N = 150) Progressed (N = 47) Not progressed (N = 103) p-value Mycobacterium avium complex (MAC) M. avium 54 (36.0) 15 (31.9) 39 (37.9) 0.481 M. intracellulare 40 (26.7) 17 (36.2) 23 (22.3) 0.075 M. chimaera 1 (0.7) 0 (0) 1 (1.0) 1.000 M. yongonense 1 (0.7) 0 (0) 1 (1.0) 1.000 M. avium and M. intracellulare 10 (6.7) 3 (6.4) 7 (6.8) 1.000 M. avium and M. chimaera 1 (0.7) 1 (2.1) 0 (0) 0.313
MAC and othersa 2 (1.3) 1 (2.1) 1 (1.0) 0.530
M. abscessus complex (MABC) M. abscessus subsp. abscessus 14 (9.3) 4 (8.5) 10 (9.7) 1.000 M. abscessus subsp. massiliense 12 (8.0) 3 (6.4) 9 (8.7) 0.754 M. abscessus subsp. abscessus and massiliense
4 (2.7) 1 (2.1) 3 (2.9) 1.000
MABC and othersb 1 (0.7) 0 (0) 1 (1.0) 1.000
MAC and MABC 7 (4.7) 2 (4.3) 5 (4.9) 1.000
M. fortuitum 2 (1.3) 0 (0) 2 (1.9) 1.000
M. kyorinense 1 (0.7) 0 (0) 1 (1.0) 1.000
Data presented as n (%)
a
Others: M. fortuitum (1 patient), M. kansasii (1 patient)
b
Others: M. conceptionense (1 patient)
MAC, Mycobacterium avium complex; MABC, Mycobacterium abscessus complex
Fig. 1 Disease progression among 150 patients with nontuberculous mycobacterial lung disease No difference was identified in progression rate between patients with M avium complex (MAC) and M. abscessus complex (MABC) (P = 0.323)
Table 4 Predictors of disease progression: univariate analysis Unadjusted HR 95% CI p-value Age, years Q1 [<55, n = 31] Ref. Q2 [55– 64, n = 40] 0.990 0.463–2.160 0.979 Q3 [65–72, n = 36] 1.052 0.480–2.309 0.899 Q4 [>72, n = 43] 0.429 0.169–1.089 0.075 Sex Male Ref. Female 1.351 0.731–2.496 0.337 SGRQ < 25 Ref. ≥ 25 1.562 0.875–2.789 0.132 Radiologic feature
Nodular bronchiectatic disease 1
Fibrocavitary disease 1.740 0.737–4.108 0.206 Chest CT score X Ref. X + 1 1.211 1.123–1.306 <0.001 Presence of cavity Absent Ref. Present 3.750 2.086–6.739 <0.001 Cholesterol, mg/dL ≥ 200 Ref. < 200 1.263 0.673–2.371 0.467 Albumin, g/dL ≥ 3.5 Ref. < 3.5 8.942 3.097–25.818 <0.001 FVC, % ≥ 80 Ref. < 80 1.974 1.049–3.715 0.035 FEV1 ≥ 80 Ref. < 80 1.102 0.546–2.226 0.786 Height, cm High [>165, n = 48] Ref. Middle [157–165, n = 55] 1.126 0.547–2.319 0.748 Low [<157, n = 47] 1.243 0.604–2.562 0.555 Weight, kg High [>59, n = 49] Ref. Middle [50–59, n = 55] 1.935 0.861–4.347 0.110 Low [<50, n = 46] 3.146 1.437–6.885 0.004 BMI, kg/m2 High [>22, n = 52] Ref. Middle [20–22, n = 44] 1.619 0.669–3.752 0.261
Table 4 Predictors of disease progression: univariate analysis (Continued) Low [<20, n = 54] 3.211 1.538–6.705 0.002 Waist, cm High [>80, n = 50] Ref. Middle [72–80, n = 41] 1.082 0.467–2.507 0.853 Low [<72, n = 37] 2.183 1.041–4.575 0.039 Hip, cm High [>95, n = 45] Ref. Middle [90–95, n = 48] 2.062 0.890–4.780 0.092 Low [<90, n = 35] 2.485 1.041–5.929 0.040
Skeletal muscle mass, kg
High [>23, n = 41] Ref. Middle [20–23, n = 43] 1.068 0.434–2.629 0.886 Low [<20, n = 44] 2.382 1.083–5.242 0.031 Body fat, kg High [>16, n = 43] Ref. Middle [11.5–16, n = 42] 2.565 1.045–6.300 0.040 Low [<11.5, n = 43] 3.068 1.270–7.409 0.013
Body fat percentage, %
High [>29, n = 42] Ref.
Middle [22.5–29, n = 40] 2.545 1.037–6.246 0.041
Low [<22.5, n = 46] 2.609 1.081–6.296 0.033
Abdominal fat ratio
High [>0.88, n = 51] Ref.
Middle [0.84–0.88, n = 39] 2.342 1.024–5.356 0.044
Low [<0.84, n = 38] 2.987 1.302–6.851 0.010
HR, hazard ratio; CI, confidence interval; SGRQ, St. George’s Respiratory Questionnaire; CT, computed tomography; BMI, body mass index; FVC, forced vital capacity; FEV1, forced expiratory volume in 1 s; Ref, reference
Table 5 Predictors of disease progression: multivariate analysis
Adjusted HR 95% CI p-value
Abdominal fat ratio
High [>0.88, n = 51] Ref. Middle [0.84–0.88, n = 39] 2.758 1.112–6.843 0.029 Low [<0.84, n = 38] 3.084 1.241–7.668 0.015 Albumin, g/dL ≥ 3.5 Ref. < 3.5 12.943 2.588–64.718 0.002 Presence of cavity Absent Ref. Present 4.577 2.364–8.861 <0.001
for disease progression could exist among patients with NTM-LD from different species. Lastly, because we do not know the exact timing of NTM infection in an individual patient, the risk factors for progression elucidated could be the results of disease progression.
Conclusions
Progression of NTM-LD is associated with body com-position in addition to presence of cavity and hypoalbu-minemia. Lower abdominal fat ratio is an independent predictor of NTM-LD progression.
Abbreviations
BMI:Body mass index; CI: Confidence interval; COPD: Chronic obstructive pulmonary disease; CT: Computed tomography; DLCO: Diffusing capacity for carbon monoxide; FEV1: Forced expiratory volume in 1 s; FVC: Forced vital
capacity; HR: Hazard ratio; IQR: Interquartile range; MAC: Mycobacterium avium complex; NTM-LD: Nontuberculous mycobacterial lung disease; SGRQ: St. George’s Respiratory Questionnaire
Funding None.
Availability of data and material
The database supporting the conclusions of this article is included within the article.
Authors’ contributions
SJK contributed to the data analysis, manuscript preparation and reviewing the final submission. She had full access to all of the data in the study and takes responsibility for the integrity of the data and the accuracy of the data analysis. SHY contributed to the collection and analysis of radiological data. SMC, JL, CHL, and SKH, contributed substantially to the study design, data analysis and interpretation, and the writing of the manuscript. JJY is the guarantor of the entire manuscript and is responsible for the content of the manuscript, including the data collected and its analysis. All authors read and approved the final manuscript.
Competing interests
The authors declare that they have no competing interests. Consent for publication
Not applicable.
Ethics approval and consent to participate
The study protocol was approved by the Institutional Review Board of Seoul National University Hospital (IRB number: 1501-017-636) and was conducted in accordance with the amended Declaration of Helsinki. All participants pro-vided written informed consent before enrollment.
Author details
1
Division of Pulmonary and Critical Care Medicine, Department of Internal Medicine, School of Medicine, Ewha Womans University, Seoul, Republic of Korea.2Department of Radiology, Seoul National University College of
Medicine, Seoul, Republic of Korea.3Division of Pulmonary and Critical Care
Medicine, Department of Internal Medicine, Seoul National University College of Medicine, 101 Daehak-RoJongno-Gu, Seoul 110-744, Republic of Korea. Received: 25 July 2016 Accepted: 12 December 2016
References
1. Griffith DE, Aksamit T, Brown-Elliott BA, Catanzaro A, Daley C, Gordin F, et al. An official ATS/IDSA statement: diagnosis, treatment, and prevention of nontuberculous mycobacterial diseases. Am J Respir Crit Care Med. 2007; 175(4):367–416.
2. Park YS, Lee CH, Lee SM, Yang SC, Yoo CG, Kim YW, et al. Rapid increase of non-tuberculous mycobacterial lung diseases at a tertiary referral hospital in south Korea. Int J Tuberc Lung Dis. 2010;14(8):1069–71.
3. Adjemian J, Olivier KN, Seitz AE, Holland SM, Prevots DR. Prevalence of nontuberculous mycobacterial lung disease in U.S. Medicare beneficiaries. Am J Respir Crit Care Med. 2012;185(8):881–6.
4. Kendall BA, Winthrop KL. Update on the epidemiology of pulmonary nontuberculous mycobacterial infections. Semin Respir Crit Care Med. 2013;34(1):87–94.
5. Lee G, Lee KS, Moon JW, Koh WJ, Jeong BH, Jeong YJ, et al. Nodular bronchiectatic mycobacterium avium complex pulmonary disease. Natural course on serial computed tomographic scans. Ann AmThorac Soc. 2013; 10(4):299–306.
6. Boyle DP, Zembower TR, Reddy S, Qi C. Comparison of clinical features, virulence, and relapse among mycobacterium avium complex species. Am J Respir Crit Care Med. 2015;191(11):1310–7.
7. Johnson MM, Odell JA. Nontuberculous mycobacterial pulmonary infections. J Thorac Dis. 2014;6(3):210–20.
8. Thomson RM, Yew WW. When and how to treat pulmonary non-tuberculous mycobacterial diseases. Respirology. 2009;14(1):12–26.
9. Kim SJ, Park J, Lee H, Lee YJ, Park JS, Cho YJ, et al. Risk factors for deterioration of nodular bronchiectatic mycobacterium avium complex lung disease. Int J Tuberc Lung Dis. 2014;18(6):730–6.
10. Koh WJ, Jeong BH, Jeon K, Lee NY, Lee KS, Woo SY, et al. Clinical significance of the differentiation between mycobacterium avium and mycobacterium intracellulare in M avium complex lung disease. Chest. 2012;142(6):1482–8.
11. Kim RD, Greenberg DE, Ehrmantraut ME, Guide SV, Ding L, Shea Y, et al. Pulmonary nontuberculous mycobacterial disease: prospective study of a distinct preexisting syndrome. Am J Respir Crit Care Med. 2008;178(10):1066–74. 12. Kartalija M, Ovrutsky AR, Bryan CL, Pott GB, Fantuzzi G, Thomas J, et al. Patients
with nontuberculous mycobacterial lung disease exhibit unique body and immune phenotypes. Am J Respir Crit Care Med. 2013;187(2):197–205. 13. Lee AR, Lee J, Choi SM, Seong MW, Kim SA, Kim M, et al. Phenotypic,
immunologic, and clinical characteristics of patients with nontuberculous mycobacterial lung disease in Korea. BMC Infect Dis. 2013;13:558. 14. Lee SJ, Ryu YJ, Lee JH, Chang JH, Shim SS. The impact of low subcutaneous
fat in patients with nontuberculous mycobacterial lung disease. Lung. 2014; 192(3):395–401.
15. Kim HS, Lee KS, Koh WJ, Jeon K, Lee EJ, Kang H, et al. Serial CT findings of mycobacterium massiliense pulmonary disease compared with mycobacterium abscessus disease after treatment with antibiotic therapy. Radiology. 2012;263(1):260–70.
16. Della-Latta P, Weitzman I. Acid-fast stain procedures. In: Isenberg HD, editor. Essential procedures for clinical microbiology american society for microbiology, Washington, DC. 1998. p. 176–8.
Table 6 Comparison of adipokine serum levels at study entry in patients with or without disease progression
Total patients (N = 147) Progressed (N = 47) Not progressed (N = 100) p-value
Leptin, ng/mL 6.60 [4.20–11.70] 6.40 [3.60–10.70] 6.85 [4.33–12.33] 0.160
Adiponectin,μg/mL 9.58 [6.65–11.88] 10.10 [7.18–13.67] 9.27 [6.52–11.75] 0.337
Leptin/adiponectin ratio, ng/μg 0.76 [0.39–1.44] 0.58 [0.39–1.24] 0.94 [0.42–1.60] 0.089
Leptin/total body fat, ng/mL/kg 0.56 [0.40–0.75] 0.60 [0.43–0.82] 0.53 [0.37–0.72] 0.086
Adiponectin/total body fat,μg/mL/kg 0.72 [0.44–1.15] 0.82 [0.63–1.26] 0.60 [0.38–1.11] 0.020
17. Wayne PA. Interpretive criteria for identification of bacteria and fungi by DNA target sequencing; Approved guideline. CLSI document MM18-A. Clinical and Laboratory Standards Institute, Wayne, PA; 2008.
18. Simmon KE, Pounder JI, Greene JN, Walsh F, Anderson CM, Cohen S, et al. Identification of an emerging pathogen, mycobacterium massiliense, by rpoB sequencing of clinical isolates collected in the united states. J Clin Microbiol. 2007;45(6):1978–80.
19. Kim BJ, Lee SH, Lyu MA, Kim SJ, Bai GH, Chae GT, et al. Identification of mycobacterial species by comparative sequence analysis of the RNA polymerase gene (rpoB). J Clin Microbiol. 1999;37(6):1714–20.
20. Tortoli E, Kohl TA, Brown-Elliott BA, Trovato A, Cardoso Leao S, Garcia MJ, et al. Emended description of Mycobacterium abscessus, Mycobacterium abscessus subs. abscessus, Mycobacterium abscessus subsp. bolletii and designation of Mycobacterium abscessus subsp. massiliense comb. nov. Int J Syst Evol Microbiol. 2016;66(11):4471–4479.
21. Shakersain B, Santoni G, Faxen-Irving G, Rizzuto D, Fratiglioni L, Xu W. Nutritional status and survival among old adults: an 11-year population-based longitudinal study. Eur J Clin Nutr. 2015.
22. Mori S, Usami N, Fukumoto K, Mizuno T, Kuroda H, Sakakura N, et al. The significance of the prognostic nutritional index in patients with completely resected Non-small cell lung cancer. PLoS One. 2015;10(9):e0136897. 23. Kitada S, Uenami T, Yoshimura K, Tateishi Y, Miki K, Miki M, et al. Long-term
radiographic outcome of nodular bronchiectatic mycobacterium avium complex pulmonary disease. Int J Tuberc Lung Dis. 2012;16(5):660–4. 24. Koh W-J, Kim YH, Kwon OJ, Choi YS, Kim K, Shim YM, et al. Surgical
treatment of pulmonary diseases due to nontuberculous mycobacteria. J Korean Med Sci. 2008;23(3):397–401.
25. Lee Y, Song JW, Chae EJ, Lee HJ, Lee CW, Do KH, et al. CT findings of pulmonary non-tuberculous mycobacterial infection in non-AIDS immunocompromised patients: a case-controlled comparison with immunocompetent patients. Br J Radiol. 2013;86(1024):20120209. 26. Jellinge ME, Henriksen DP, Hallas P, Brabrand M. Hypoalbuminemia is a strong
predictor of 30-day all-cause mortality in acutely admitted medical patients: a prospective, observational, cohort study. PLoS One. 2014;9(8):e105983. 27. Kim HJ, Lee CH, Shin S, Lee JH, Kim YW, Chung HS, et al. The impact of
nutritional deficit on mortality of in-patients with pulmonary tuberculosis. Int J Tuberc Lung Dis. 2010;14(1):79–85.
28. Lyons O, Whelan B, Bennett K, O’Riordan D, Silke B. Serum albumin as an outcome predictor in hospital emergency medical admissions. Eur J Intern Med. 2010;21(1):17–20.
29. Numeroso F, Barilli AL, Delsignore R. Prevalence and significance of hypoalbuminemia in an internal medicine department. Eur J Intern Med. 2008;19(8):587–91.
30. Don BR, Kaysen G. Serum albumin: relationship to inflammation and nutrition. Semin Dial. 2004;17(6):432–7.
31. Yamazaki Y, Kubo K, Takamizawa A, Yamamoto H, Honda T, Sone S. Markers indicating deterioration of pulmonary mycobacterium avium-intracellulare infection. Am J Respir Crit Care Med. 1999;160(6):1851–5.
32. Falagas ME, Kompoti M. Obesity and infection. Lancet Infect Dis. 2006;6(7):438–46.
33. Tasaka S, Hasegawa N, Nishimura T, Yamasawa W, Kamata H, Shinoda H, et al. Elevated serum adiponectin level in patients with mycobacterium avium-intracellulare complex pulmonary disease. Respiration. 2010;79(5):383–7.
• We accept pre-submission inquiries
• Our selector tool helps you to find the most relevant journal • We provide round the clock customer support
• Convenient online submission • Thorough peer review
• Inclusion in PubMed and all major indexing services • Maximum visibility for your research
Submit your manuscript at www.biomedcentral.com/submit
![Table 4 Predictors of disease progression: univariate analysis (Continued) Low [<20, n = 54] 3.211 1.538 –6.705 0.002 Waist, cm High [>80, n = 50] Ref](https://thumb-ap.123doks.com/thumbv2/123dokinfo/5079332.74002/6.892.449.804.166.693/table-predictors-disease-progression-univariate-analysis-continued-waist.webp)