miR-200b and Cancer/Testis Antigen CAGE Form a Feedback
Loop to Regulate the Invasion and Tumorigenic and
Angiogenic Responses of a Cancer Cell Line to
Microtubule-targeting Drugs
*
Received for publication, July 14, 2013, and in revised form, October 29, 2013 Published, JBC Papers in Press, October 30, 2013, DOI 10.1074/jbc.M113.502047 Youngmi Kim‡1, Deokbum Park‡1, Hyuna Kim‡, Munseon Choi‡, Hansoo Lee§, Yun Sil Lee¶, Jongseon Choe储, Young Myeong Kim储, and Dooil Jeoung‡2
From the Departments of‡Biochemistry and§Biological Sciences, College of Natural Sciences, and储Graduate School of Medicine,
Kangwon National University, Chunchon 200-701 and the¶College of Pharmacy, Ewha Womans University, Seoul 120-750, Korea
Background:The microRNA that regulates the expression of CAGE is unknown.
Results:miR-200b and CAGE exert opposite regulations on the response to microtubule-targeting drugs, invasion, tumorigenic potential, and angiogenic potential.
Conclusion:CAGE and miR-200b form a feedback regulatory loop.
Significance:miR-200b may be a target for the treatment of CAGE-driven cancers.
Cancer/testis antigen cancer-associated gene (CAGE) is known to be involved in various cellular processes, such as pro-liferation, cell motility, and anti-cancer drug resistance. How-ever, the mechanism of the expression regulation of CAGE remains unknown. Target scan analysis predicted the binding of microRNA-200b (miR-200b) to CAGE promoter sequences. The expression of CAGE showed an inverse relationship with miR-200b in various cancer cell lines. miR-200b was shown to bind to the 3ⴕ-UTR of CAGE and to regulate the expression of CAGE at the transcriptional level. miR-200b also enhanced the sensitivities to microtubule-targeting drugs in vitro. miR-200b and CAGE showed opposite regulations on invasion potential and responses to microtubule-targeting drugs. Xenograft exper-iments showed that miR-200b had negative effects on the tumorigenic and metastatic potential of cancer cells. The effect of miR-200b on metastatic potential involved the expression regulation of CAGE by miR-200b. miR-200b decreased the tumorigenic potential of a cancer cell line resistant to microtu-bule-targeting drugs in a manner associated with the down-reg-ulation of CAGE. ChIP assays showed the direct regdown-reg-ulation of miR-200b by CAGE. CAGE enhanced the invasion potential of a cancer cell line stably expressing miR-200b. miR-200b exerted a negative regulation on tumor-induced angiogenesis. The down-regulation of CAGE led to the decreased expression of plasmin-ogen activator inhibitor-1, a TGF-responsive protein involved in angiogenesis, and VEGF. CAGE mediated tumor-induced angiogenesis and was necessary for VEGF-promoted angiogen-esis. Human recombinant CAGE protein displayed angiogenic potential. Thus, miR-200b and CAGE form a feedback
regula-tory loop and regulate the response to microtubule-targeting drugs, as well as the invasion, tumorigenic potential, and angio-genic potential.
Cancer/testis antigen CAGE3was identified by serological analysis of the recombinant cDNA expression library using the sera of patients with gastric cancers (1). CAGE contains the DEAD box domain and encodes a putative protein of 630 amino acids with possible helicase activity (1). CAGE is expressed in a variety of cancers but not in normal tissues except for testis (1). This makes CAGE a valuable target of antitumor immunother-apy. CAGE enhances cellular proliferation, and CAGE-derived peptides induce cytolytic T lymphocyte activity (2). CD8⫹ T cells presensitized with these peptides display cytotoxic effects against cancer cells expressing CAGE (2).
CAGE is present in the sera of patients with gastric cancers (1), endometrial cancers (3), and patients with hematological malignancies (4). The methylation status of the CpG sites of CAGE determines its expression (5). The hypomethylation of CAGE precedes the development of gastric cancer and hepato-cellular carcinoma (5). This suggests that the high frequencies of hypomethylation of CAGE in various cancers would be val-uable as a cancer diagnostic marker. These reports suggest that CAGE can be a valuable marker for the detection of cancers.
The expression of CAGE is increased in cancer cell lines resistant to microtubule-targeting drugs (6). CAGE, through interaction with HDAC2, represses the expression of p53 and confers resistance to microtubule-targeting drugs (5). CAGE possesses oncogenic potential and promotes cell cycle progres-sion by inducing AP-1- and E2F-dependent expresprogres-sion of cyclins D1 and E (7).
*This work was supported by National Research Foundation Grants 2010-0021357, 2011-0010867, 2012H1B8A2025495, and C1008749-01-01 and by National R&D Program for Cancer Control, Ministry for Health and Wel-fare, Republic of Korea Grant 1320160.
1Both authors contributed equally to this work.
2To whom correspondence should be addressed: Dept. of Biochemistry, Col-lege of Natural Sciences, Kangwon National University, Chunchon 200-701, Korea. Tel.: 82-33-250-8518; Fax: 82-33-259-5664; E-mail: jeoungd@ kangwon.ac.kr.
3The abbreviations used are: CAGE, cancer-associated gene; CAM, chick cho-rioallantoic membrane; EMT, epithelial-mesenchymal transition; miR-200b, microRNA-200b; PAI-1, plasminogen activator inhibitor-1; qRT-PCR, quantitative real time PCR; HUVEC, human umbilical vein endothelial cell; EGFR, EGF receptor; DIG, digoxigenin.
THE JOURNAL OF BIOLOGICAL CHEMISTRY VOL. 288, NO. 51, pp. 36502–36518, December 20, 2013 © 2013 by The American Society for Biochemistry and Molecular Biology, Inc. Published in the U.S.A.
at Ewha Medical Library on July 5, 2016
http://www.jbc.org/
miRNAs are a class of endogenous, 18 –25-nucleotide, non-coding RNAs that regulate the expression of target genes either through translational inhibition or destabilization of mRNA (8). miRNAs play important roles in tumor development by regulating the expression of various oncogenes and tumor sup-pressor genes (8). miRNAs suppress tumorigenicity and multi-drug resistance. For example, miR-199a suppresses tumorige-nicity and multidrug resistance of ovarian cancer-initiating cells (9). miR-200b in the renal cell carcinoma cell line inhibits cell proliferation and migration, suggesting that miR-200b functions as tumor suppressors in the renal cell carcinoma (10). miR-200b is decreased in taxol-resistant human non-small cell lung carcinoma cells (SPC-A1) (11). miR-200b reverses the phenotype of epithelial-mesenchymal transition (EMT) in drug-resistant human tongue cancer cells and sensitizes them to chemotherapy (12). The up-regulation of miR-200b leads to the reversal of EMT in gemcitabine-resistant pancreatic cancer cells (13). miR-200b reverses the chemo-resistance of taxol by targeting E2F3 and by cell proliferation inhibition and apopto-sis enhancement (14). miR-200b reverses reapopto-sistance to epider-mal growth factor receptor therapy by regulating the EMT process (15). Notch-1 induces an EMT consistent with cancer stem cell phenotype in pancreatic cancer cells by down-regu-lating the expression of 200b (16). Re-expression of miR-200b leads to the decreased expression of ZEB1 and vimentin and the increased expression of E-cadherin (16). miR-200b is involved in the Smad 3 pathway by regulating the expression of E-cadherin (17). miR-200b regulates EMT by targeting ZEB1 and SIP1 (18). Tamoxifen down-regulates miR-200b and pro-motes EMT by up-regulating c-Myc (19). These reports suggest roles of miR-200b in tumorigenesis, anti-cancer drug resis-tance, and EMT.
A number of miRNAs have been known to have pro- or anti-angiogenic effects. For example, miR-210 (20) and miR-29a (21) promotes angiogenesis whereas miR-200b inhibits angiogene-sis (22). Vasohibin-2 promotes angiogeneangiogene-sis by exerting a neg-ative regulation on the expression of miR-200b (23). miR-200b mimic prevents diabetes-induced increased VEGF expression, glucose-induced increased permeability, and angiogenesis (24). miR-200b binds to 3⬘-UTR of VEGFA promoter sequences to repress the expression of VEGF (24). The down-regulation of endothelial miR-200b promotes cutaneous wound angiogene-sis by inducing the expression of GATA-binding protein 2 and VEGFR2 (25). miR-200b targets Ets-1, and the down-regulation of miR-200b induces an angiogenic response (26). Overexpres-sion of Ets-1 rescues miR-200b-dependent impairment in angiogenic response (26). CAGE is a member of the Ets family transcription factors (5). These reports (5, 26) imply a role of CAGE in angiogenesis and the possibility of a feedback regula-tory loop between CAGE and miR-200b.
A number of reports suggest a close relationship between CAGE and miR-200b. Previous reports imply that CAGE may serve as a target of miR-200b. Although the roles of CAGE in tumorigenesis and anti-cancer resistance have been demon-strated, the effect of CAGE on tumor-induced angiogenesis remains unknown. Based on previous reports, we hypothe-sized that CAGE and miR-200b would form a feedback reg-ulatory loop and regulate various cellular processes, such as
response to anti-cancer drugs, invasion, tumorigenic poten-tial, and angiogenesis.
In this study, we examined the possibility of a feedback reg-ulatory loop between CAGE and miR-200b. We examined the effect of miR-200b on the expression of CAGE and vice versa. We demonstrated that miR-200b and CAGE exerted opposite regulations on in vitro response to microtubule-targeting drugs, and the invasion potential of cancer cells is demon-strated. We investigated the effect of CAGE and miR-200b on the invasion potential of cancer cells. We found that miR-200b decreased the tumorigenic potential of cancer cells in a manner associated with the down-regulation of CAGE. Evidence of the involvement of CAGE in tumor-induced angiogenesis and VEGF-promoted angiogenesis was demonstrated. In this study, we revealed that miR-200b is a novel regulator of CAGE, which may provide a therapeutic target for the treatment of CAGE-driven cancers.
EXPERIMENTAL PROCEDURES
Cell Lines and Cell Culture—Cancer cell lines used in this study were cultured in Dulbecco’s modified minimal essential medium (DMEM; Invitrogen) supplemented with heat-inacti-vated 10% fetal bovine serum (FBS, Invitrogen) and antibiotics at 37 °C in a humidified incubator with a mixture of 95% air and 5% CO2. SNU387
Ror Malme3MRcells stably expressing miR-200b were generated by transfection of miR-miR-200b cloned into pcDNA3.1 vector. Stable transfectants were selected by G418 (400g/ml). Cancer cell lines made resistant to celastrol or taxol were established by stepwise addition of celastrol or taxol. Malme3MR, SNU387R, or AGSRcells denote cells selected for resistance to celastrol. Cells surviving drug treatment (attached fraction) were obtained and used throughout this study. SNU387R-AS-CAGE or Mame3MR-AS-CAGE cell line was established by transfection with anti-sense CAGE cDNA. Human umbilical vein endothelial cells (HUVECs) were iso-lated from human umbilical cord veins by collagenase treat-ment and used in passages 3– 6. The cells were grown in M199 medium supplemented with 20% fetal bovine serum, 100 units/ml penicillin G, 100g/ml streptomycin, 3 ng/ml bFGF (Upstate Biotechnology, Waltham, MA), and 5 units/ml hepa-rin at 37 °C under 5% CO2, 95% air.
Materials—Anti-mouse and anti-rabbit IgG-horseradish peroxidase conjugate antibodies were purchased from Pierce. An enhanced chemiluminescence (ECL) kit was purchased from Amersham Biosciences. Lipofectamine and PlusTM rea-gent were purchased from Invitrogen. Bioneer (Daejeon, Korea) synthesized all primers used in this study. Human recombinant VEGF protein was purchased from Millipore. Human recombinant CAGE protein was purchased from Abnova.
Western Blot Analysis—Western blot analysis and immuno-precipitation were performed according to the standard proce-dures (6). For analysis of proteins from tumor tissues, frozen samples were ground to a fine powder using a mortar and pestle over liquid nitrogen. Proteins were solubilized in RIPA buffer containing protease inhibitors, and insoluble material was removed by centrifugation.
miR-200b and CAGE Form a Feedback Loop
at Ewha Medical Library on July 5, 2016
http://www.jbc.org/
Northern Blot—Total RNAs were isolated by TRIzol reagent according to the protocol of the manufacturer (Invitrogen). RNA samples (10g) were denatured with formaldehyde, elec-trophoresed in 1% agarose gels containing 2.2Mformaldehyde
in MOPS buffer, and blotted to a nylon membrane (Pierce). A DIG-labeled CAGE probe was generated with a DIG-PCR amplification kit (Roche Applied Science). Northern hybridiza-tion was performed in buffer containing 5⫻ SSC, 50% formam-ide, 0.1% N-lauroylsarcosine, 0.02% SDS, and 2% blocking rea-gent (Roche Applied Science) at 68 °C for 12 h. The membrane was washed with 2⫻ SSC containing 0.1% SDS at room temper-ature for 30 min and with 0.1⫻ SSC containing 0.1% SDS at 68 °C for 45 min and incubated with alkaline phosphatase-con-jugated anti-DIG antibody (Roche Applied Science). For the detection of the hybridized probe, the membrane was soaked in CDP-Star chemiluminescence substrate (Roche Applied Sci-ence) and exposed to x-ray film, which was processed for imag-ing. As a loading control, the membrane was used for re-hybrid-ization with a DIG-labeled probe of actin.
Cell Viability Determination—The cells were assayed for their growth activity using the 3-(4,5-dimethylthiazol-2-yl)-2,5-diphenyltetrazolium bromide (Sigma). Viable cell number counting was carried out by trypan blue exclusion assays.
Anchorage-independent Growth Assays —Anchorage-inde-pendent growth assays were performed according to the man-ufacturer’s instructions (Millipore). The assays were done in 96-well plates, and the plates were incubated at 37 °C for 21–28 days. Anchorage-independent growth was evaluated by using the cell stain solution. Stained colonies were counted using a microscope, and the intensity of staining was quantified by measuring absorbance at 490 nm.
Annexin V-FITC Staining—Apoptosis determination was carried out by using annexin V-FITC according to the manu-facturer’s instructions (Biovision). Ten thousand cells were counted for three independent experiments.
RNA Extraction and Quantitative Real Time PCR—Total miRNA was isolated using the mirVana miRNA isolation kit (Ambion). miRNA was extended by a poly(A) tailing reaction using the A-Plus poly(A) polymerase tailing kit (CellScript). cDNA was synthesized from miRNA with poly(A) tail using a poly(T) adaptor primer and qScriptTM reverse transcriptase (Quanta Biogenesis). Expression levels of miR-200b were quan-tified with a SYBR Green qRT-PCR kit (Ambion) using a miRNA-specific forward primer and a universal poly(T) adap-tor reverse primer. The expression of miR-200b was defined based on the threshold (Ct), and relative expression levels were
calculated as 2⫺((Ctof miR-200b)⫺ (Ctof U6)) after normalization
with reference to expression of U6 small nuclear RNA. For quantitative PCR, SYBR PCR Master Mix (Applied Biosystems) was used in a CFX96 real time system thermocycler (Bio-Rad). For detection of CAGE mRNA level, total RNA was isolated using TRIzol (Invitrogen), and 1g of total RNA was used to synthesize complementary DNA using random primers and reverse transcriptase (SuperScript II RT; Invitrogen). The mRNA level for CAGE was normalized to the-actin value, and relative quantification was determined using the⌬C model pre-sented by PerkinElmer Life Sciences.
ChIP Assays—Assays were performed according to the man-ufacturer’s instructions (Upstate Biotechnology). For detection of binding the protein of interest to miR-200b promoter sequences, specific primers of miR-200b promoter-1 sequences
(5⬘-CACCCCCTGCCCTCAGAC-3⬘ (sense) and
5⬘-CCCAC-GTGCTGCCTTGTC-3⬘ (antisense)), miR-200b promoter-2 sequences (5⬘-CTTCCTATGGGACCACCCAG-3⬘ (sense) and
5⬘-GGGCACTGAGGACAGCATC-3⬘ (antisense)), and
miR-200bpromoter-3 sequences (5
⬘-GGTGGAAGGTGCCAGAA-AAC-3⬘ (sense) and 5⬘-CTGGAGCCCAGAGACCCTA-3⬘
(antisense)) were used. For detection of binding the protein of interest to the E-cadherin promoter sequences, specific primers of E-cadherin promoter-1 sequences (5
⬘-ACAGAGCATTTA-TGGCTCAAG-3⬘ (sense) and
5⬘-TCATGGGTTAGTGAGT-CAGC-3⬘ (antisense)) and E-cadherin promoter-2 sequences
(5⬘-AAGCCCTTTCTGATCCCAGG-3⬘ (sense) and
5⬘-CGC-TGATTGGCTGAGGGT-3⬘ (antisense)) were used in the
miR-200b and pGL3–3⬘-UTR-CAGE construct.
To generate miR-200b expression vector, a 330-bp genomic fragment encompassing the primary miR-200b gene was PCR-amplified and cloned into BamHI/XhoI site of pcDNA3.1 vec-tor. To generate the pGL3–3⬘-UTR-CAGE construct, a 136-bp human CAGE gene segment encompassing 3⬘-UTR was PCR-amplified and subcloned into the XbaI site of pGL3 luciferase plasmid. The mutant pGL3–3⬘-UTR-CAGE construct was made with the QuikChange site-directed mutagenesis kit (Stratagene). Luciferase activity assay was performed according to the instruction manual (Promega).
Transfection—Transfections were performed according to the manufacturer’s instructions. Lipofectamine and Plus reagents (Invitrogen) were used. The construction of siRNA was carried out according to the instruction manual provided by the manufacturer (Ambion, Austin, TX). For miR-200b knockdown, cells were transfected with 200 nMof oligonucleo-tide (inhibitor) with Lipofectamine 2000 (Invitrogen), accord-ing to the manufacturer’s protocol. The sequences used were
5⬘-UCAUCAUUACCCAGUAUUA-3⬘ (miR-200b inhibitor)
and 5⬘-GCAUAUAUCUAUUCCACUA-3⬘ (control inhibitor).
In Vivo Metastasis Assay—Female athymic nude mice were used for the studies. Cells evaluated included Malme3M, Malme3MR, and Malme3MR-miR-200b. Cells (106cells in PBS) were injected intravenously into the tail vein of 4-week-old athymic nude mice, and the extent of lung metastasis was eval-uated. Control inhibitor (50M/kg) or miR-200b inhibitor (50
M/kg) was injected intravenously into the tail vein of athymic
nude mice five times. Four weeks after injection of cancer cells, surface metastatic nodules per lung were determined.
In Vivo Tumorigenic Potential—Athymic nude mice (BALB/c nu/nu, 5– 6-week-old females) were obtained from Orient Bio Inc. (Seoul, Korea) and were maintained in a laminar air-flow cabinet under aseptic conditions. Cancer cells (1 ⫻ 106) of interest were injected subcutaneously into the dorsal flank area of the mice. Tumor volume was determined by direct measurement with calipers and calculated by the following for-mula: length⫻ width ⫻ height ⫻ 0.5. To determine the effect of miR-200b on in vivo tumorigenic potential, control inhibitor (40g/kg or 50 M/kg) or miR-200b inhibitor (40g/kg or 50
miR-200b and CAGE Form a Feedback Loop
at Ewha Medical Library on July 5, 2016
http://www.jbc.org/
M/kg) was injected via the tail vein seven times at a total of 37
days.
Chemoinvasion Assays—The invasion potential was deter-mined by using a transwell chamber system with 8-m pore polycarbonate filter inserts (CoSTAR, Acton, MA). The lower and upper sides of the filter were coated with gelatin and Matri-gel, respectively. Trypsinized cells (5⫻ 103) in the serum-free RPMI 1640 medium containing 0.1% bovine serum albumin were added to each upper chamber of the transwell. RPMI 1640 medium supplemented with 10% fetal bovine serum was placed in the lower chamber, and cells were incubated at 37 °C for 16 h. The cells were fixed with methanol, and the invaded cells were stained and counted. To determine the effect of miR-200b on invasion potential, cells of interest were transfected with miR-200b construct (1g) or miR-200b inhibitor (200 nM). 48 h after
transfection, the invasion potential of cancer cells was deter-mined. To determine the effect of CAGE on invasion of HUVECs, conditioned medium obtained from each cancer cell line was placed onto the lower chamber of the transwell. The trypsinized HUVECs (4⫻ 104) in M199 medium containing 0.1% bovine serum albumin and 1% FBS were added to the
upper chamber of the transwell. The number of invading cells was determined at 24 h after addition of HUVECs.
Endothelial Cell Tube Formation Assays—Growth factor-re-duced Matrigel was pipetted into prechilled 24-well plates (200 l of Matrigel per well) and polymerized for 30 min at 37 °C. The HUVECs were placed onto a layer of Matrigel in 1 ml of M199 containing 1% FBS. After 6 – 8 h of incubation at 37 °C in a 95:5% (v/v) mixture of air and CO2, the endothelial cells were photographed using an inverted microscope (magnification, ⫻100; Olympus). Tube formation was observed using an inverted phase contrast microscope. Images were captured with a videograph system. The degree of tube formation was quantified by measuring the length of tubes in five randomly chosen low power fields (⫻100) from each well using the Image-Pro Plus Version 4.5 (Media Cybernetics, San Diego).
Intravital Microscopy—Male BALB/c mice (6 – 8 weeks old) were obtained from Daehan Biolink (Korea). In vivo angiogen-esis was assessed as follows. The mice were anesthetized with 2.5% avertin (v/v) via intraperitoneal injection (Surgivet), and abdominal wall windows were implanted. Next, a titanium cir-cular mount with eight holes on the edge was inserted between FIGURE 1. Expression level of miR-200b shows an inverse relationship with CAGE. A, expression level of miR-200b in each cell line was determined by qRT-PCR. Each value represents an average obtained from three independent experiments. Data are expressed as a mean⫾ S.D. **, p ⬍ 0.005; ***, p ⬍ 0.0005. B, cell lysate prepared from each cell line was subjected to Western blot analysis. C, indicated cell line was treated with or without celastrol (100 nM) or taxol (100 nM) for various time intervals. The expression level of miR-200b was determined by qRT-PCR. Each value represents an average obtained from three indepen-dent experiments. Data are expressed as a mean⫾ S.D. ***, p ⬍ 0.0005; ###, p ⬍ 0.0005. Comparison was made between the cells treated with celastrol or taxol and the cells untreated. *** denotes statistical significance in response to celastrol. ### denotes statistical significance in response to taxol. D, same as C except that Western blot analysis was performed.
miR-200b and CAGE Form a Feedback Loop
at Ewha Medical Library on July 5, 2016
http://www.jbc.org/
the skin and the abdominal wall. Growth factor-reduced Matri-gel containing conditioned medium was applied to the space between the windows, and a circular glass coverslip was placed on top and fixed with a snap ring. After 4 days, the animals were anesthetized and injected intravenously with 50l of 25 ng/ml fluorescein isothiocyanate-labeled dextran (Mr⬃2,000,000) via the tail vein. The mice were then placed on a Zeiss Axiovert 200 M microscope. The epi-illumination microscopy setup included a 100-watt mercury lamp and filter set for blue light. Fluorescence images were recorded at random locations of each window using an electron-multiplying charge-coupled device camera (Photo Max 512, Princeton Instruments) and digitalized for subsequent analysis using the Metamorph pro-gram (Universal Imaging). The assay was scored from 0 (nega-tive) to 5 (most posi(nega-tive) in a double-blind manner.
In Vivo Matrigel Plug Assay—Seven-week-old BALB/c mice (DBL Co., Ltd., Korea) were injected subcutaneously with 0.1 ml of Matrigel containing conditioned medium and 10 units
of heparin (Sigma). The injected Matrigel rapidly formed a single and solid gel plug. After 8 days, the skin of the mouse was easily pulled back to expose the Matrigel plug, which remained intact.
Aortic Ring Formation Assays—In brief, 96-well plates were coated with 30l of Matrigel per well and polymerized in an incubator. Aortas isolated from 6-week-old male Sprague-Dawley rats were cleared of periadventitial fat and connective tissues in cold PBS and cut into rings of 1–1.5 mm in circum-ference. The aortic rings were randomized into wells and sealed with a 30-l overlay of Matrigel. PBS, conditioned medium, recombinant VEGF protein, or recombinant CAGE protein was added. After 6 days, the extent of micro vessel sprouting was determined by using an inverted microscope (magnification, ⫻100; Olympus). The assay was scored from 0 (negative) to 5 (most positive) in a double-blind manner. Conditioned medium was also employed to examine the effect of CAGE on aortic ring formation.
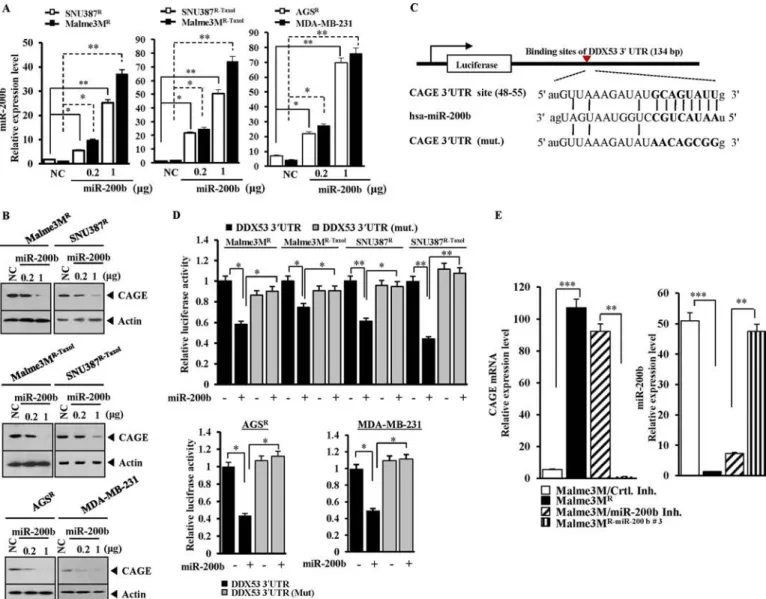
FIGURE 2. miR-200b targets CAGE. A, indicated cell line was transfected with control vector (NC, 1g) or miR-200b construct (0.2, 1 g). 48 h after transfection, qRT-PCR was performed. *, p⬍ 0.05; **, p ⬍ 0.005. B, same as A except that Western blot analysis was performed. NC, negative control vector. C, potential binding of miR-200b to 3⬘-UTR-CAGE. D, wild type Luc-CAGE-3⬘-UTR or mutant Luc-CAGE-3⬘-UTR was transfected along with control vector (⫺) or miR-200b construct (⫹) into the indicated cell line. 48 h after transfection, luciferase activity was performed as described. E, Malme3M cells were transfected with control inhibitor (200 nM) or miR-200b inhibitor (200 nM). 48 h after transfection, mRNAs were prepared from the indicated cancer cells and subjected to qRT-PCR. miRNAs were also isolated from the indicated cancer cells and subjected to qRT-PCR. ***, p⬍ 0.005.
miR-200b and CAGE Form a Feedback Loop
at Ewha Medical Library on July 5, 2016
http://www.jbc.org/
Chick Chorioallantoic Membrane (CAM) Assay—Chick CAM assay was carried out as described previously (11). Briefly, salt-free solution (10l) containing recombinant VEGF (final at 20 ng/ml) or recombinant CAGE (final 20 ng/ml) was applied to Thermanox discs, and incubation was continued for 30 min. The discs were loaded onto the CAM of 9-day-old embryos. After 5 days of incubation at 37 °C, the area around the loaded disc was photographed with a digital camera, and the number of newly formed vessels was counted inside the disc area. Condi-tioned medium of Malme3M, Malme3MR, or Malme3MR -AS-CAGE was also employed to determine the effect of -AS-CAGE on blood vessel formation based on CAM assays.
Cytokine Array Analysis—Expression levels of cytokines were determined by using Proteom ProfilerTMmouse cytokine array kit (R&D Systems, Minneapolis, MN) according to the manufacturer’s instructions.
Statistical Analysis—Statistical differences in this were determined by using the Student’s t test.
RESULTS
miR-200b Is Decreased in Cancer Cell Lines Resistant to Microtubule-targeting Drugs—Previously, the role of CAGE in anti-cancer drug resistance was reported (6). However, fac-tor(s) that regulate the expression of CAGE remain unknown. It was hypothesized that miRNAs that are decreased in cancer cell
lines resistant to anti-cancer drugs would regulate the expres-sion of CAGE. To identify these miRNAs, miRNA array analysis was performed, which revealed that miR-200b was greatly decreased in Malme3MR, a melanoma cell line resistant to celastrol (data not shown). Several reports suggest a possible feedback regulatory loop between CAGE and miR-200b (5, 26). qRT-PCR was performed to examine the expression level of miR-200b in various cancer cell lines. miR-200b showed lower expression in SNU387Rand SNU387R-Taxol, hepatic cancer cell lines made resistant to celastrol and taxol, respectively, than in non-resistant counterparts (Fig. 1A). miR-200b also showed lower expression in Malme3MR and Malme3MR-Taxol, mela-noma cell lines made resistant to celastrol and taxol, respec-tively (Fig. 1A). AGS, a gastric cancer cell line, showed a higher expression of miR-200b than AGSR, a gastric cancer cell line made resistant to celastrol (Fig. 1A). MDA-MB-231, a malig-nant breast cancer cell line, showed lower expression level of miR-200b than MCF-7, a less malignant breast cancer cell line (Fig. 1A). The expression of CAGE was higher in cancer cell lines resistant to microtubule-targeting drugs than in cancer cell lines sensitive to microtubule-targeting drugs (Fig. 1B). Cancer cell lines resistant to microtubule-targeting drugs showed higher expression levels of tubulin3 and MDR1 (Fig. 1B). The increased expression level of tubulin3 is closely FIGURE 3. miR-200b confers sensitivity to microtubule-targeting drugs. A, indicated cell line was transfected with control vector (NC) (1g) or miR-200b (1 g). 24 h after transfection, cells were treated with or without various concentrations of celastrol or taxol for 24 h, followed by 3-(4, 5-dimethylthiazol-2-yl)-2,5-diphenyltetrazolium bromide assays. *, p⬍ 0.05; **, p ⬍ 0.005; #, p ⬍ 0.05; ##, p ⬍ 0.005. Comparison was made between cells transfected with miR-200b construct and cells transfected with control vector. * and ** denote statistical difference in response to taxol. # and ## denote statistical difference in response to celastrol (CEL). B, indicated cell line was transfected with control vector (NC) or miR-200b construct. 24 h after transfection, cells were treated with or without celastrol (1M) or taxol (1M) for 24 h, followed by Western blot analysis. PARP, poly(ADP-ribose) polymerase.
miR-200b and CAGE Form a Feedback Loop
at Ewha Medical Library on July 5, 2016
http://www.jbc.org/
related to taxol resistance (27). Celastrol and taxol decreased the expression of miR-200b in SNU387, Malme3M, AGS, and MCF-7 cells based on qRT-PCR (Fig. 1C), suggesting that the down- regulation of miR-200b is associated with resistance to microtubule-targeting drugs. Celastrol and taxol increased the expression of CAGE and MDR1 in SNU387, Malme3M, AGS, and MCF-7 cells (Fig. 1D). Taken together, these results suggest that the down-regulation of miR-200b and the increased expression of CAGE may result in resistance to microtubule-targeting drugs.
miR-200b Directly Regulates the Expression of CAGE —Be-cause miR-200b showed an inverse relationship with CAGE (Fig. 1, A and B), it was hypothesized that miR-200b might regulate the expression of CAGE. The transfection of miR-200b in SNU387R, SNU387R-Taxol, Malme3MR, Malme3MR-Taxol, AGSR, and MDA-MB-231 cells (Fig. 2A) decreased the expres-sion of CAGE (Fig. 2B). Target scan analysis predicted the bind-ing of miR-200b to 3⬘-UTR of CAGE (Fig. 2C). The transfection of miR-200b decreased the luciferase activity of the Luc-3⬘-wild type UTR of CAGE but not Luc-3⬘-mutant UTR of CAGE in
cancer cell lines resistant to microtubule-targeting drugs (Fig. 2D). Malme3MR cells showed a higher expression level of CAGE mRNA than Malme3M cells based on qRT-PCR (Fig. 2E). The stable expression of miR-200b decreased the CAGE mRNA level in Malme3MR(Fig. 2E). The transfection of miR-200b inhibitor in Malme3M cells increased the expression level of CAGE mRNA (Fig. 2E). Taken together, these results suggest that miR-200b targets CAGE.
miR-200b Regulates the Response to Microtubule-targeting Drugs in Vitro—Because miR-200b targets CAGE, the effect of miR-200b on the response to microtubule-targeting drugs was next investigated. The transfection of miR-200b enhanced the sensitivity of SNU387R/Malme3MR, SNU387R-Taxol/ Malme3MR-Taxol, AGSR, and MDA-MB231 cells to celastrol and taxol (Fig. 3A). The transfection of miR-200b enhanced the cleavage of poly(ADP-ribose) polymerase in response to celas-trol and taxol in these anti-cancer drug-resistant cancer cell lines (Fig. 3B). miR-200b inhibitor decreased the expression of miR-200b in Malme3MR/SNU387Rcells that stably express miR-200b (Malme3MR miR-200b/SNU387R-miR-200b) (Fig. 4A). FIGURE 4. Inhibition of miR-200b induces resistance to microtubule-targeting drugs and increases expression of CAGE. A, Malme3MRcells stably expressing miR-200b (Malme3MR-miR-200b) or SNU387Rcells stably expressing miR-200b (SNU387R-miR-200b) were transfected with control inhibitor (200 nM) or miR-200b inhibitor (200 nM). 48 h after transfection, qRT-PCR was performed as described. miRNA isolated from Malme3MRor SNU387Rcells transfected with control inhibitor was also subjected to qRT-PCR.**, ***, p⬍ 0.005; ***, p ⬍ 0.0005. B, same as A except that Western blot analysis was performed. C, indicated cell line was transfected with Luc-wild type 3⬘-UTR-CAGE (1g) or Luc-mutant 3⬘-UTR-CAGE construct (1 g) with or without control inhibitor (Ctrl. Inh.) (200 nM) or miR-200b inhibitor (200 nM). 48 h after transfection, luciferase activity assays were performed. D, Malme3MR-miR-200bor SNU387R-miR-200bcells were transfected with miR-200b inhibitor (200 nM) or control inhibitor (200 nM). Malme3MRor SNU387Rcells were transfected with control inhibitor (200 nM). 24 h after transfection, cells were treated with or without celastrol (1M) or taxol (1M) for 24 h, followed by annexin V-FITC staining. E, Malme3MRcells were transfected with control inhibitor (200 nM). 24 h after transfection, cells were treated with or without celastrol (1M) or taxol (1M) for 24 h, followed by Western blot analysis. PARP, poly(ADP-ribose) polymerase.
miR-200b and CAGE Form a Feedback Loop
at Ewha Medical Library on July 5, 2016
http://www.jbc.org/
miR-200b inhibitor induced the expression of CAGE and MDR1 in Malme3MR-miR-200band SNU387R-miR-200bcells (Fig. 4B). The transfection of the Luc-3⬘-wild type UTR of CAGE, but not the Luc-3⬘-mutant UTR of CAGE, led to the decreased luciferase activity in Malme3MR-miR-200band SNU387R-miR-200b cells (Fig. 4C). the miR-200b inhibitor prevented miR-200b from decreasing the luciferase activity associated with the transfection of the Luc-3⬘-wild type UTR of CAGE (Fig. 4C). Malme3MR- miR-200b/SNU387R-miR-200bcells showed a higher proportion of annexin V-positive cells in response to celastrol and taxol (Fig. 4D). The transfection of miR-200b inhibitor decreased the proportion of annexin V-positive cells in response to celastrol and taxol in these cancer cells (Fig. 4D). The transfection of miR-200b inhibitor decreased the
propor-tion of annexin V-positive cells in response to celastrol and taxol in SNU387 and Malme3M cells (data not shown). The transfection of miR-200b inhibitor prevented the cleavage of poly(ADP-ribose) polymerase in response to microtubule-tar-geting drugs in SNU387 and Malme3M cells (Fig. 4E). These results suggest that the expression level of miR-200b deter-mines the response to microtubule-targeting drugs.
miR-200b Exerts Regulations on the Invasion and Metastatic Potential of Cancer Cells—miR-200b regulates epithelial-mes-enchymal transition (17, 28). The effect of miR-200b on inva-sion potential in relation to CAGE was examined. Anti-cancer drug-resistant cancer cell lines showed higher invasion poten-tial than anti-cancer drug-sensitive counterparts (Fig. 5B). The transfection of miR-200b (Fig. 5A) decreased the invasion FIGURE 5. Effect of miR-200b on invasion potential of cancer cells involves expression regulation of CAGE. A, SNU387R, SNU387R-taxol, Malme3MR, Malme3MR-taxol, AGSR, or MDA-MB231 cells were transfected with control vector (NC, 1g) or miR-200b construct (1 g). 48 h after transfection, miRNAs were isolated, and qRT-PCR was performed. miRNAs were also isolated from SNU387, Malme3M, AGS, or MCF-7 cells and subjected to qRT-PCR. **, p⬍ 0.005; ***, p ⬍ 0.0005. B, same as A except that invasion potential was measured as described. C, SNU387 or Malme3M cells were transfected with control inhibitor (Ctrl. Inh.) (200 nM) or miR-200b inhibitor (200 nM). 48 h after transfection, invasion potential was measured (left panel). miRNAs were isolated and subjected to qRT-PCR (middle panel). Cell lyastes were isolated and subjected to Western blot analysis (right panel).
miR-200b and CAGE Form a Feedback Loop
at Ewha Medical Library on July 5, 2016
http://www.jbc.org/
potential of these anti-cancer drug-resistant cancer cell lines (Fig. 5B). miR-200b inhibitor enhanced the invasion potential of SNU387 and Malme3M cells (Fig. 5C). miR-200b inhibitor increased the expression of CAGE and Snail while decreasing the expression of E-cadherin in SNU387 and Malme3M cells (Fig. 5C). The anti-cancer drug-resistant cancer cell lines showed lower expression of E-cadherin than the anti-cancer-sensitive counterparts (Fig. 6A). The transfection of miR-200b increased the expression of E-cadherin in these anti-cancer drug-resistant cancer cell lines (Fig. 6A). The E-cadherin pro-moter sequences contain putative binding sites for transcrip-tion factors, such as AP1, HDAC2, SP1, and Snail (Fig. 6B). ChIP assays showed the binding of Snail to the promoter sequences of E-cadherin in Malme3MRcells (Fig. 6B). E-cad-herin promoter sequences contain a binding site for HDAC2 (Fig. 6B). Malme3MR cells express a higher level of HDAC2 than Mame3M cells (6). HDAC2 interacts with Snail to repress E-cadherin expression (29). It is probable that HDAC2 binds to the promoter sequences of E-cadherin in Malme3MR cells through interaction with Snail. An athymic nude mouse model was employed to examine the effect of miR-200b on the
metas-tatic potential of cancer cells. Malme3MR cells displayed higher metastatic potential than Mame3M cells (Fig. 6C). Malme3MR-miR-200bcells showed lower metastatic potential than Malme3MR cells (Fig. 6C). The miR-200b inhibitor enhanced the metastatic potential of Malme3M cells (Fig. 6C). The Western blot of lung tumor tissue lysates showed a nega-tive regulatory role of miR-200b in the expression of CAGE and Snail (Fig. 6D). Taken together, these results suggest that the effect of miR-200b on invasion and metastatic potential involves the expression regulation of CAGE by miR-200b.
CAGE Directly Regulates the Expression of miR-200b—The possibility of expression regulation of miR-200b by CAGE was examined. The transfection of CAGE into Malme3MR-miR-200b or SNU387R-miR-200b cells decreased the expression of miR-200b (Fig. 7A). CAGE enhanced the invasion potential of Malme3MR-miR-200band SNU387R-miR-200bcells (Fig. 7A). The transfection of CAGE into Malme3MR-miR-200bor SNU387R-miR-200b cells induced the expression of Snail and MDR1 while decreasing the expression of E-cadherin (Fig. 7B). Malme3MRcells that stably express antisense CAGE showed a higher expression level of miR-200b than Malme3MRcells (Fig. 7, C and D). The FIGURE 6. miR-200b regulates metastatic potential of cancer cells. A, cell lysates prepared from the indicated cell lines were subjected to Western blot analysis. B, Malme3M cells were transfected with control inhibitor (Ctrl. Inh.) (200 nM) or miR-200b inhibitor (200 nM). 48 h after transfection, cell lysates were prepared and subjected to ChIP assays. Cell lysates prepared from Malme3MRand Malme3MR-miR-200bcells were also subjected to ChIP assays. IP, immuno-precipitation. C, each experimental group consists of five athymic nude mice. Each figure shows a representative image of the mice in each experimental group. Control inhibitor (50M/kg) or miR-200b inhibitor (50M/kg) was intravenously injected five times over a total of 4 weeks. miR-200b significantly decreases the metastatic potential of Malme3MRcells. miR-200b inhibitor enhances the metastatic potential of Malme3M cells. D, miRNAs isolated from mice of each experimental group were subjected to qRT-PCR (left panel). Tissue lysates isolated from mice of each experimental group were subjected to Western blot analysis (right panel). ***, p⬍ 0.0005.
miR-200b and CAGE Form a Feedback Loop
at Ewha Medical Library on July 5, 2016
http://www.jbc.org/
direct involvement of CAGE in the expression regulation of 200b was examined. According to promoter analysis, miR-200b promoter sequences contain putative binding sites for transcription factors, including HDAC2, p53, Snail, and SP1 (Fig. 7E). Because CAGE interacts with HDAC2 to repress the expression of p53, it was hypothesized that CAGE would bind to the promoter sequences of miR-200b. CAGE and HDAC2 were shown to bind to the miR-200b promoter sequences in Malme3MRcells (Fig. 7F). YY1 interacts with HDAC2 and reg-ulates the expression of human B type natriuretic peptide (30). YY1 negatively regulates the mouse myelin proteolipid protein (Plp1) gene (31). YY1 represses muscle miRNA expression in myoblasts, and the repression is mediated through multiple enhancers and the recruitment of Polycomb complex to several YY1-binding sites (32). YY1 forms a feedback regulatory loop with miR-1 in myoblasts (32). YY1 showed binding to the pro-moter sequences of miR-200b in Malme3MRcells (Fig. 7F), sug-gesting that YY1 may be a negative regulator of miR-200b. p53 regulates the epithelial-mesenchymal transition through microRNAs, such as miR-200b, targeting ZEB1 and ZEB2 (33).
It is probable that p53 up-regulates the expression of miR-200b in the drug-sensitive cancer cell lines employed in this study. Taken together, these results show that miR-200b and CAGE target each other. In other words, miR-200b and CAGE form a feedback regulatory loop.
miR-200b Decreases in Vivo Tumorigenic Potential in a Manner Associated with the Down-regulation of CAGE—The effect of miR-200b on tumorigenic potential was examined. Malme3MR cells showed higher tumorigenic potential than Malme3MR-miR-200b cells (Fig. 8A). miR-200b inhibitor enhanced tumorigenic potential of Malme3M cells (Fig. 8A). miR-200b inhibitor enhanced tumorigenic potential of Malme3MR-miR-200bcells (Fig. 8A). Western blot analysis of tumor tissue lysates showed a negative regulatory effect of miR-200b on the expression of CAGE (Fig. 8B). The qRT-PCR anal-ysis of tumor tissue showed a negative regulatory effect of miR-200b on the expression of CAGE mRNA (Fig. 8C). The miR-200b inhibitor decreased the expression of miR-200b in Malme3M and Malme3MR-miR-200b cells (Fig. 8C). The Malme3MR-miR-200bcell lines showed lower cellular prolifera-FIGURE 7. CAGE regulates the expression of miR-200b. A, Malme3MR-miR-200bor SNU387R-miR-200bcells were transfected with control vector (1g) or CAGE cDNA (1g). 48 h after transfection, miRNA was isolated and subjected to qRT-PCR (upper panel). miRNAs isolated from Malme3MRor SNU387Rcells transfected with control vector were also subjected to qRT-PCR. Effect of CAGE on invasion potential was examined (lower panel). **, p⬍ 0.005; ***, p ⬍ 0.0005. B, same as A except that Western blot analysis was performed. C, miRNAs isolated from the indicated cell lines were subjected to qRT-PCR. D, same as C except that Western blot analysis was performed. Malme3MR-AS-CAGEdenotes Malme3MRcells stably expressing antisense CAGE cDNA. E, miR-200b promoter sequences. F, cell lysates prepared form the indicated cells were immunoprecipitated (IP) with the indicated antibody (2g/ml), followed by ChIP assays. S denotes drug-sensitive Malme3M, and R denotes drug-resistant Malme3M cells.
miR-200b and CAGE Form a Feedback Loop
at Ewha Medical Library on July 5, 2016
http://www.jbc.org/
tion rates than Malme3MRcells (Fig. 8D). Malme3MR-miR-200b cell lines also showed lower growth rate under anchorage-inde-pendent conditions than Malme3MR cells (Fig. 8E). Taken together, these results suggest that the negative regulatory role of miR-200b in tumorigenic potential involves the expression regulation of CAGE by miR-200b.
miR-200b Regulates Tumor-induced Angiogenesis —200b regulates the expression of VEGF (25). The effect of miR-200b on tumor-induced angiogenesis was next examined. Malme3MRcells showed higher expression levels of CAGE, PAI-1, VEGF, and pVEGFR2Y1054/1059 than Malme3M cells (Fig. 9A). This suggests that Malme3MRcells may enhance the angiogenic potential of human endothelial cells via angiogenic factors such as VEGF and PAI-1. PAI-1 facilitates retinal angio-genesis (34) and is necessary for sonic hedgehog-induced cere-bral angiogenesis (35). VEGF-B binds to VEGFRI and regulates PAI-1 activity (36). Tumor angiogenesis is dependent on
HIF-1-dependent PAI-1 expression (37). These findings suggest a role for PAI-1 in angiogenesis. miR-200b decreased the expres-sion of CAGE, PAI-1, VEGF, and pVEGFR2Y1054/1059 in Malme3MRcells (Fig. 9A). The conditioned medium obtained from Malme3MRcells, but not from Malme3M cells, increased expression of CAGE, PAI-1, and VEGF in HUVECs (Fig. 9B). The conditioned medium obtained from Malme3MR trans-fected with miR-200b did not affect the expression of CAGE, PAI-1, or VEGF in HUVECs (Fig. 9B), suggesting that miR-200b has a negative effect on tumor-induced angiogenesis. The conditioned medium of Malme3MRcells enhanced endothelial cell tube formation when added to HUVECs (Fig. 9C). How-ever, the conditioned medium of Malme3MR-miR-200bcells did not enhance endothelial cell tube formation (Fig. 9C). The condi-tioned medium of Malme3MRcells enhanced blood vessel forma-tion when mixed with Matrigel for intravital microscopy (Fig. 9C). However, the conditioned medium of Malme3MR-miR-200bcells FIGURE 8. miR-200b regulates the tumorigenic potential of cancer cells in vivo. A, Malme3MR(1⫻ 106) or Malme3MR-miR-200b(1⫻ 106) cells were injected into the dorsal flanks of athymic nude mice (left panel). Malme3M (1⫻ 106) cells were injected into the dorsal flanks of athymic nude mice (middle panel). Following the establishment of sizeable tumor, control inhibitor (Ctrl Inh.) (40g/kg or 50 M/kg) or miR-200b inhibitor (40g/kg or 50 M/kg) was injected. Malme3MR-miR-200b(1⫻ 106) cells were injected into the dorsal flanks of athymic nude mice (right panel). Following the establishment of a sizeable tumor, control inhibitor (40g/kg or 50 M/kg) or miR-200b inhibitor (40g/kg or 50 M/kg) was injected. Each experimental group consisted of five mice. Each value represents an average obtained from the five athymic nude mice of each group. Data are expressed as a mean⫾ S.D. Each figure shows a representative image of the mice in each group at the time of sacrifice. B, lysates isolated from each tumor tissue were subjected to Western blot. C, miRNAs isolated from the indicated tumor tissues were subjected to qRT-PCR. Messenger RNAs isolated from the indicated tumor tissues were also subjected to qRT-PCR to determine the expression level of CAGE mRNA. ***, p⬍ 0.0005. D, cellular proliferation of each indicated cell line was measured (left panel). Malme3MR-miR-200b#3 and Malme3MR-miR-200b#8denote Malme3MRcells stably expressing miR-200b. The number of viable cells was determined by trypan blue exclusion staining. ** denotes statistical difference between Malme3MRand Malme3MR-miR-200b #8. ## denotes statistical difference between Malme3MRand Malme3MR-miR-200b#3. The expression level of miR-200b in the indicated cell line was determined by qRT-PCR (right panel). E, indicated cell lines were subjected to anchorage-independent growth assays.
miR-200b and CAGE Form a Feedback Loop
at Ewha Medical Library on July 5, 2016
http://www.jbc.org/
did not enhance blood vessel formation (Fig. 9C). Matrigel plug assays also showed that miR-200b had a negative effect on tumor-induced angiogenesis (Fig. 9C). The conditioned medium obtained from Malme3M cells transfected with miR-200b inhibitor enhanced blood vessel formation in intravital microscopy analysis (Fig. 9D). Taken together, these results sug-gest that miR-200b acts as a negative regulator of tumor-induced angiogenesis by regulating the expression of CAGE.
CAGE Mediates Tumor-induced Angiogenesis—In an effort to investigate the role of CAGE in angiogenesis, cytokine array analyses were performed to identify the factors that are regu-lated by CAGE. Malme3MRcells showed a higher expression of angiogenic factors such as PAI-1 than Malme3M cells (Fig. 10A). The down-regulation of CAGE decreased the expression of PAI-1 in Malme3MRcells. Soluble cytokines such as MCP1, GRO1-␣, and sICAM-1 were also regulated by CAGE (Fig. 10B). The functional roles of these cytokines in angiogenesis in relation to CAGE require further investigation. The condi-tioned medium of Malme3MRcells enhanced human endothe-lial cell tube formation and also enhanced the invasion potential of HUVECs (Fig. 10B). The conditioned medium of Malme3MR cells that stably express antisense CAGE cDNA did not affect human endothelial cell tube formation or invasion potential
(Fig. 10B). CAM assays confirmed the role of CAGE in tumor-induced angiogenesis (Fig. 10B). The conditioned medium of Malme3MR cells enhanced the aortic ring formation, and CAGE was necessary for this enhanced aortic ring formation (Fig. 10B). The conditioned medium of Malme3MRcells, when added to HUVECs, induced the activation of TGFRI and the expression of PAI-1 (Fig. 10B). However, the conditioned medium of Malme3MR cells that stably express antisense CAGE cDNA did not induce the activation of TGFRI or the expression of PAI-1 in HUVECs (Fig. 10B). VEGF induced the expression of PAI-1 in a time- and dose-dependent manner (Fig. 10C). PAI-1 was necessary for enhanced endothelial cell tube formation by VEGF (Fig. 10D). Taken together, these results sug-gest that CAGE mediates tumor-induced angiogenesis by regulat-ing the expression of angiogenic factors such as PAI-1.
CAGE Mediates VEGF-promoted Angiogenesis—Because CAGE was necessary for tumor-induced angiogenesis, the necessity of CAGE for VEGF-promoted angiogenesis in HUVECs was examined. VEGF induced the expression of CAGE, in a time-and dose-dependent manner (Fig. 11A). Northern blot analysis showed the induction of CAGE at the transcriptional level (Fig. 11B). AVASTIN, a VEGF-naturalizing antibody, prevented VEGF from inducing the expression of CAGE (Fig. 11C), sug-FIGURE 9. miR-200b regulates tumor-induced angiogenesis. A, Malme3MRcells were transfected with control vector (1g) or miR-200b construct (0.1, 1 g). 48 h after transfection, cell lysates were prepared and subjected to Western blot analysis. Cell lysates from Malme3M cells were also subjected to Western blot analysis. V denotes control vector. B, conditioned medium (C.M.) obtained from the indicated cells was added to HUVECs for 1 h, followed by Western blot analysis. C, conditioned medium obtained from the indicated cell line was added to HUVECs for 8 h, and endothelial cell tube formation assays were performed (upper panel). Concentrated conditioned medium (10l) obtained from the indicated cell line was mixed with 100 l of Matrigel, and intravital microscopy was performed as described (middle panel). The conditioned medium was also subjected to Matrigel plug assays as described (bottom panel). **, p⬍ 0.005; ***, p ⬍ 0.0005. D, Malme3M cells were transfected with control inhibitor (Ctrl. Inh.) or miR-200b inhibitor. 48 h after transfection, conditioned medium was obtained, and intravital microscopy was performed. The conditioned medium obtained from Malme3M cells was also subjected to intravital microscopy.
miR-200b and CAGE Form a Feedback Loop
at Ewha Medical Library on July 5, 2016
http://www.jbc.org/
gesting that VEGF specifically induces the expression of CAGE. The down-regulation of CAGE prevented VEGF from enhanc-ing endothelial cell tube formation in HUVECs (Fig. 11D). CAGE was necessary for blood vessel formation according to aortic ring formation assays (Fig. 11E). Taken together, these results suggest that CAGE is induced by VEGF and mediates the VEGF-promoted angiogenesis.
Recombinant CAGE Protein Displays Angiogenic Potential— CAGE is present in the sera of patients with various cancers (1, 3, 4). The conditioned medium of HUVECs treated with VEGF shows the expression of CAGE.4This led to the hypothesis that CAGE might be a secreted protein. The direct role of CAGE in angiogenesis was therefore assessed. Recombinant CAGE pro-tein was mixed with Matrigel and injected intradermally into
the back of a BALB/c mouse. VEGF and recombinant CAGE protein enhanced blood vessel formation, as evidenced by intravital microscopy (Fig. 12A). Rat aortic ring formation assays also showed blood vessel formation by recombinant CAGE protein (Fig. 12B). Recombinant CAGE protein enhanced blood vessel formation in CAM assays (Fig. 12C). These results suggest that CAGE is an angiogenic factor. DISCUSSION
miR-200b is involved in resistance to taxol (14) and EGFR therapy (15). It was reported that the expression level of pEGFRY845was increased in SNU387Rand Malme3MRcells (6). It is probable that miR-200b has a negative effect on the activa-tion of EGFR in cancer cell lines resistant to the microtubule-targeting drugs employed in this study. SNU387R and Malme3MRcells show resistance to EGFR inhibitors such as 4D. Jeoung, personal observations.
FIGURE 10. CAGE mediates tumor-induced angiogenesis. A, cell lysates isolated from the indicated cell line were subjected to cytokine array analysis. B, conditioned medium (C.M.) (0.1 ml) obtained from the indicated cell line was added to HUVECs. Eight hours after addition of conditioned medium, endothelial cell tube formation assays were performed. Conditioned medium was also employed to examine the effect of CAGE on angiogenic potential of Malme3MRcells based on aortic ring formation and CAM assays. The effect of CAGE on the invasion potential of HUVECs was determined using a transwell chamber system. Data are expressed as a mean⫾ S.D. Cell lysates prepared from the indicated cancer cell line were also subjected to Western blot analysis (right upper panel). Conditioned medium of the indicated cell line was added to HUVECs. One hour after addition of conditioned medium, cell lysates were immunoprecipitated (IP) with the indicated antibody, followed by Western blot analysis (right lower panel). Cell lyastes were also subjected to Western blot analysis (right lower panel). *, p⬍ 0.05; **, p ⬍ 0.005; ***, p ⬍ 0.0005. C, HUVECs were treated with or without VEGF (20 ng/ml) for various time intervals. Cell lysates prepared at each time point were subjected to Western blot analysis (upper panel). HUVECs were treated with various concentrations of VEGF for 1 h, followed by Western blot analysis (lower panel). D, HUVECs were transfected with scrambled siRNA (10 nM) or PAI-1 siRNA (10 nM). 48 h after transfection, cells were treated with or without VEGF (20 ng/ml) for 8 h. Cells were then subjected to endothelial cell formation assays. Data are expressed as a mean⫾ S.D. HUVECs were transfected with scrambled siRNA (10 nM) or PAI-1 siRNA (10 nM). 48 h after transfection, cells were treated with or without VEGF (20 ng/ml) for 1 h, followed by Western blot analysis. Sc denotes scrambled.
miR-200b and CAGE Form a Feedback Loop
at Ewha Medical Library on July 5, 2016
http://www.jbc.org/
cetuximab and iressa.4The down-regulation of CAGE leads to the enhanced sensitivity of SNU387Rand Malme3MRcells to cetuximab and iressa.4This suggests the involvement of miR-200b and CAGE in response to EGFR therapy, in addition to the response to microtubule-targeting drugs. It will be interesting to examine the effect of EGFR signaling on the expression of miR-200b and CAGE in cancer cell lines.
miR-200b regulates chemotherapy-induced epithelial-mes-enchymal transition in human tongue cancer cells by targeting BMI1 (12). miR-200b inhibits TGF1-induced epithelial-mes-enchymal transition (38). Smad3 binds to the Smad-binding element in the promoter sequences of miR-200b to regulate the expression of miR-200b at the transcriptional level (17). This suggests a feedback regulatory loop between miR-200b and TGF1 signaling. It is therefore reasonable that CAGE may affect TGF1 signaling. In this study, it was shown that CAGE acts as a negative regulator of miR-200b and binds to the pro-moter sequences of miR-200b. It was found that the down-regulation of CAGE leads to the decreased expression of pSmad2Ser-456/467 and pSmad3Ser-208 in SNU387R and Malme3MRcells.4This suggests a close relationship between TGF signaling and CAGE. It may be necessary to examine the possible interaction between CAGE and Smad2/3.
The expression of miR-200b is epigenetically regulated (39). miR-200b promoter contains a binding site for HDAC2, and ChIP assays show the binding of HDAC2 to the promoter
sequences of miR-200b in Malme3MRcells (Fig. 7F). This sug-gests that CAGE regulates the expression of miR-200b through interaction with HDAC2. The expression of CAGE is epigeneti-cally regulated (5). DNMT1 acts as a negative regulator of CAGE expression (6). miR-152 directly down-regulates DNMT1 expres-sion by targeting the 3⬘-untranslated regions of its transcript in nickel sulfide (NiS)-transformed human bronchial epithelial cells (40). It will be interesting to examine the effect of miR-152 on the expression of miR-200b and CAGE. It is probable that the expression of miR-152 is increased in cancer cell lines that are resistant to microtubule-targeting drugs and increases the expression of CAGE. miR-200b promoter contains a binding site for SP1 (Fig. 7E). The expression of SP1 is increased in SNU387Rand Malme3MRcells.4It will be interesting to exam-ine the effect of SP1 on the expression of miR-200b and the possible interaction between CAGE and SP1.
miR-200b regulates VEGF signaling and angiogenesis (22, 41). miR-200b negatively regulates the expression of VEGF and PAI-1 (Fig. 9A). Cytokine array analysis shows that the down-regulation of CAGE leads to the decreased expression of angio-genic factors such as PAI-1, MCP1, GRO1-␣, and sICAM-1 (Fig. 10A). Monocyte chemoattractant protein 1(MCP1) is involved in cathepsin G-promoted enhanced TGF signaling during angiogenesis (43). Growth-regulated oncogene 1-␣ (GRO1-␣) is associated with angiogenesis and lymph node metastasis (44). Soluble intercellular adhesion molecule 1 FIGURE 11. CAGE mediates VEGF-promoted angiogenesis. A, HUVECs were incubated with VEGF (20 ng/ml) for various time intervals (upper panel), or HUVECs were incubated with various concentrations of VEGF for 1 h (lower panel). Prepared cell lysates were then subjected to Western blot analysis. B, HUVECs were treated with or without VEGF (20 ng/ml) for various time intervals. Total RNAs were isolated, and Northern blot analysis was performed. C, HUVECs were preincubated with IgG (4g/ml) or AVASTIN (4 g/ml) for 4 h. Cells were then incubated with VEGF (20 ng/ml) for 1 h, followed by Western blot analysis. D, HUVECs were transfected with scrambled siRNA (10 nM) or CAGE siRNA (10 nM). 48 h after transfection, cells were treated with or without VEGF (20 ng/ml) for 8 h. Endothelial cell tube formation assays were performed as described (upper panel). HUVECs were transfected with scrambled siRNA (10 nM) or CAGE siRNA (10 nM). At 48 h after transfection, cells were treated with various concentrations of VEGF for 1 h, followed by Western blot analysis (lower panel). Data are expressed as a mean⫾ S.D. E, HUVECs were transfected with scrambled siRNA (10 nM) or CAGE siRNA (10 nM). 48 h after transfection, cells were treated with or without VEGF (20 ng/ml) for 10 h. Conditioned medium (C.M.) was obtained and subjected to rat aortic ring formation assays as described. *, p⬍ 0.05; **, p ⬍ 0.005; ***, p⬍ 0.0005.
miR-200b and CAGE Form a Feedback Loop
at Ewha Medical Library on July 5, 2016
http://www.jbc.org/
(sICAM1) promotes angiogenesis (45). It will be necessary to examine the relationship between miR-200b and these cyto-kines. There have been few studies on cancer/testis antigens in relation to angiogenesis, if any. MAGE-11 activates a hypoxic response by inhibiting prolyl hydroxylase 2 (46). MAGE-D1 inhibits angiogenesis in vitro and in vivo (47).
We show that CAGE mediates VEGF-promoted angiogene-sis (Fig. 11, D and E). VEGF increases the expression of HDAC2 in HUVECs.4It is therefore reasonable that CAGE may mediate VEGF-promoted angiogenesis through interaction with HDAC2. It will be interesting to examine the role of HDAC2 in angiogenesis.
Human recombinant CAGE protein induces blood vessel formation (Fig. 12, A–C). The identification of receptor that interacts with CAGE is necessary for understanding CAGE-promoted angiogenesis. Interaction pathway analysis suggests the interaction between CAGE and EGFR. It will be necessary to examine the role of EGFR in CAGE-promoted angiogenesis and the interaction between CAGE and EGFR.
Because miRNAs have the potential to repress the mRNAs that encode transcription factors, which repress the same
miRNAs, miRNAs are well suited to take part in the feedback regulatory loop. miRNAs regulate their own expression through feedback loops (48). miR-22 is up-regulated by Akt and down-regulates PTEN levels (49). A feedback regulatory loop exists between miR-195 and MBD1 in neural stem cell differ-entiation (50). Just like the miR-200b-CAGE feedback regula-tory loop, MBD1 and miR-195 have been revealed to directly regulate each other. A feedback regulatory loop exists between miR-17 and cyclin D1 in breast cancer cell proliferation (51). miR-200b regulates the expression of cyclin D1 (52). CAGE regulates the expression of cyclin D1 in an AP1- and E2F-de-pendent manner (7). Because cyclin D1 has served as a common target for miR-200b and CAGE, it was hypothesized that there would be a feedback regulatory loop between miR-200b and CAGE.
Target scan analysis predicts the binding of miR-153 to 3⬘-UTR of CAGE. miR-153 is down-regulated in cells that have undergone EMT by TGF and inhibits tumor metastasis and EMT by targeting SNAI1 and ZEB2 (42). It will be interesting to examine the role of miR-153 in angiogenesis, invasion, and the response to microtubule-targeting drugs in relation to CAGE. FIGURE 12. CAGE promotes angiogenesis. A, indicated amount of human recombinant CAGE protein or recombinant VEGF protein was mixed with Matrigel. Four days later, FITC-dextran was injected via the tail vein to visualize blood vessel formation. Each figure shows a representative example of three independent experiments. Angiogenic scores were obtained by performing three independent experiments. Intravital microscopy analysis was conducted as described. B, indicated amount of recombinant CAGE or VEGF protein was added to rat aorta. After 6 days, the extent of microvessel sprouting was determined using an inverted microscope (magnification,⫻100; Olympus). Photographs are representative of endothelial cell sprouts formed from the margins of vessel segments. Angiogenic scores were obtained by performing three independent experiments. C, CAM assays were performed. In brief, salt-free solution (10l) containing recombinant VEGF (20 ng/ml) or recombinant CAGE protein (20 ng/ml) was applied to Thermanox discs. Data are expressed as a mean⫾ S.D. *, p ⬍ 0.05.
miR-200b and CAGE Form a Feedback Loop
at Ewha Medical Library on July 5, 2016
http://www.jbc.org/
Target scan analysis also predicts the binding of miR-145, -448, -217, -429, and -186 to the promoter sequences of CAGE. It will be interesting to examine the relationship between these miRNAs and the miR-200b-CAGE feedback regulatory loop. Some of these miRNAs may repress the expression of CAGE, which in turn up-regulates the expression of miR-200b in the drug-resistant cancer cell lines employed in this study.
In conclusion, it has been shown that miR-200b and CAGE form a feedback regulatory loop and regulate the response to microtubule-targeting drugs, as well as the invasion, tumori-genic potential, and angiotumori-genic potential.
REFERENCES
1. Cho, B., Lim, Y., Lee, D. Y., Park, S. Y., Lee, H., Kim, W. H., Yang, H., Bang, Y. J., and Jeoung, D. I. (2002) Identification and characterization of a novel cancer/testis antigen gene CAGE. Biochem. Biophys. Res. Commun. 292, 715–726
2. Shim, E., Shim, H., Bae, J., Lee, H., and Jeoung, D. (2006) CAGE displays oncogenic potential and induces cytolytic T lymphocyte activity. Biotech-nol. Lett. 28,515–522
3. Iwata, T., Fujita, T., Hirao, N., Matsuzaki, Y., Okada, T., Mochimaru, H., Susumu, N., Matsumoto, E., Sugano, K., Yamashita, N., Nozawa, S., and Kawakami, Y. (2005) Frequent immune responses to a cancer/testis anti-gen, CAGE, in patients with microsatellite instability-positive endometrial cancer. Clin. Cancer Res. 11, 3949 –3957
4. Liggins, A. P., Lim, S. H., Soilleux, E. J., Pulford, K., and Banham, A. H. (2010) A panel of cancer-testis genes exhibiting broad-spectrum expres-sion in haematological malignancies. Cancer Immun. 10, 8
5. Cho, B., Lee, H., Jeong, S., Bang, Y. J., Lee, H. J., Hwang, K. S., Kim, H. Y., Lee, Y. S., Kang, G. H., and Jeoung, D. I. (2003) Promoter hypomethylation of a novel cancer/testis antigen gene CAGE is correlated with its aberrant expression and is seen in premalignant stage of gastric carcinoma. Biochem. Biophys. Res. Commun. 307,52– 63
6. Kim, Y., Park, H., Park, D., Lee, Y. S., Choe, J., Hahn, J. H., Lee, H., Kim, Y. M., and Jeoung, D. (2010) Cancer/testis antigen CAGE exerts negative regulation on p53 expression through HDAC2 and confers resistance to anti-cancer drugs. J. Biol. Chem. 285, 25957–25968
7. Por, E., Byun, H. J., Lee, E. J., Lim, J. H., Jung, S. Y., Park, I., Kim, Y. M., and Jeoung, D. I., and Lee, H. (2010) The cancer/testis antigen CAGE with oncogenic potential stimulates cell proliferation by up-regulating cyclins D1 and E in an AP-1- and E2F-dependent manner. J. Biol. Chem. 285, 14475–14485
8. Calin, G. A., and Croce, C. M. (2006) MicroRNA signatures in human cancers. Nat. Rev. Cancer 6, 857– 866
9. Cheng, W., Liu, T., Wan, X., Gao, Y., and Wang, H. (2012) MicroRNA-199a targets CD44 to suppress the tumorigenicity and multidrug resis-tance of ovarian cancer-initiating cells. FEBS J. 279, 2047–2059 10. Yoshino, H., Enokida, H., Itesako, T., Tatarano, S., Kinoshita, T., Fuse, M.,
Kojima, S., Nakagawa, M., and Seki, N. (2013) Epithelial-mesenchymal transition-related microRNA-200s regulate molecular targets and path-ways in renal cell carcinoma. J. Hum. Genet. 58, 508 –516
11. Rui, W., Bing, F., Hai-Zhu, S., Wei, D., and Long-Bang, C. (2010) Identifi-cation of microRNA profiles in docetaxel-resistant human non-small cell lung carcinoma cells (SPC-A1). J. Cell. Mol. Med. 14, 206 –214
12. Sun, L., Yao, Y., Liu, B., Lin, Z., Lin, L., Yang, M., Zhang, W., Chen, W., Pan, C., Liu, Q., Song, E., and Li, J. (2012) miR-200b and miR-15b regulate chemotherapy-induced epithelial-mesenchymal transition in human tongue cancer cells by targeting BMI1. Oncogene 31, 432– 445
13. Li, Y., VandenBoom, T. G., 2nd, Kong, D., Wang, Z., Ali, S., Philip, P. A., and Sarkar, F. H. (2009) Up-regulation of miR-200 and let-7 by natural agents leads to the reversal of epithelial-to-mesenchymal transition in gemcitabine-resistant pancreatic cancer cells. Cancer Res. 69, 6704 – 6712 14. Feng, B., Wang, R., Song, H. Z., and Chen, L. B. (2012) MicroRNA-200b reverses chemoresistance of docetaxel-resistant human lung adenocarci-noma cells by targeting E2F3. Cancer 118, 3365–3376
15. Adam, L., Zhong M, Choi, W., Qi, W., Nicoloso, M., Arora, A., Calin, G.,
Wang, H., Siefker-Radtke, A., McConkey, D., Bar-Eli, M., and Dinney, C. (2009) miR-200 expression regulates epithelial-to-mesenchymal transi-tion in bladder cancer cells and reverses resistance to epidermal growth factor receptor therapy. Clin. Cancer Res. 15, 5060 –5072
16. Bao, B., Wang, Z., Ali, S., Kong, D., Li, Y., Ahmad, A., Banerjee, S., Azmi, A. S., Miele, L., and Sarkar, F. H. (2011) Notch-1 induces epithelial-mes-enchymal transition consistent with cancer stem cell phenotype in pan-creatic cancer cells. Cancer Lett. 307, 26 –36
17. Ahn, S. M., Cha, J. Y., Kim, J., Kim, D., Trang, H. T., Kim, Y. M., Cho, Y. H., Park, D., and Hong, S. (2012) Smad3 regulates E-cadherin via miRNA-200 pathway. Oncogene 31, 3051–3059
18. Gregory, P. A., Bert, A. G., Paterson, E. L., Barry, S. C., Tsykin, A., Farshid, G., Vadas, M. A., Khew-Goodall, Y., and Goodall, G. J. (2008) The miR-200 family and miR-205 regulate epithelial to mesenchymal transition by tar-geting ZEB1 and SIP1. Nat. Cell Biol. 10, 593– 601
19. Bai, J. X., Yan, B., Zhao, Z. N., Xiao, X., Qin, W. W., Zhang, R., Jia, L. T., Meng, Y. L., Jin, B. Q., Fan, D. M., Wang, T., and Yang, A. G. (2013) Tamoxifen represses miR-200 microRNAs and promotes epithelial-to-mesenchymal transition by up-regulating c-Myc in endometrial carci-noma cell lines. Endocrinology 154, 635– 645
20. Alaiti, M. A., Ishikawa, M., Masuda, H., Simon, D. I., Jain, M. K., Asahara, T., and Costa, M. A. (2012) Up-regulation of miR-210 by vascular endo-thelial growth factor in ex vivo expanded CD34⫹cells enhances cell-me-diated angiogenesis. J. Cell. Mol. Med. 16, 2413–2421
21. Wang, J., Wang, Y., Wang, Y., Ma, Y., Lan, Y., and Yang, X. (2013) Trans-forming growth factor-regulated microRNA-29a promotes angiogene-sis through targeting the phosphatase and tensin homolog in endothe-lium. J. Biol. Chem. 288, 10418 –10426
22. Chang, S. H., Lu, Y. C., Li, X., Hsieh, W. Y., Xiong, Y., Ghosh, M., Evans, T., Elemento, O., and Hla, T. (2013) Antagonistic function of the RNA-bind-ing protein HuR and miR-200b in post-transcriptional regulation of vas-cular endothelial growth factor-A expression and angiogenesis. J. Biol. Chem. 288,4908 – 4921
23. Takahashi, Y., Koyanagi, T., Suzuki, Y., Saga, Y., Kanomata, N., Moriya, T., Suzuki, M., and Sato, Y. (2012) Vasohibin-2 expressed in human serous ovarian adenocarcinoma accelerates tumor growth by promoting angio-genesis. Mol. Cancer Res. 10, 1135–1146
24. McArthur, K., Feng, B., Wu, Y., Chen, S., and Chakrabarti, S. (2011) Mi-croRNA-200b regulates vascular endothelial growth factor-mediated al-terations in diabetic retinopathy. Diabetes 60, 1314 –1323
25. Chan, Y. C., Roy, S., Khanna, S., and Sen, C. K. (2012) Down-regulation of endothelial microRNA-200b supports cutaneous wound angiogenesis by desilencing GATA binding protein 2 and vascular endothelial growth fac-tor recepfac-tor 2. Arterioscler. Thromb. Vasc. Biol. 32, 1372–1382 26. Chan, Y. C., Khanna, S., Roy, S., and Sen, C. K. (2011) miR-200b targets
Ets-1 and is down-regulated by hypoxia to induce angiogenic response of endothelial cells. J. Biol. Chem. 286, 2047–2056
27. Kavallaris, M., Kuo, D. Y., Burkhart, C. A., Regl, D. L., Norris, M. D., Haber, M., and Horwitz, S. B. (1997) Taxol-resistant epithelial ovarian tumors are associated with altered expression of specific-tubulin isotypes. J. Clin. Invest. 100,1282–1293
28. Ahmad, A., Aboukameel, A., Kong, D., Wang, Z., Sethi, S., Chen, W., Sarkar, F. H., and Raz, A. (2011) Phosphoglucose isomerase/autocrine motility factor mediates epithelial-mesenchymal transition regulated by miR-200 in breast cancer cells. Cancer Res. 71, 3400 –3409
29. Tong, Z. T., Cai, M. Y., Wang, X. G., Kong, L. L., Mai, S. J., Liu, Y. H., Zhang, H. B., Liao, Y. J., Zheng, F., Zhu, W., Liu, T. H., Bian, X. W., Guan, X. Y., Lin, M. C., Zeng, M. S., Zeng, Y. X., Kung, H. F., and Xie, D. (2012) EZH2 supports nasopharyngeal carcinoma cell aggressiveness by forming a co-repressor complex with HDAC1/HDAC2 and Snail to inhibit E-cad-herin. Oncogene 31, 583–594
30. Glenn, D. J., Wang, F., Chen, S., Nishimoto, M., and Gardner, D. G. (2009) Endothelin-stimulated human B-type natriuretic peptide gene expression is mediated by Yin Yang 1 in association with histone deacetylase 2. Hy-pertension 53,549 –555
31. Zolova, O. E., and Wight, P. A. (2011) YY1 negatively regulates mouse myelin proteolipid protein (Plp1) gene expression in oligodendroglial cells. ASN Neuro 3, 4
miR-200b and CAGE Form a Feedback Loop
at Ewha Medical Library on July 5, 2016
http://www.jbc.org/