Quantitative measurement of binocular color
fusion limit for non-spectral colors
Yong Ju Jung, Hosik Sohn, Seong-il Lee, Yong Man Ro,* and Hyun Wook Park
Department of Electrical Engineering, Korea Advanced Institute of Science and Technology, Daejeon 305-701, Korea
*ymro@ee.kaist.ac.kr
Abstract: Human perception becomes difficult in the event of binocular color fusion when the color difference presented for the left and right eyes exceeds a certain threshold value, known as the binocular color fusion limit. This paper discusses the binocular color fusion limit for non-spectral colors within the color gamut of a conventional LCD 3DTV. We performed experiments to measure the color fusion limit for eight chromaticity points sampled from the CIE 1976 chromaticity diagram. A total of 2480 trials were recorded for a single observer. By analyzing the results, the color fusion limit was quantified by ellipses in the chromaticity diagram. The semi-minor axis of the ellipses ranges from 0.0415 to 0.0923 in terms of the Euclidean distance in the u’v´ chromaticity diagram and the semi-major axis ranges from 0.0640 to 0.1560. These eight ellipses are drawn on the chromaticity diagram.
©2011 Optical Society of America
OCIS codes: (330.1400) Vision – binocular and stereopsis; (330.1720) Color vision; (330.1710)
Color, measurement.
References and links
1. M. Lambooij, W. Ijsselsteijn, M. Fortuin, and I. Heynderickx, “Visual discomfort and visual fatigue of stereoscopic displays: a review,” J. Imaging Sci. Technol. 53(3), 1–14 (2009).
2. J. K. Hovis, “Review of dichoptic color mixing,” Optom. Vis. Sci. 66(3), 181–190 (1989). 3. I. P. Howard, Seeing in depth (I. Porteous, 2002), Chap. 7.
4. M. Ikeda, and K. Sagawa, “Binocular color fusion limit,” J. Opt. Soc. Am. 69(2), 316–320 (1979).
5. M. Ikeda, and Y. Nakashima, “Wavelength difference limit for binocular color fusion,” Vision Res. 20(8), 693– 697 (1980).
6. H. Ujike, et al., “ISO International Workshop Agreement-IWA3 Image Safety - reducing the incidence of undesirable biomedical effects caused by visual image sequences. IWA 3:2005(E), ” (ISO copyright office, Case postale 56, CH-1211 Geneva 20, 2005).
7. C. Shigeru, “3D consortium safety guidelines for popularization of human-friendly 3D,” Tech. Rep. 3D Consortium (Japan, 1996).
8. Q. Huynh-Thu, P. L. Callet, and M. Barkowsky, “Video quality assessment: from 2D to 3D - challenges and future trends,” in Proceedings of IEEE International Conference on Image Processing (Institute of Electrical and Electronics Engineers, New York, 2010), pp. 4025–4028.
9. D. L. Macadam, “Visual sensitivities to color differences in daylight,” J. Opt. Soc. Am. 32(5), 247–274 (1942). 10. D. Qin, M. Takamatsu, Y. Nakashima, and X. Qin, “Change of wavelength difference limit for binocular color
fusion with wavelength and brightness of stimuli,” J. Light Vis. Environ. 30(1), 43–45 (2006).
11. W. D. Wright, “The sensitivity of the eye to small colour differences,” Proc. Phys. Soc. 53(2), 93–112 (1941). 12. E. F. Schubert, Light-emitting diodes (Cambridge Univ. Press, 2006), Chap. 17.
13. G. Verriest, J. Van Laethem, and A. Uvijls, “A new assessment of the normal ranges of the Farnsworth-Munsell 100-hue test scores,” Am. J. Ophthalmol. 93(5), 635–642 (1982).
14. A. Woods, “Understanding crosstalk in stereoscopic displays,” presented in Keynote Presentation at the Three-Dimensional Systems and Applications Conference, Tokyo, Japan, 19–21 May 2010.
15. J.-C. Liou, K. Lee, F.-G. Tseng, J.-F. Huang, W.-T. Yen, and W.-L. Hsu, “Sutter glasses stereo LCD with a dynamic backlight,” Proc. SPIE 7237, 72370X, 72370X-8 (2009).
16. G. Sharma, “LCDs versus CRTs - color-calibration and gamut considerations,” Proc. IEEE 90(4), 605–622 (2002).
17. Y.-K. Cheng, and H.-P. D. Shieh, “Colorimetric characterization of high dynamic range liquid crystal displays and its application,” J. Display Technol. 5(1), 40–45 (2009).
18. P. L. Rosin, “Fitting superellipses,” IEEE Trans. Pattern Anal. Mach. Intell. 22(7), 726–732 (2000). 19. A. S. H. Ler, M. A. Cohen, and J. A. Taylor, “A planar elliptical model of cardio-vagal hysteresis,” Physiol.
20. ITU-R BT-500, 11, “Methodology for the subjective assessment of the quality of television pictures,” International Telecommunications Union (2002).
1. Introduction
Starting with the recent success of the stereoscopic three-dimensional (3D) cinema industry, stereoscopic 3D content services are the subject of great interest from many industries, including the 3D broadcasting industry. However, one of the main bottlenecks preventing the proliferation of stereoscopic 3D services into the mass market is the concern over visual fatigue and visual discomfort that can be induced at various stages, including stereo shooting and 3D production, coding and transmission, and rendering on stereoscopic displays [1].
In stereopsis, binocular asymmetry may be one of the causes of visual fatigue and visual discomfort. Human perception becomes difficult in the event of binocular fusion when the level of asymmetries exceeds a certain limit [2,3]. There are three categories of the binocular asymmetries: luminance asymmetry, chromaticity asymmetry, and structure asymmetry [4]. Specifically, nonfused impressions in dichoptic color viewing have been reported as color rivalry or superimposition [2]. Color rivalry is a periodic alternation of the image in each eye occurring in either the spatial or temporal domain. Superimposition appears as simultaneous perception of both colors.
There is a great need to investigate and quantitatively determine the chromatic fusion limit in dichoptic viewing. This quantitative fusion limit can be used for various applications to provide users with comfortable viewing, such as an automatic stereo analyzer to guide content creators for the creation of visually comfortable stereoscopic contents, manufacturing guidelines to create safe optical instruments, image safety guidelines for users who watch 3DTV, and automatic content adaptation to reduce the level of visual discomfort [6–8].
Ikeda et al. studied the color fusion limits of spectral colors and white light [4,5]. Their experiments were conducted to determine the wavelength difference that initiated color rivalry. The color fusion limit was quantified as a function of the wavelength for the spectral colors. The wavelengths of the stimuli ranged from 500 to 660 nm. Seventeen sample points were subjectively examined to find the color fusion limit. These points were presented for the right eye. In addition, each point for the right eye was coupled with ten neighboring wavelengths for the left eye. The results of the wavelength difference ranged from 10 to 50 nm with a minimum value near 480 nm and 580 nm and a maximum value at the spectral extremes [2]. They also reported the color fusion limit for white point as a circle with a radius of about 0.0792 in the CIE 1960 uv chromaticity diagram [4]. However, their works were limited to spectral colors and white light.
As 3DTV has spread, it is necessary to measure how color differences between left and right images of non-spectral colors as well as spectral colors initiate color rivalry. In particular, the color fusion limit of non-spectral colors needs to be measured in the color gamut of 3DTV. Thus far, no attempt has been made to measure the color fusion limit for non-spectral colors.
In this paper, we measure the binocular color fusion limit for non-spectral colors within the color gamut of a conventional LCD (Liquid Cristal Display) 3DTV. The color fusion limit is measured for eight chromaticity points, covering the entire area in the standard CIE 1976 u´v´ chromaticity diagram. In order to check the consistency of our measurements with the results of a previous study, the color fusion limit for a white point was compared to that in a previous study [4]. For eight chromaticity points, over two thousand trials were recorded for a single observer. It takes very long time to observe all stimuli, and the long observation time necessary for the asymmetrical visual stimuli can induce visual fatigue such as eye strain. To limit this investigation to reasonable proportions, it was considered that only a single trichromat would cover all eight chromaticity points to complete this investigation. And four selected chromaticity points were tested by an author to confirm the results of the trichromat. The experimental results show the color fusion limit represented in terms of the Euclidean distance along straight lines in the chromaticity diagram. We quantify the color fusion limit of each point through the use of ellipses, as shown in the color differences obtained by
Macadam’s experiment [9]. These results were tabulated and then drawn on a standard chromaticity diagram.
The rest of this paper is organized as follows. In section 2, we describe the experimental method used for the measurement of the color fusion limit. Experimental results are presented in section 3, illustrating the color fusion limit plotted in the CIE 1976 uniform chromaticity scale diagram. Finally, section 4 concludes this paper.
2. Method
2.1 Apparatus and test material
The apparatus for the present experiments was a calibrated stereoscopic monitor
manufactured by Redrover (true3Di®). It consisted of two 40” TFT-LCD displays by
Samsung Electronics (LTA400HA07®) and a half mirror. The stereoscopic 3D monitor
exploited the linear polarization technique. The viewers watched stereoscopic stimuli upon wearing polarized glasses. The viewing distance was 1.5m. Figure 1 shows the apparatus used in our experiment. Table 1 summarizes the specifications of the LCD display. The brightness and chromaticity were measured at the center point of the monitor using a spectroradiometer
(Minolta CS-1000®). The crosstalk levels of the stereoscopic 3D monitor were 0.75% for the
left eye and 0.27% for the right eye [14,15]. Both crosstalk levels were as low as visibility threshold of about 1 to 2%, as reported in previous literature [14].
19° 33° 886 m m 498 mm Display (a) (b)
Fig. 1. (a) Apparatus and (b) viewing environment used in our experiment for the investigation of the color fusion limit.
Table 1. Specifications of LCD Displays Used in Our Experiment. The Brightness and Chromaticity Were Measured at the Center Point of the Monitor With a Spectroradiometer. H and V Respectively Denote the Horizontal and Vertical Size of the
Display.
Display area (mm) Aspect ratio Resolution
Brightness (with glasses, cd/m2) left right 886 (H) 498 (V) 16:9 1920 x 1080 149 136 Pixel arrangement Display
colors Color gamut
Color chromaticity
red green blue white
RGB vertical strip 8bit, 16.7M colors 72% of NTSC x = 0.642 y = 0.337 x = 0.280 y = 0.605 x = 0.147 y = 0.060 x = 0.280 y = 0.290
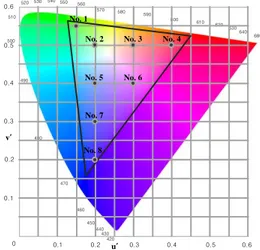
we uniformly sampled the points in the CIE 1976 uniform chromaticity scale diagram. Figure 2 shows all eight sample points in the CIE 1976 chromaticity diagram, where we measured the color fusion limit. The numbers in Fig. 2 indicate the sample numbers to be observed for the color fusion limit and the triangle represents the color gamut of the LCD display used in our experiments. In the experiments, the colors of the sampled points were presented for the right eye.
680 640 590 580 570 560 550 540 530 520 510 500 490 480 470 460 450 440 430 420 0 0.1 0.2 0.3 0.4 0.5 0.6 0.1 0.2 0.3 0.4 0.5 0.6 u’ v’ 630 620 610 600 No. 1
No. 2 No. 3 No. 4
No. 5 No. 6
No. 7
No. 8
Fig. 2. The total of 8 sample points in the CIE 1976 chromaticity diagram where we quantify color fusion limit through our experiment. The triangle represents the color gamut of the LCD display used in our experiments. The numbers indicate the sample numbers (from No. 1 to No. 8). These sample points were presented for the right eye.
To prepare the stimuli for the left eye, which were coupled with the stimulus given for the right eye, we sampled neighbors along the straight lines of six directions from the origin point given for the right eye. The six directions consisted of:
• Three main directions to the red (R), green (G), and blue (B) primaries.
• Three sub-directions representing an equiangular division between R and G, G and B, and B and R, respectively.
Seven chromaticity points were sampled along each line while uniformly increasing the distance from the origin points for the right eye. Figure 3 illustrates examples of the neighbor selection scheme for the No. 3 and No. 5 points in Fig. 2. The sampling step size is 0.02. Here, the neighbor points were selected from inside of the color gamut of the LCD display. Consequently, the maximum number of neighbor points for each of the eight points for the right eye is 42 (= 6 directions x 7 neighbor points).
We should note that as more samples are examined, more accurate information is obtained to quantify the color fusion limit. In our experiments, however, we compromised regarding the number of stimulus samples to prevent the number of observations from becoming too large for an observer. There were 248 stimuli overall for each of the eight chromaticities: 23 for No. 1, 30 for No. 2, 35 for No. 3, 25 for No. 4, 36 for No. 5, 37 for No. 6, 33 for No. 7, and 29 for No. 8 (see Table 3 and Table 4 in Appendix).
In our experiments, the sample points along each chromaticity vector did not exactly sit on straight lines as shown in Fig. 3. This was mainly due to the LCD monitor calibration. In the conventional LCD color-calibration techniques that exploit gamma correction or tone response correction with look up Tables [16,17], calibrated monitor output included calibration error, which was not negligible for our measurement of the color fusion limit. As such, we utilized a direct measurement method by constructing a mapping table between RGB and tri-stimulus values:
1) We directly measured a set of candidate points in the entire chromaticity diagram. In order to construct the mapping table, first we prepared a set of u'v' values sampled with the step size of 0.005 (i.e., an intended precision of our measurement) in the entire area of the CIE 1976 diagram. Second, the u'v' values (sampled with the step size of 0.005), constrained at a brightness level of 10cd/m2, were transformed to RGB values using gamma correction functions with the gamma values estimated in our monitor calibration. Third, the transformed RGB values were inputted into the left and right LCD monitors, respectively. Finally, the u'v' chromaticity and
luminance values for each input were measured using a spectroradiometer (Minolta
CS-1000®) attached to polarized glasses in front of camera lens. The mapping table
between RGB and tri-stimulus values was constructed using the directly measured values. All procedure was automatically performed by a third-party software program.
2) Among the candidate points in the mapping table, we selected the nearest points to the points on straight lines. The nearest points were used for visual stimuli in our experiment. As a result, Table 3 and Table 4 in Appendix show the u', v', and luminance values of all the visual stimuli. The average u'v' difference between the sample points on straight lines and the nearest points in the mapping table was 0.003 in the Euclidean distance. The colorimetric errors were negligible as low as the intended precision (i.e., 0.005) of our measurement for the color fusion limits.
680 640 590 580 570 560 550 540 530 520 510 500 490 470 460 450 440 430 420 0 0.1 0.2 0.3 0.4 0.5 0.6 0.1 0.2 0.3 0.4 0.5 0.6 u’ v’ 610 600 1 2 3 4 5 6 7 8 680 640 590 580 570 560 550 540 530 520 510 500 490 470 460 450 440 430 420 0 0.1 0.2 0.3 0.4 0.5 0.6 0.1 0.2 0.3 0.4 0.5 0.6 u’ v’ 610 1 2 3 4 5 6 7 8 (b) (a) 480 630 620 480 600 620 630
Fig. 3. Examples of the neighbor selection scheme for the (a) No. 3 and (b) No. 5 sample
points illustrated in Fig. 2. The selections were sampled along straight lines in six directions
with a uniform step size of 0.02. The triangle represents the color gamut of the LCD display used in our experiments. The colors of the selected neighbor points were presented for the left eye.
Fig. 4. Example of a stimulus used in the binocular color fusion limit experiment (a) for the left eye and (b) for the right eye. The test field size was 2° in diameter, and the surrounding field size was 33°.
We used a black background and a circular object filled with the sampled colors. The binocular disparity was zero, indicating no depth perception. Figure 4 shows an example of a stimulus. It consists of different colors for the left and right eyes.
In the experiments, the test field size had a visual angle of 2° and a brightness level of 10 cd/m2. The background intensity was 0.05 cd/m2 and the viewing duration was 15 seconds. Many studies have been conducted to investigate the characteristics related to the dependency on binocular color fusion and rivalry [3]. Hovis provided a useful review of these
dependencies on binocular color fusion [2]. He concluded that color fusion was more likely to occur with a visual field size smaller than 1°. Ikeda and Sagawa also reported that the fusion
increased as the size increased to 45´ and then stayed constant up to 1°20 [4]. Based on this
preliminary observation, they used a 1° visual field size in their experiments on wavelength differences. However, Ikeda and Nakashima pointed out that the variance between observers was not small as a consequence of a small field size, 1° [5]. Thus, they employed larger field sizes of 2° and 10° in their subsequent experiments. From their observations, the wavelength difference values at 2° were somewhat larger than those in a 10° visual field. Color fusion becomes more stable when the absolute luminance of the stimulus is lowered. Qin et al. studied the wavelength difference limit with the four brightness levels of 3 cd/m2, 7.5 cd/m2, 15 cd/m2 and 30 cd/m2 [10]. They showed that the fusion limit becomes smaller as the brightness level increases. Color fusion is more stable with a dark background than with a white background [2]. It is also known that as the viewing duration increases, color fusion becomes more stable. Researchers generally agree that color fusion is more stable with a viewing duration of 3 to 15 seconds [2]. Ikeda and Sagawa also reported that the degree of rivalry increased to 15 seconds and stayed constant up to 25 seconds [4]. From these earlier reports, we designed the experimental parameters for our stimulus.
2.2 Procedure
For the right eye, a sample point was randomly chosen from among the eight sample points depicted in Fig. 2. For the left eye, its neighboring different chromaticity points were presented. An observer was exposed to the stimulus for 15 seconds and reported either fused or nonfused by a forced choice method during a resting time of 10 seconds. After the observations of all neighboring chromaticities were performed, the observations were repeated ten times in a random order [4]. After the ten observations for each pair of the left and right stimuli, the observer chose another sample point for the right eye.
A total of 2480 (= 248 stimuli x 10 observations) trials were recorded for a single observer. The observation process for all of the stimuli was lengthy and induced visual fatigue. Thus, the observations were divided into several test sessions consisting of several 30-min sessions. The observations were stopped immediately when the observer sensed any visual fatigue. The test was conducted under approval from the KAIST Institutional Review Board (IRB).
Based on the results derived from all the observations, the percentage of fused perceptions was calculated for each pair of stimuli. 50 percent of fused perceptions were then used as the color fusion limit [4]. Furthermore, the color fusion limit was quantified as ellipses for the eight sample points in the chromaticity diagram.
3. Results and discussion
The overall results of the observations by a single observer, DH, are presented in Tables 3 and 4 in Appendix. Figure 5 shows three examples of the percentage of fused perceptions, p(%), at the chromaticity point (u´=0.15, v´=0.55) represented by the No. 1 point in Fig. 2 and Table 3. The abscissa represents the Euclidean distance from the point in the u’v´ chromaticity diagram. Each psychometric function shows the percentages for the neighbors in a line of the direction sampled for the left eye. We selected a 50% fused level as the color fusion limit. As indicated in [4], the fusion points were estimated by using linear interpolation between two adjacent points near the 50% of fused level. The fusion points were calculated as follows:
1 ' ' ' ' 1 50 ( ) , i i i i f i i p u u u u p p (1) 1 ' ' ' ' 1 50 ( ) , i i i i f i i p v v v v p p (2)
where u'i and v '
i denote the first chromaticity sample point at the below 50% of fused level, and pi denotes the percentage of fused perceptions at the point i, and u'f and v'f denote the fused chromaticity point for the color fusion limit. For example, pi=40, pi-1=80, (u'i=0.2505, v'i =0.5429), and (u'i-1=0.2307, v
'
i-1=0.5450) were read out in Fig. 5(a) and Table 3. Using Eq. (1)
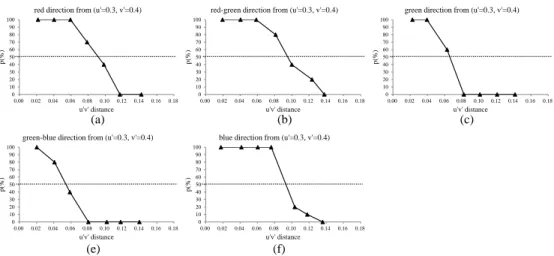
and Eq. (2), the color fusion limit was computed as (u'f=0.2456, v'f=0.5434) for the red direction. Similarly, from the observed psychometric function in Fig. 5(b) and Fig. 5(c), the color fusion limits were interpreted as (u'f=0.1588, v'f=0.4727) for the blue direction, and (u'f=0.2204, v'f=0.4793) for the blue-red direction. Figure 6 shows another example of the percentage of fused perceptions at the No. 6 point (u´=0.3, v´=0.4). In the same way, the chromaticity points of the color fusion limits were obtained as follows: (u'f=0.3710, v'f=0.4585) for the red direction, (u'f = 0.3057, v'f = 0.4952) for the red-green direction, (u'f = 0.2500, v'f=0.4431) for the green direction, (u'f=0.2462, v'f=0.3925) for the green-blue direction, and (u'f=0.2577, v'f=0.3170) for the blue direction, respectively.
(a) (b) (c) 0 10 20 30 40 50 60 70 80 90 100 0.00 0.02 0.04 0.06 0.08 0.10 0.12 0.14 0.16 0.18 p(%) u'v' distance red direction from (u'=0.15, v'=0.55)
pi
pi-1 (ui-1, vi-1)
(ui, vi) 0 10 20 30 40 50 60 70 80 90 100 0.00 0.02 0.04 0.06 0.08 0.10 0.12 0.14 0.16 0.18 p(%) u'v' distance blue direction from (u'=0.15, v'=0.55)
0 10 20 30 40 50 60 70 80 90 100 0.00 0.02 0.04 0.06 0.08 0.10 0.12 0.14 0.16 0.18 p(%) u'v' distance blue-red direction from (u'=0.15, v'=0.55)
Fig. 5. Percentage of fused perceptions regarding the left stimuli sampled in each neighbor’s direction from the No. 1 point (u´=0.15, v´=0.55). The abscissa represents the Euclidean distance from the point (u´=0.15, v´=0.55). p(%) denotes the percentage of fused perceptions. Observer: DH. (a) Red direction, (b) blue direction, and (c) blue-red direction.
(a) (b) (c) (e) (f) 0 10 20 30 40 50 60 70 80 90 100 0.00 0.02 0.04 0.06 0.08 0.10 0.12 0.14 0.16 0.18 p(%) u'v' distance red direction from (u'=0.3, v'=0.4)
0 10 20 30 40 50 60 70 80 90 100 0.00 0.02 0.04 0.06 0.08 0.10 0.12 0.14 0.16 0.18 p(%) u'v' distance red-green direction from (u'=0.3, v'=0.4)
0 10 20 30 40 50 60 70 80 90 100 0.00 0.02 0.04 0.06 0.08 0.10 0.12 0.14 0.16 0.18 p(%) u'v' distance green direction from (u'=0.3, v'=0.4)
0 10 20 30 40 50 60 70 80 90 100 0.00 0.02 0.04 0.06 0.08 0.10 0.12 0.14 0.16 0.18 p(%) u'v' distance green-blue direction from (u'=0.3, v'=0.4)
0 10 20 30 40 50 60 70 80 90 100 0.00 0.02 0.04 0.06 0.08 0.10 0.12 0.14 0.16 0.18 p(%) u'v' distance blue direction from (u'=0.3, v'=0.4)
Fig. 6. Percentage of fused perceptions regarding the left stimuli sampled in each neighbor’s direction from the No. 6 point (u´=0.3, v´=0.4). Observer: DH. (a) Red direction, (b) red-green direction (c) green direction (d) green-blue direction, and (e) blue direction.
Based on the results of the percentage of fused perceptions, we observed that the shape of the chromaticity points of the color fusion limit could be represented by ellipses. To confirm the shape of the color fusion limit, four additional neighboring directions from the No. 3 point were tested. The four additional directions also represented an equiangular division between the five directions from the No. 3 point. Thus, a total of nine chromaticity points of the color fusion limit were measured for the No. 3 point. For the nine chromaticity points, the sums of square errors in the regression of the ellipse and circle were 0.3912 and 0.4311, respectively.
From the above observations, we modeled the color fusion limit using a set of ellipses [9]. This can be defined as
2 2
1 2 1 2
2 2
(( ' ) cos ( ' )sin ) ( ( ' )sin ( ' ) cos ) 1, u C v C u C v C a b (3)
where a and b are the semi-minor and semi-major axes from the center point (C1, C2),
respectively, and θ is the rotation angle of the ellipse. The parameters of the ellipse were obtained by nonlinear regression. In addition, we examined the goodness-of-fit statistics for the nonlinear regressions: the sum of squares due to error (SSE) and R-squared value referred from [18, 19]. The SSE, also called the residual sum of squares, was measured by the sum of squared algebraic distances as follows:
2
2 2
' ' ' '
1 2 1 2
1
( ) cos ( ) sin ( ) sin ( ) cos
1 ,
n f f f f f u C v C u C v C SSE a b (4)where a, b, and θ denote the parameters of the ellipse model, and where u'f and v
'
f denote the fused chromaticity point of the color fusion limit [18]. The fitting of an ellipse was realized by minimizing the sum of squared algebraic distances. As for iterative estimation algorithm, “Levenberg-Marquardt” method was adopted for the purpose of estimating the nonlinear function. The iterations were stopped when a convergence criterion was reached. The convergence criterion used was 1.0e8. For the ellipse represented in Fig. 7(a), C1 was 0.15, C2
was 0.55, a was 0.0707, b was 0.1049, and θ was 62.0273 degrees, respectively. The standard errors of the regression are 0 for a, 0 for b, and 0.0189 for θ. Also, for the goodness-of-fit statistics for the nonlinear regress, the SSE was 3.76e07 and R-squared value was 1.
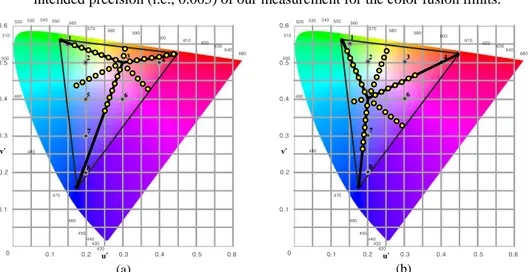
Figure 7 and Fig. 8 represent the ellipses that quantify the color fusion limit for each of the eight chromaticity points. All of the ellipses are plotted in the same scale. Table 2 summarizes the estimated parameter values and the goodness-of-fit statistics of the ellipses for the eight points. Figure 9 represents the overall results of the color fusion limit plotted on the CIE 1976 chromaticity diagram. For clarity, the plots are downscaled to one third of their actual lengths. In summary, the semi-minor axis, a, of the ellipses ranges from 0.0415 to 0.0923 in terms of the Euclidean distance in the u’v´ chromaticity diagram, whereas the semi-major axis, b, ranges from 0.0640 to 0.1560. The average of the a values is 0.0641 and the average of the b values is 0.1054.
The color fusion limit is not modeled as equal-sized circles in the standard uniform chromaticity diagram. It should be noted that the color fusion limit is modeled by a set of ellipses whose shapes and directions of rotation are similar to those of MacAdam ellipses for the just-noticeable differences of chromaticity [9,11]. For example, the ellipse for the No. 1 point has an elongated shape along the direction of the second and fourth quadrants in the u’v´ plane (see Fig. 7(a)). The ellipse for the No. 4 point has an oval shape with the major radius along the u´ axis (see Fig. 8(b)). The ellipse for the No. 8 point has an elongated shape along the v´ axis (see Fig. 8(f)). The ellipses of the other points also look similar in terms of their shape and direction of rotation. However, we cannot directly compare the two ellipses, as the observed points of the color fusion limit are different from those of the color difference; moreover, the MacAdam ellipses transformed to the u´v´ chromaticity diagram are not ellipses in a strict mathematical sense (their shapes closely resemble those of ellipses) [12].
(a)
(b)
0.35 0.40 0.45 0.50 0.55 0.60 0.65 0.70 0.75 -0.05 0.00 0.05 0.10 0.15 0.20 0.25 0.30 0.35 red green green-blue blue blue-red v' u' v' 0.30 0.35 0.40 0.45 0.50 0.55 0.60 0.65 0.70 0.00 0.05 0.10 0.15 0.20 0.25 0.30 0.35 0.40 red red-green green green-blue blue blue-red u' v' v'(e)
(f)
0.20 0.25 0.30 0.35 0.40 0.45 0.50 0.55 0.60 0.00 0.05 0.10 0.15 0.20 0.25 0.30 0.35 0.40 red red-green green green-blue blue blue-red u' v' 0.20 0.25 0.30 0.35 0.40 0.45 0.50 0.55 0.60 0.10 0.15 0.20 0.25 0.30 0.35 0.40 0.45 0.50 red red-green green green-blue blue blue-red u' v'(c)
(d)
0.30 0.35 0.40 0.45 0.50 0.55 0.60 0.65 0.70 0.10 0.15 0.20 0.25 0.30 0.35 0.40 0.45 0.50 red red-green green green-blue blue blue-red u' v' 0.30 0.35 0.40 0.45 0.50 0.55 0.60 0.65 0.70 0.20 0.25 0.30 0.35 0.40 0.45 0.50 0.55 0.60 red red-green green green-blue blue blue-red u' v'Fig. 7. Binocular color fusion limit for each of the chromaticity points in Fig. 2. The
parameters of the ellipses were obtained by nonlinear regression. (a) No. 1 point (u´ = 0.15, v´ = 0.55), (b) No. 2 point (u´ = 0.2, v´ = 0.5), (c) No. 3 point (u´ = 0.3, v´ = 0.5), (d) No. 4 point (u´ = 0.4, v´ = 0.5), (e) No. 5 point (u´ = 0.2, v´ = 0.4), and (f) No. 6 point (u´ = 0.3, v´ = 0.4). The fusion limit along each line was marked.
0.10 0.15 0.20 0.25 0.30 0.35 0.40 0.45 0.50 0.00 0.05 0.10 0.15 0.20 0.25 0.30 0.35 0.40 red red-green green green-blue blue blue-red u' v' 0.00 0.05 0.10 0.15 0.20 0.25 0.30 0.35 0.40 0.00 0.05 0.10 0.15 0.20 0.25 0.30 0.35 0.40 red red-green green green-blue blue u' v'
(a)
(b)
Fig. 8. Binocular color fusion limit for each of the chromaticity points in Fig. 2. The parameters of the ellipses were obtained by nonlinear regression. (a) No. 7 point (u´ = 0.2, v´ = 0.3), and (b) No. 8 point (u´ = 0.2, v´ = 0.2). The fusion limit along each line was marked.
Table 2. Estimated Parameter Values and the Goodness-of-Fit Statistics of Ellipses for Each of the Eight Chromaticity Points.
Sample No.
Chromaticity point Estimate Std. Error
SSE R-square
u´ v´ a b θ(degree) a b θ(degree)
1 0.15 0.55 0.0707 0.1049 62.0273 0 0 0.0189 3.76e07 1.0000 2 0.2 0.5 0.0477 0.0640 111.8408 0.0014 0.0017 3.3736 0.0276 0.9932 3 0.3 0.5 0.0772 0.0871 118.5364 0.0067 0.0067 29.7165 0.2563 0.9783 4 0.4 0.5 0.0923 0.1253 103.4114 0 0 0 2.77e31 1.0000 5 0.2 0.4 0.0653 0.1232 1.5731 0.0016 0.0032 1.8604 0.0292 0.9988 6 0.3 0.4 0.0609 0.1014 20.4477 0.0037 0.0064 5.2179 0.1640 0.9841 7 0.2 0.3 0.0415 0.0810 15.2235 0.0023 0.0048 4.8822 0.1219 0.9836 8 0.2 0.2 0.0569 0.1560 5.3398 0 0 0 7.35e31 1.0000 680 640 590 580 570 560 550 540 530 520 510 500 490 480 470 460 450 440 430 420 0 0.1 0.2 0.3 0.4 0.5 0.6 0.1 0.2 0.3 0.4 0.5 0.6 u’ v’ 630 620 610 600
Fig. 9. Overall results of the color fusion limit plotted on the CIE 1976 chromaticity diagram. For clarity, the ellipses are downscaled to one third of their actual lengths.
To check the consistency of our measurement with the result of a previous study, we also compared our results with the results of a white point. Ikeda et al. [4] reported that the color fusion limit for a white point (u=0.1864, v=0.3196) was obtained in the form of a circle with a radius of about 0.0792 in the CIE 1960 uv chromaticity diagram. For the comparison, the color fusion limit was measured along the lines of the red and blue directions from the white point. The color fusion limits, as represented in the Euclidean distance from the white point in the CIE 1960 uv plane, were 0.0833 for the red direction and 0.0673 for the blue direction. Both values were close to Ikeda’s result of 0.0792.
Furthermore, one of the present authors, YJ, made observations to confirm the above results of the color fusion limit obtained from DH’s observations. As mentioned earlier, only four important chromaticity points were tested to avoid undue visual fatigue. The four points were the three points near the R, G, and B primaries (No. 1, No. 4, and No. 8) and one point near the center of the chromaticity diagram (No. 5). We observed that DH’s curves did not significantly differ from those of YJ. The average differences of the color fusion limits, represented in the Euclidean distance in the u´v´ plane, were 0.0124 for the No. 1 point, 0.0023 for the No. 4 point, 0.0132 for the No. 5 point, and 0.0108 for the No. 8 point, respectively. The average difference of the color fusion limits for the four points was 0.0102 in terms of the u’v´ distance. The data for the two observers indicate that their color sensitivity and stereo vision are not different. In clinical tests, the two observers had normal color vision and normal stereo vision: Visual acuities for DH and YJ were 20/25 and 20/20, respectively, in the Snellen chart. Both had normal color vision according to the Ishihara test. In the Farnsworth-Munsell 100-hue arrangement test, the total error scores for DH and YJ were 7 and 0, respectively. A zero score indicates the perfect arrangement of colors, and a large total error score indicates a high number of color misplacements [13]. Both had very low score, that is, high color acuity. Moreover, both had stereo acuity of 40 seconds of arc in the Titmus stereo fly test.
In addition, a better fit may be searched for the observed psychometric functions instead of linear interpolation as in Figs. 5 and 6. To investigate the fitting of psychometric functions, we fitted the observed psychometric function with a logistic function [20]. In order to compare the difference between the use of linear interpolation and the fitting of a logistic function, we measured the Euclidean distance between the color fusion limits obtained by two methods. The average difference value of the color fusion limits was 0.0028 for all the eight chromaticity points. Consequently, the difference in the fitting results was not much to affect the measurement of color fusion limits.
4. Conclusions
Previous research investigated the binocular color fusion limit for spectral colors, represented as the wavelength difference. However, an investigation of the color fusion limit for non-spectral colors has not been done thus far. Hence, we conducted a quantitative investigation of the color fusion limit for non-spectral colors. The measurements were made at eight chromaticity points on the standard CIE 1976 chromaticity diagram. For the eight chromaticity points, the results of the color fusion limit were represented as a series of ellipses. The semi-minor axis of the ellipses ranged from 0.0415 to 0.0923 in the Euclidean distance in the u’v´ chromaticity diagram while the semi-major axis ranged from 0.0640 to 0.1560. The shapes and directions of rotation of the ellipses were similar to those of MacAdam ellipses for the just-noticeable differences of chromaticity.
We expect that our quantification of the color fusion limit will be utilized for various applications, such as an automatic stereo analyzer to guide content creators in the creation of visually comfortable stereoscopic contents, safety guidelines for watching 3DTV, and stereoscopic video quality metrics.
Appendix
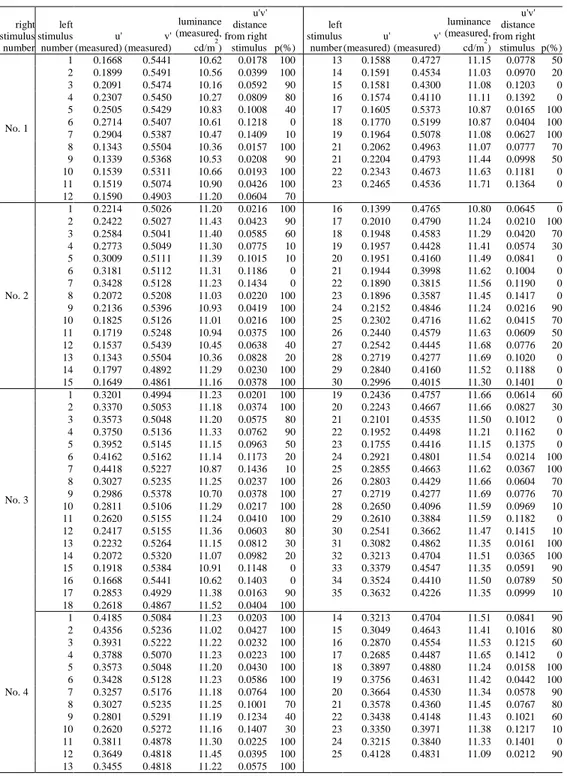
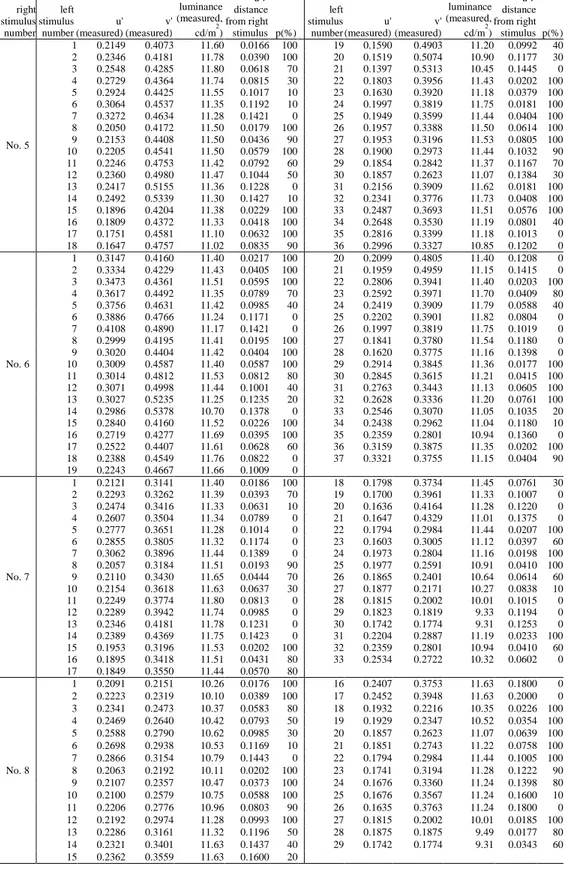
Table 3. Stimuli and Percentages of Fused Perceptions for Binocular Color Fusion. p(%) Refers to the Percentage of Fused Perceptions.
right stimulus number left stimulus number u' (measured) v' (measured) luminance (measured, cd/m2) u'v' distance from right stimulus p(%) left stimulus number u' (measured) v' (measured) luminance (measured, cd/m2) u'v' distance from right stimulus p(%) No. 1 1 0.1668 0.5441 10.62 0.0178 100 13 0.1588 0.4727 11.15 0.0778 50 2 0.1899 0.5491 10.56 0.0399 100 14 0.1591 0.4534 11.03 0.0970 20 3 0.2091 0.5474 10.16 0.0592 90 15 0.1581 0.4300 11.08 0.1203 0 4 0.2307 0.5450 10.27 0.0809 80 16 0.1574 0.4110 11.11 0.1392 0 5 0.2505 0.5429 10.83 0.1008 40 17 0.1605 0.5373 10.87 0.0165 100 6 0.2714 0.5407 10.61 0.1218 0 18 0.1770 0.5199 10.87 0.0404 100 7 0.2904 0.5387 10.47 0.1409 10 19 0.1964 0.5078 11.08 0.0627 100 8 0.1343 0.5504 10.36 0.0157 100 21 0.2062 0.4963 11.07 0.0777 70 9 0.1339 0.5368 10.53 0.0208 90 21 0.2204 0.4793 11.44 0.0998 50 10 0.1539 0.5311 10.66 0.0193 100 22 0.2343 0.4673 11.63 0.1181 0 11 0.1519 0.5074 10.90 0.0426 100 23 0.2465 0.4536 11.71 0.1364 0 12 0.1590 0.4903 11.20 0.0604 70 No. 2 1 0.2214 0.5026 11.20 0.0216 100 16 0.1399 0.4765 10.80 0.0645 0 2 0.2422 0.5027 11.43 0.0423 90 17 0.2010 0.4790 11.24 0.0210 100 3 0.2584 0.5041 11.40 0.0585 60 18 0.1948 0.4583 11.29 0.0420 70 4 0.2773 0.5049 11.30 0.0775 10 19 0.1957 0.4428 11.41 0.0574 30 5 0.3009 0.5111 11.39 0.1015 10 20 0.1951 0.4160 11.49 0.0841 0 6 0.3181 0.5112 11.31 0.1186 0 21 0.1944 0.3998 11.62 0.1004 0 7 0.3428 0.5128 11.23 0.1434 0 22 0.1890 0.3815 11.56 0.1190 0 8 0.2072 0.5208 11.03 0.0220 100 23 0.1896 0.3587 11.45 0.1417 0 9 0.2136 0.5396 10.93 0.0419 100 24 0.2152 0.4846 11.24 0.0216 90 10 0.1825 0.5126 11.01 0.0216 100 25 0.2302 0.4716 11.62 0.0415 70 11 0.1719 0.5248 10.94 0.0375 100 26 0.2440 0.4579 11.63 0.0609 50 12 0.1537 0.5439 10.45 0.0638 40 27 0.2542 0.4445 11.68 0.0776 20 13 0.1343 0.5504 10.36 0.0828 20 28 0.2719 0.4277 11.69 0.1020 0 14 0.1797 0.4892 11.29 0.0230 100 29 0.2840 0.4160 11.52 0.1188 0 15 0.1649 0.4861 11.16 0.0378 100 30 0.2996 0.4015 11.30 0.1401 0 No. 3 1 0.3201 0.4994 11.23 0.0201 100 19 0.2436 0.4757 11.66 0.0614 60 2 0.3370 0.5053 11.18 0.0374 100 20 0.2243 0.4667 11.66 0.0827 30 3 0.3573 0.5048 11.20 0.0575 80 21 0.2101 0.4535 11.50 0.1012 0 4 0.3750 0.5136 11.33 0.0762 90 22 0.1952 0.4498 11.21 0.1162 0 5 0.3952 0.5145 11.15 0.0963 50 23 0.1755 0.4416 11.15 0.1375 0 6 0.4162 0.5162 11.14 0.1173 20 24 0.2921 0.4801 11.54 0.0214 100 7 0.4418 0.5227 10.87 0.1436 10 25 0.2855 0.4663 11.62 0.0367 100 8 0.3027 0.5235 11.25 0.0237 100 26 0.2803 0.4429 11.66 0.0604 70 9 0.2986 0.5378 10.70 0.0378 100 27 0.2719 0.4277 11.69 0.0776 70 10 0.2811 0.5106 11.29 0.0217 100 28 0.2650 0.4096 11.59 0.0969 10 11 0.2620 0.5155 11.24 0.0410 100 29 0.2610 0.3884 11.59 0.1182 0 12 0.2417 0.5155 11.36 0.0603 80 30 0.2541 0.3662 11.47 0.1415 10 13 0.2232 0.5264 11.15 0.0812 30 31 0.3082 0.4862 11.35 0.0161 100 14 0.2072 0.5320 11.07 0.0982 20 32 0.3213 0.4704 11.51 0.0365 100 15 0.1918 0.5384 10.91 0.1148 0 33 0.3379 0.4547 11.35 0.0591 90 16 0.1668 0.5441 10.62 0.1403 0 34 0.3524 0.4410 11.50 0.0789 50 17 0.2853 0.4929 11.38 0.0163 90 35 0.3632 0.4226 11.35 0.0999 10 18 0.2618 0.4867 11.52 0.0404 100 No. 4 1 0.4185 0.5084 11.23 0.0203 100 14 0.3213 0.4704 11.51 0.0841 90 2 0.4356 0.5236 11.02 0.0427 100 15 0.3049 0.4643 11.41 0.1016 80 3 0.3931 0.5222 11.22 0.0232 100 16 0.2870 0.4554 11.53 0.1215 60 4 0.3788 0.5070 11.23 0.0223 100 17 0.2685 0.4487 11.65 0.1412 0 5 0.3573 0.5048 11.20 0.0430 100 18 0.3897 0.4880 11.24 0.0158 100 6 0.3428 0.5128 11.23 0.0586 100 19 0.3756 0.4631 11.42 0.0442 100 7 0.3257 0.5176 11.18 0.0764 100 20 0.3664 0.4530 11.34 0.0578 90 8 0.3027 0.5235 11.25 0.1001 70 21 0.3578 0.4360 11.45 0.0767 80 9 0.2801 0.5291 11.19 0.1234 40 22 0.3438 0.4148 11.43 0.1021 60 10 0.2620 0.5272 11.16 0.1407 30 23 0.3350 0.3971 11.38 0.1217 10 11 0.3811 0.4878 11.30 0.0225 100 24 0.3215 0.3840 11.33 0.1401 0 12 0.3649 0.4818 11.45 0.0395 100 25 0.4128 0.4831 11.09 0.0212 90 13 0.3455 0.4818 11.22 0.0575 100
Table 4. Continued. right stimulus number left stimulus number u' (measured) v' (measured) luminance (measured, cd/m2) u'v' distance from right stimulus p(%) left stimulus number u' (measured) v' (measured) luminance (measured, cd/m2) u'v' distance from right stimulus p(%) No. 5 1 0.2149 0.4073 11.60 0.0166 100 19 0.1590 0.4903 11.20 0.0992 40 2 0.2346 0.4181 11.78 0.0390 100 20 0.1519 0.5074 10.90 0.1177 30 3 0.2548 0.4285 11.80 0.0618 70 21 0.1397 0.5313 10.45 0.1445 0 4 0.2729 0.4364 11.74 0.0815 30 22 0.1803 0.3956 11.43 0.0202 100 5 0.2924 0.4425 11.55 0.1017 10 23 0.1630 0.3920 11.18 0.0379 100 6 0.3064 0.4537 11.35 0.1192 10 24 0.1997 0.3819 11.75 0.0181 100 7 0.3272 0.4634 11.28 0.1421 0 25 0.1949 0.3599 11.44 0.0404 100 8 0.2050 0.4172 11.50 0.0179 100 26 0.1957 0.3388 11.50 0.0614 100 9 0.2153 0.4408 11.50 0.0436 90 27 0.1953 0.3196 11.53 0.0805 100 10 0.2205 0.4541 11.50 0.0579 100 28 0.1900 0.2973 11.44 0.1032 90 11 0.2246 0.4753 11.42 0.0792 60 29 0.1854 0.2842 11.37 0.1167 70 12 0.2360 0.4980 11.47 0.1044 50 30 0.1857 0.2623 11.07 0.1384 30 13 0.2417 0.5155 11.36 0.1228 0 31 0.2156 0.3909 11.62 0.0181 100 14 0.2492 0.5339 11.30 0.1427 10 32 0.2341 0.3776 11.73 0.0408 100 15 0.1896 0.4204 11.38 0.0229 100 33 0.2487 0.3693 11.51 0.0576 100 16 0.1809 0.4372 11.33 0.0418 100 34 0.2648 0.3530 11.19 0.0801 40 17 0.1751 0.4581 11.10 0.0632 100 35 0.2816 0.3399 11.18 0.1013 0 18 0.1647 0.4757 11.02 0.0835 90 36 0.2996 0.3327 10.85 0.1202 0 No. 6 1 0.3147 0.4160 11.40 0.0217 100 20 0.2099 0.4805 11.40 0.1208 0 2 0.3334 0.4229 11.43 0.0405 100 21 0.1959 0.4959 11.15 0.1415 0 3 0.3473 0.4361 11.51 0.0595 100 22 0.2806 0.3941 11.40 0.0203 100 4 0.3617 0.4492 11.35 0.0789 70 23 0.2592 0.3971 11.70 0.0409 80 5 0.3756 0.4631 11.42 0.0985 40 24 0.2419 0.3909 11.79 0.0588 40 6 0.3886 0.4766 11.24 0.1171 0 25 0.2202 0.3901 11.82 0.0804 0 7 0.4108 0.4890 11.17 0.1421 0 26 0.1997 0.3819 11.75 0.1019 0 8 0.2999 0.4195 11.41 0.0195 100 27 0.1841 0.3780 11.54 0.1180 0 9 0.3020 0.4404 11.42 0.0404 100 28 0.1620 0.3775 11.16 0.1398 0 10 0.3009 0.4587 11.40 0.0587 100 29 0.2914 0.3845 11.36 0.0177 100 11 0.3014 0.4812 11.53 0.0812 80 30 0.2845 0.3615 11.21 0.0415 100 12 0.3071 0.4998 11.44 0.1001 40 31 0.2763 0.3443 11.13 0.0605 100 13 0.3027 0.5235 11.25 0.1235 20 32 0.2628 0.3336 11.20 0.0761 100 14 0.2986 0.5378 10.70 0.1378 0 33 0.2546 0.3070 11.05 0.1035 20 15 0.2840 0.4160 11.52 0.0226 100 34 0.2438 0.2962 11.04 0.1180 10 16 0.2719 0.4277 11.69 0.0395 100 35 0.2359 0.2801 10.94 0.1360 0 17 0.2522 0.4407 11.61 0.0628 60 36 0.3159 0.3875 11.35 0.0202 100 18 0.2388 0.4549 11.76 0.0822 0 37 0.3321 0.3755 11.15 0.0404 90 19 0.2243 0.4667 11.66 0.1009 0 No. 7 1 0.2121 0.3141 11.40 0.0186 100 18 0.1798 0.3734 11.45 0.0761 30 2 0.2293 0.3262 11.39 0.0393 70 19 0.1700 0.3961 11.33 0.1007 0 3 0.2474 0.3416 11.33 0.0631 10 20 0.1636 0.4164 11.28 0.1220 0 4 0.2607 0.3504 11.34 0.0789 0 21 0.1647 0.4329 11.01 0.1375 0 5 0.2777 0.3651 11.28 0.1014 0 22 0.1794 0.2984 11.44 0.0207 100 6 0.2855 0.3805 11.32 0.1174 0 23 0.1603 0.3005 11.12 0.0397 60 7 0.3062 0.3896 11.44 0.1389 0 24 0.1973 0.2804 11.16 0.0198 100 8 0.2057 0.3184 11.51 0.0193 90 25 0.1977 0.2591 10.91 0.0410 100 9 0.2110 0.3430 11.65 0.0444 70 26 0.1865 0.2401 10.64 0.0614 60 10 0.2154 0.3618 11.63 0.0637 30 27 0.1877 0.2171 10.27 0.0838 10 11 0.2249 0.3774 11.80 0.0813 0 28 0.1815 0.2002 10.01 0.1015 0 12 0.2289 0.3942 11.74 0.0985 0 29 0.1823 0.1819 9.33 0.1194 0 13 0.2346 0.4181 11.78 0.1231 0 30 0.1742 0.1774 9.31 0.1253 0 14 0.2389 0.4369 11.75 0.1423 0 31 0.2204 0.2887 11.19 0.0233 100 15 0.1953 0.3196 11.53 0.0202 100 32 0.2359 0.2801 10.94 0.0410 60 16 0.1895 0.3418 11.51 0.0431 80 33 0.2534 0.2722 10.32 0.0602 0 17 0.1849 0.3550 11.44 0.0570 80 No. 8 1 0.2091 0.2151 10.26 0.0176 100 16 0.2407 0.3753 11.63 0.1800 0 2 0.2223 0.2319 10.10 0.0389 100 17 0.2452 0.3948 11.63 0.2000 0 3 0.2341 0.2473 10.37 0.0583 80 18 0.1932 0.2216 10.35 0.0226 100 4 0.2469 0.2640 10.42 0.0793 50 19 0.1929 0.2347 10.52 0.0354 100 5 0.2588 0.2790 10.62 0.0985 30 20 0.1857 0.2623 11.07 0.0639 100 6 0.2698 0.2938 10.53 0.1169 10 21 0.1851 0.2743 11.22 0.0758 100 7 0.2866 0.3154 10.79 0.1443 0 22 0.1794 0.2984 11.44 0.1005 100 8 0.2063 0.2192 10.11 0.0202 100 23 0.1741 0.3194 11.28 0.1222 90 9 0.2107 0.2357 10.47 0.0373 100 24 0.1676 0.3360 11.24 0.1398 80 10 0.2100 0.2579 10.75 0.0588 100 25 0.1676 0.3567 11.24 0.1600 10 11 0.2206 0.2776 10.96 0.0803 90 26 0.1635 0.3763 11.24 0.1800 0 12 0.2192 0.2974 11.28 0.0993 100 27 0.1815 0.2002 10.01 0.0185 100 13 0.2286 0.3161 11.32 0.1196 50 28 0.1875 0.1875 9.49 0.0177 80 14 0.2321 0.3401 11.63 0.1437 40 29 0.1742 0.1774 9.31 0.0343 60 15 0.2362 0.3559 11.63 0.1600 20
Acknowledgements
A male volunteer, Mr. DH Kim, participated in the observations. The authors acknowledge his interest and patience.