Ahn
Kyung-Sup Kim, Goo-Taeg Oh and Yong-Ho
Kim,
Kwon, Tae-Hyun Kim, Jin-Sik Bae, Hail
Seung-Soon Im, Mi-Young Kim, Sool-Ki
Mice
db/db
Expression in Fasting and
Hepatic Glucose-6-phosphatase Gene
Is Responsible for the Up-regulation of
α
Peroxisome Proliferator-activated Receptor
Metabolism:
doi: 10.1074/jbc.M110.157875 originally published online November 16, 2010 2011, 286:1157-1164.
J. Biol. Chem.
10.1074/jbc.M110.157875 Access the most updated version of this article at doi:
. JBC Affinity Sites Find articles, minireviews, Reflections and Classics on similar topics on the
Alerts:
When a correction for this article is posted •
When this article is cited •
to choose from all of JBC's e-mail alerts Click here
Supplemental material:
http://www.jbc.org/content/suppl/2010/11/16/M110.157875.DC1.html http://www.jbc.org/content/286/2/1157.full.html#ref-list-1This article cites 58 references, 37 of which can be accessed free at
at YONSEI UNIVERSITY on November 13, 2013
http://www.jbc.org/
Downloaded from
at YONSEI UNIVERSITY on November 13, 2013
http://www.jbc.org/
Peroxisome Proliferator-activated Receptor
␣ Is Responsible
for the Up-regulation of Hepatic Glucose-6-phosphatase
Gene Expression in Fasting and db/db Mice
*
□SReceived for publication, June 23, 2010, and in revised form, October 25, 2010Published, JBC Papers in Press, November 16, 2010, DOI 10.1074/jbc.M110.157875
Seung-Soon Im‡§¶1, Mi-Young Kim‡§1, Sool-Ki Kwon‡§, Tae-Hyun Kim‡§储, Jin-Sik Bae‡§, Hail Kim‡§, Kyung-Sup Kim‡§储, Goo-Taeg Oh**, and Yong-Ho Ahn*‡§储2
From the‡Department of Biochemistry and Molecular Biology, the储Brain Korea 21 Project for Medical Sciences, and the§Center for Chronic Metabolic Disease Research, Yonsei University College of Medicine, Seoul 120-752, Republic of Korea, the¶Metabolic Signaling and Disease Program, Sanford-Burnham Medical Research Institute, Orlando, Florida 32827, and the **Laboratory of Cardiovascular Genomics, Division of Life and Pharmaceutical Sciences, Ewha Womans University, Seoul 120-750, Republic of Korea
Glucose-6-phosphatase (G6Pase) is a key enzyme that is re-sponsible for the production of glucose in the liver during fast-ing or in type 2 diabetes mellitus (T2DM). Durfast-ing fastfast-ing or in T2DM, peroxisome proliferator-activated receptor␣(PPAR␣) is activated, which may contribute to increased hepatic glucose output. However, the mechanism by which PPAR␣ up-regu-lates hepatic G6Pase gene expression in these states is not well understood. We evaluated the mechanism by which PPAR␣ up-regulates hepatic G6Pase gene expression in fasting and T2DM states. In PPAR␣-null mice, both hepatic G6Pase and phosphoenolpyruvate carboxykinase levels were not in-creased in the fasting state. Moreover, treatment of primary cultured hepatocytes with Wy14,643 or fenofibrate increased the G6Pase mRNA level. In addition, we have localized and characterized a PPAR-responsive element in the promoter re-gion of the G6Pase gene. Chromatin immunoprecipitation (ChIP) assay revealed that PPAR␣binding to the putative PPAR-responsive element of the G6Pase promoter was in-creased in fasted wild-type mice and db/db mice. These results indicate that PPAR␣is responsible for glucose production through the up-regulation of hepatic G6Pase gene expression during fasting or T2DM animal models.
Gluconeogenesis is a metabolic adaptation that occurs dur-ing energy deprivation, such as fastdur-ing in mammals. Durdur-ing the fasting state, blood glucose levels are maintained by glu-coneogenesis in liver. In patients with type 2 diabetes mellitus (T2DM),3gluconeogenesis contributes in part to the
chroni-cally elevated blood glucose levels (1). In this state, free fatty acids are elevated and have been implicated as a cause of insu-lin resistance (2). In addition, free fatty acids have been shown to increase hepatic glucose production by activating key en-zymes of gluconeogenesis like phosphoenolpyruvate car-boxykinase (PEPCK), fructose-1,6-bisphosphatase, and glu-cose-6-phosphatase (G6Pase) (3– 6).
G6Pase (EC 3.1.3.9) is expressed mainly in the liver, kidney, and-cells of the pancreas where the enzyme hydrolyzes glu-cose 6-phosphate to gluglu-cose at the final step of gluconeogene-sis (7). It is a multienzyme complex congluconeogene-sisting of catalytic and transporter subunits. The G6Pase catalytic subunit gene is positively controlled at the transcriptional level by glucocorti-coids, cAMP, glucose, and fatty acids (8 –10), whereas its gene expression is inhibited by insulin, tumor necrosis factor-␣, and interleukin-6 (11, 12). Studies have shown that G6Pase activity is increased in T2DM-associated hyperglycemia and hyperlipidemia (5, 8), and the G6Pase mRNA level is also ele-vated in diabetic animal models (13–15). Furthermore, over-expression of the G6Pase gene in rat liver resulted in glucose intolerance and hyperinsulinemia (16).
The peroxisome proliferator-activated receptors (PPARs) are a family of nuclear receptors that act as transcription fac-tors for regulating energy balance in lipid and glucose homeo-stasis (17). The receptor family is composed of three isotypes: ␣, ␥, and ␦. PPAR␣ is expressed mainly in brown adipose tis-sue and liver, but it is also present in the heart, kidney, and skeletal muscle (18). PPAR␥ is expressed predominantly in adipose tissue where it plays key roles in adipocyte differentia-tion and lipogenesis (18, 19). The PPAR␦ isoform is ubiqui-tously expressed, but its function is not well defined (18). In relation to their DNA binding, ligand binding, and cofactor binding domains, the PPARs share a high degree of structural homology with other nuclear hormone receptors (20). The PPARs function by forming heterodimers with retinoid X re-ceptor␣ (RXR␣) and transduce intracellular signals when ligands bind to the dimerized complex. The PPAR␣/RXR␣ heterodimer activates gene expression by binding to a cis-*This work was supported by the Basic Science Research Program of the
National Research Foundation of Korea, funded by the Ministry of Educa-tion, Science, and Technology Grant 2009-0080655 (Y.-H. A.) and by Ko-rea Healthcare Technology R&D Project, Ministry for Health, Welfare, and Family Affairs, Republic of Korea, Grant A091014 (M.-Y. K.).
□S
The on-line version of this article (available at http://www.jbc.org) con-tainssupplemental Figs. 1 and 2.
1Both authors contributed equally to this work.
2To whom correspondence should be addressed: Dept. of Biochemistry and Molecular Biology, Yonsei University College of Medicine, 134 Shin-chon-dong, Seodaemoon-gu, Seoul 120-752, Republic of Korea. Tel.: 82-2-2228-1675; Fax: 82-2-312-5041; E-mail: yha111@yuhs.ac.
3The abbreviations used are: T2DM, type 2 diabetes mellitus; Gck, glucoki-nase; G6Pase, glucose-6-phosphatase; L-PK, liver-type pyruvate kiglucoki-nase; PEPCK, phosphoenolpyruvate carboxykinase; PPAR, peroxisome
prolif-erator-activated receptor; PPRE, PPAR response element; qPCR, quantita-tive real-time PCR; RXR, retinoid X receptor; PGC-1␣, peroxisome prolif-erator-activated receptor gamma coactivator 1 alpha; HNF-4␣, hepatic nuclear factor 4 alpha.
at YONSEI UNIVERSITY on November 13, 2013
http://www.jbc.org/
element, known as peroxisome proliferator response element (PPRE), in the target gene promoter.
Studies from PPAR␣-null mice showed that PPAR␣ regu-lates genes involved in lipid metabolism in the liver, including fatty acid uptake (21),-oxidation occurring in the mitochon-dria or peroxisome (22), and genes involved in glycerol (23) and lipoprotein metabolism (24, 25). PPAR␣ is responsible for lowering circulating triglyceride levels by increasing fatty acid oxidation and reducing adiposity, which improves insulin sen-sitivity (26 –28). Furthermore, PPAR␣-null mice show severe hypoglycemia following 24-h fasting, characterized by a 50% drop in blood glucose level, suggesting a potential role of PPAR␣ in glucose homeostasis and metabolism (29). Al-though the synergistic effect of PPAR␣ with glucocorticoid receptor on PEPCK promoter has been studied in liver (30), and several mechanisms accounting for reduced glucose pro-duction in PPAR␣-null mice were proposed (23), little is known about direct role of PPAR␣ on the regulation of the gene expression of G6Pase.
In this study, we have identified and characterized PPRE in the promoter region of G6Pase gene using luciferase reporter assay and chromatin immunoprecipitation (ChIP) assay. Ad-ditionally, we showed that G6Pase gene expression was down-regulated in the PPAR␣-null mice and up-regulated in livers of fasting and db/db mice. These findings indicate that G6Pase is a direct target of PPAR␣ and that PPAR␣ may be responsible for glucose production through the regulation of hepatic G6Pase gene expression during fasting as well as in T2DM.
EXPERIMENTAL PROCEDURES
Animals and Materials—Mice were housed with a 12-h light/12-h dark cycle. All animals were fed a regular chow diet until the fasting and refeeding treatment started. For the die-tary manipulation study, each group of four male C57BL/6J or PPAR␣-null mice was tested. For fasting group, mice were fasted for 24 h during a light and dark cycle. For the refeeding group, the mice fasted for 24 h were refed with a high carbo-hydrate meal for 12 h under the dark cycle. All mice were killed at the same time which is just after the finish time of the dark cycle. PPAR␣-null mice were a generous gift from Frank J. Gonzalez (31). C57BL/6J male mice for wild-type and db/db male mice were purchased from Charles River Laboratory. A standard diet and a high carbohydrate/fat-free diet were pur-chased from Harlem Teklad Co. (Madison, WI). The animal experiments were approved by Institutional Animal Care and Use Committee of the Yonsei University College of Medicine. Wy14,643 (Sigma-Aldrich) and fenofibrate (Sigma-Aldrich) were used as PPAR␣ ligands. Dexamethasone (Sigma-Aldrich) was used as the glucocorticoid receptor ligand.
Metabolite Measurement—Blood glucose drawn from mouse tail vein was analyzed using a glucose monitor, One Touch Sure Step (Lifescan). Plasma insulin levels were mea-sured by enzyme-linked immunosorbent assay (ELISA) kit (ALPCO, Salem, NH).
Cell Culture—A HepG2 human hepatoma cell line was maintained in high glucose (25 mM) Dulbecco’s modified
Ea-gle’s medium (DMEM; Hyclone, South Logan, UT)
supple-mented with 10% (v/v) fetal bovine serum (FBS; Hyclone), 100 units/ml penicillin, and 100g/ml streptomycin (Hyclone). Cells were grown at 37 °C/5% CO2humidified incubator. Pri-mary hepatocytes isolated from C57BL/6J mice liver were plated and cultured for 6 h in DMEM high glucose containing 10% (v/v) FBS, 100 units/ml penicillin, 100g/ml streptomy-cin, 10 nMdexamethasone, and 10 nMinsulin. And then, FBS,
dexamethasone, and insulin were excluded from the medium and cultured for an additional 16 h in the presence or absence of Wy14,643, fenofibrate, dexamethasone, or cAMP.
Total RNA Isolation and Quantitative Real-time PCR (qPCR)—Total RNA was isolated from the mice liver using the easy spin RNA extraction kit (iNtRON) according to the manufacturer’s instructions. Reverse transcription and qPCR analysis were performed as described in our previous study (32). Relative gene expression was determined by the standard curve methods. Ribosomal protein, large, p0 (Rplp0) was used as an internal control for RNA quality and quantity. For qPCR amplification, the following gene-specific PCR primers were used: 5⬘-TGGTAGCCCTGTCTTTCTTTG-3⬘ (sense) and 5⬘-TTCCAGCATTCACACTTTCCT-3⬘ (antisense) for G6Pase; 5
⬘-ACACACACACATGCTCACAC-3⬘ (sense) and 5⬘-ATCACCGCATAGTCTCTGAA-3⬘ (anti-sense) for PEPCK; 5⬘-TGCCAAGGAGTCGAGGATGT-3⬘ (sense) and 5⬘-TCGGCACCAGGAACCAA-3⬘ (antisense) for PPAR␣; 5⬘-CTGTTAGCAGGATGGCAGCTT-3⬘ (sense) and 5⬘-TTTCCTGGAGAGATGCTGTGG-3⬘ (antisense) for glu-cokinase (Gck); 5⬘-ATCTGGTGATTGTG GTGACAGG-3⬘ (sense) and 5⬘-GGGGTGTGGGTTGAAAGAAA-3⬘ (antisense) for liver-type pyruvate kinase (L-PK); 5 ⬘-ACAAACGATGAC-CCTCCTCA-3⬘ (sense) and 5⬘-TCTGGGGTCAGAGGAA-GAG-3⬘ (antisense) for PGC-1␣; 5⬘-GCAGGTGTTTGAC-AACGGCAG-3⬘ (sense) and 5⬘-GATGATGGAGTGTGG-CACCGA-3⬘ (antisense) for Rplp0.
Western Blot Analysis—Proteins isolated from the mice liver using the radioimmuneprecipitation assay buffer (50 mM
Tris-Cl (pH 7.5), 150 mMNaCl, 1% Nonidet P-40, 0.1% SDS, 1% deoxycholic acid, 0.5 mMDTT, 1 mM
phenylmethylsulfo-nyl fluoride, 1g/ml aprotinin, 1 g/ml leupeptin) were sepa-rated by SDS-PAGE and transferred onto nitrocellulose trans-fer membrane (Whatman). The membrane was blocked with nonfat skim milk and agitated with PPAR␣, G6Pase, and GAPDH antibodies that were purchased from Millipore (mAb 3890), Santa Cruz Biotechnology (sc-27198), and Cell Signal-ing (2118), respectively. The signals were detected with LAS-3000 (Fuji).
Transient Transfection and Luciferase Assays —Promoter-luciferase reporter constructs were constructed by amplifying the promoter region of pmG6Pase (⫺1188/⫹66) from mouse genomic DNA by PCR and inserting them into the pGL4.14 vector (pGL4.14; Promega). Serial deletion constructs from G6Pase promoter construct were prepared by amplifying the indicated regions and subcloned in the pGL4.14 vector. The PPRE point mutation was introduced into the putative PPAR␣ binding site in pmG6Pase (⫺1188/⫹66) construct by displacing PPRE with EcoRV restriction sites to generate mu-tant PPRE. To exclude the length effects of individual pro-moters, luciferase activities of each promoter reporter which
PPAR
␣ Up-regulates G6Pase Gene Expression
at YONSEI UNIVERSITY on November 13, 2013
http://www.jbc.org/
were co-transfected with pcDNA3 in the absence of ligand were artificially defined as 1. HepG2 cells were plated in 12-well tissue culture dishes at a density of 2⫻ 105cells/well in 1
ml of medium. Transient transfections were performed as described previously (32). HepG2 cells were transiently co-transfected with firefly luciferase fusion genes containing each serially deleted mouse G6Pase promoter sequence from ⫺1188 to ⫹66 and expression vectors encoding Renilla lucif-erase and either empty pcDNA3 vector or the same vector encoding the murine form of Ppar␣. After 24 h, media were changed to medium with or without 20MWy14,643. After
ligand treatment, cells were incubated for 24 h and then har-vested for luciferase activity measurements. The following primers were used for making PPRE mutation: sense, 5 ⬘-GTCGATATCTTTGGGCTGGATTGACCTACAG-3⬘; antisense, 5 ⬘-TGAGATATCGACTCAAAAAACCACTTT-TGTC-3⬘. Human PEPCK (⫺599/⫹61) and Gck (⫺1000/ ⫹158) promoters were amplified from human genomic DNA, respectively.
ChIP Assay—For the mouse ChIP assay, equal amounts of freshly isolated livers from mice were pooled and washed with ice-cold phosphate-buffered saline containing protease inhib-itors (1g/ml leupeptin, 1.4 g/ml pepstatin, 2.0 g/ml phenylmethylsulfonyl fluoride, 1 mMEDTA, and 1 mM
EGTA). The tissue was disrupted in IKA T10 basic homoge-nizer (WAG) at a low setting. Formaldehyde was added to a final concentration of 1% (v/v), and samples were rotated for 8 min. A ChIP assay was performed on cells collected by centri-fugation at 400⫻ g with an Upstate assay kit according to the manufacturer’s instructions. The DNA was recovered from eluted DNA-protein complex and purified by using Qiagen PCR purification kit. The purified DNA was amplified by qPCR and determined by comparative⌬⌬CTmethod in using
primers appropriated for each set as follows: 5 ⬘-GCTGTTTT-TGTGTGCCTGTT-3⬘ (sense) and 5⬘-TGCTATCAGTCTG-TGCCTTG-3⬘ (antisense) for G6Pase PPRE-ChIP; 5⬘-GATC-GCTGACCTCAGAGACA-3⬘ (sense) and 5⬘-GCCACCAAT-GCACATGAGAT-3⬘ (antisense) for G6Pase outside PPRE-ChIP in mouse. The relative amount of the precipitated target sequence was determined via normalization to the 1% of puri-fied total genomic DNA input.
Statistical Analysis—Three to five experiments of all stud-ies were performed, using triplicate replications. The data are represented as mean⫾ S.E. All datasets were analyzed for statistical significance using a two-tailed unpaired Student’s t test. All p values below 0.05 were considered significant. Sta-tistical analysis was carried out using SPSS (Version 11.5; SPSS Inc., Chicago, IL).
RESULTS
Effect of Fasting on mRNA Levels of PPAR␣ and Gluconeo-genic Genes in Livers of Wild-type and PPAR␣-null Mice—
PPAR␣-null mice are characterized by defects in fatty acid oxidation and hypoglycemia during fasting (29, 31, 33). To explore a molecular mechanism governing the PPAR␣ and gluconeogenic gene expression, mRNA levels of PPAR␣, G6Pase, and PEPCK were measured in the mice subjected to fasting and/or refeeding. During the fasting period, PPAR␣
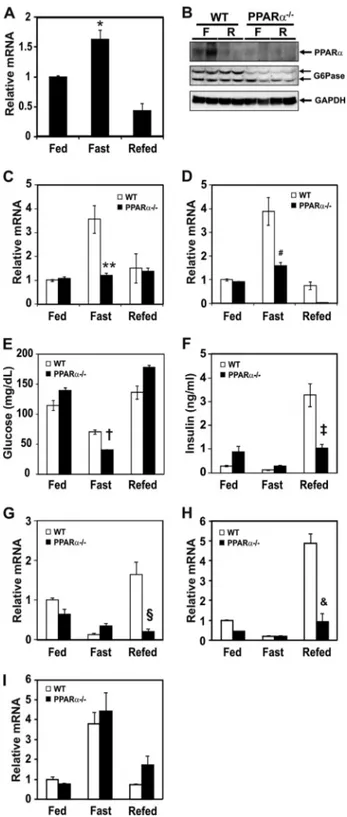
mRNA levels were increased in the liver of wild-type mice and decreased by refeeding (Fig. 1A). PPAR␣ protein was also in-creased by fasting and dein-creased by refeeding (Fig. 1B). PPAR␣ protein was not increased in the liver of PPAR␣-null mice regardless of dietary condition. mRNA levels of G6Pase (Fig. 1C) and PEPCK (Fig. 1D) were elevated during fasting and returned to control levels in the livers of refed wild-type mice. However, mRNA levels of G6Pase and PEPCK were not increased by fasting in the PPAR␣-null mice, suggesting that PPAR␣ could be involved in the up-regulation of G6Pase and PEPCK gene expression. Because PPAR␣ is shown to mediate adaptive response to fasting (29), the serum blood glucose level may be lower in PPAR␣-null mice during fasting due to decreased gluconeogenesis in liver. Indeed, the serum glu-cose level was decreased in fasted PPAR␣-null mice com-pared with wild-type control mice (Fig. 1E). Interestingly, the serum insulin level was not increased in PPAR␣-null mice by refeeding (Fig. 1F), and this result is consistent with the report that PPAR␣ plays a role in the insulin se-cretion in pancreas (34). Analysis of diet-sensitive gene expression levels showed that Gck and L-PK were not af-fected in the livers of fasting wild-type and PPAR␣-null mice (Fig. 1, G and H). However, Gck and L-PK expression was not induced by refeeding due to decreased insulin se-cretion probably in PPAR␣-null mice (Fig. 1, G and H). This phenomenon might be closely associated with de-creased plasma insulin level in the refed PPAR␣-null mice. PGC-1␣, which acts as a co-activator of several transcrip-tion factors, is induced in fasting liver as well (35). To test whether a deficiency of PPAR␣ could affect expression of the PGC-1␣ gene, we measured PGC-1␣ mRNA levels in each dietary condition. The mRNA level of PGC-1␣ in PPAR␣-null mice was similar to that of wild-type mice (Fig. 1I).
PPAR␣ Ligands Increase G6Pase mRNA Levels in Primary Cultured Hepatocytes—To observe the effects of PPAR␣ ago-nists on the gluconeogenic gene expression, primary cultured hepatocytes isolated from C57BL/6J mice were treated with Wy14,643 or fenofibrate. G6Pase mRNA levels were increased by Wy14,643 and fenofibrate treatment in a dose-dependent manner (Fig. 2, A and C). However, both PPAR␣ agonists slightly increased the PEPCK mRNA level (Fig. 2, B and D), and mRNA levels of PPAR␣ and PGC-1␣ were not affected by Wy14,643 and fenofibrate treatment (supplemental Fig. 1, A–D).
Because glucocorticoid is known to up-regulate gluconeo-genic genes (36, 37), we evaluated the effects of dexametha-sone, cAMP, and/or Wy14.643 on G6Pase gene expression in the primary cultured hepatocytes (Fig. 2, E and F). Dexameth-asone and Wy14,643 synergistically increased G6Pase and PEPCK expression. Time course experiments showed that the Wy14,643 effect on G6Pase gene expression was maximum at the 24-h incubation time (Fig. 2E).
Effect of PPAR␣ on the G6Pase Promoter Reporter Activities in HepG2 Cells—A computer search for putative PPRE in the G6Pase gene suggested that the cis-element could be located in the⫺76 bp/⫺64 bp region and the sequence is evolution-ally conserved in human, mouse, and rat (Fig. 3A). To localize
at YONSEI UNIVERSITY on November 13, 2013
http://www.jbc.org/
the putative PPRE in the G6Pase gene, serial deletion con-structs were prepared, and their responsiveness to PPAR␣ was tested. As shown in Fig. 3B, PPAR␣ increased G6Pase promoter activity (pmG6Pase pro,⫺1188/⫹66) by 4.5-fold. The promoter activity was significantly decreased when the promoter was deleted down to⫺52 bp, suggesting that a putative PPRE could be present between⫺88 bp and ⫺52 bp. To identify the PPRE site on the promoter, a PPRE mu-tation was introduced in the G6Pase promoter (⫺1188/⫹66) using site-directed mutagenesis. The promoter activity of mG6Pase-PPREmut by PPAR␣ was significantly decreased (Fig. 3C), suggesting a direct participation of PPAR␣ in the up-regulation of the G6Pase gene. In addition, PPAR␣ also induced PEPCK promoter activity. However, Gck promoter activity was not affected by PPAR␣ (supplemental Fig. 2A).
Binding of PPAR␣ to Putative G6Pase-PPRE in the Liver of Fasting/Refeeding Mice—To confirm that PPAR␣ binds di-rectly to the mouse G6Pase gene promoter region in vivo, a ChIP assay was performed. Fragmented chromatin was im-munoprecipitated by anti-PPAR␣ antibodies followed by qPCR amplifications, containing G6Pase-PPRE (Fig. 3D). The region outside the PPRE target region was chosen as a neg-ative control (Fig. 3G). As shown in Fig. 3E, the binding of PPAR␣ to the putative PPRE of the G6Pase promoter was increased in liver of the fasting group, consistent with data shown in Fig. 1C. In contrast, PPAR␣ protein was not re-cruited in the fasted PPAR␣-null mice. These results indi-cate that PPAR␣ binding to the putative PPRE of the G6Pase promoter is active under fasting condition. FoxO1 binding to G6Pase promoter, which is used as a positive control of transcription factor binding, was increased dur-ing the fastdur-ing state of both wild-type and PPAR␣-null mice (Fig. 3F).
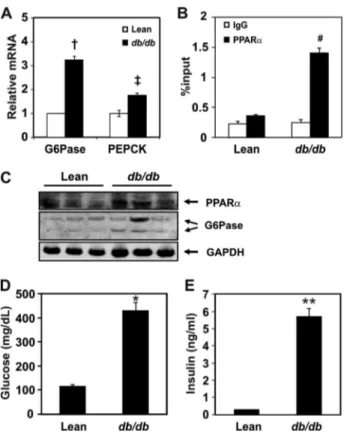
Binding of PPAR␣ to the Putative G6Pase-PPRE Site Is In-creased in db/db Mice—Gluconeogenesis occurs actively in the livers of patients with T2DM and in T2DM animal models (38). Moreover, PPAR␣ expression is known to be increased in the liver of diabetic animals (39). Because our data sug-gested that G6Pase might be a target of PPAR␣, we measured the mRNA levels of G6Pase and PEPCK in db/db mice. As shown in Fig. 4A, mRNA levels of G6Pase and PEPCK were significantly increased by 3.2-fold and 1.8-fold, respectively, in
db/db mice compared with the control mice. To confirm that PPAR␣ binding to the putative PPRE in the G6Pase promoter was increased in the diabetic db/db animal model, we performed a ChIP assay using an anti-PPAR␣ antibody. PPAR␣ binding to the putative PPRE is increased compared with control mice (Fig. 4B). To check PPAR␣ and G6Pase protein levels in the diabetic mice model, an immunoblotting assay was performed using anti-PPAR␣
FIGURE 1. Effect of fasting and refeeding on PPAR␣ and gluconeogenic
mRNA levels in liver of wild-type and PPAR␣-null mice. A, mRNA level of
PPAR␣ from wild-type mice was measured by qPCR in the fed, fasted (for 24 h), and refed groups (fasted for 24 h followed by refeeding a high carbo-hydrate/low fat diet for 12 h in the dark cycle). qPCR data were normalized to Rplp0 mRNA level. Each value represents the amounts of mRNA relative to that of the feeding group, which is arbitrarily defined as 1. B, PPAR␣ and G6Pase protein levels of fasted and refed groups as above are shown. C and D, mRNA levels of G6Pase (C) and PEPCK (D) in liver from wild-type (open bars) and PPAR␣-null (filled bars) mice were measured by qPCR in the fed, fasted, and refed groups as above. Each value represents the amounts of mRNA relative to that of the feeding group of wild-type mice, which is arbi-trarily defined as 1. E and F, plasma glucose (E) and insulin (F) levels of fed, fasted, and refed group of wild-type and PPAR␣-null mice are shown. G–I, mRNA levels of Gck (G), L-PK (H), and PGC-1␣ (I) in liver from wild-type
(open bars) and PPAR␣-null (filled bars) mice were measured as above. Bars represent means⫾ S.E. (error bars) for four animals per group. *, p ⬍ 0.004, fasting versus refed; **, p⬍ 0.002, wild-type versus PPAR␣-null mice in the fasting state; #, p⬍ 0.002, wild-type versus PPAR␣-null mice in the fasting state; †, p⬍ 0.02, wild-type versus PPAR␣-null mice in the fasting state; ‡, p⬍ 0.004, wild-type versus PPAR␣-null mice in the refed state; §, p ⬍ 0.003, wild-type versus PPAR␣-null mice in the refed state; &, p ⬍ 0.002, wild-type versus PPAR␣-null mice in the refed state.
PPAR
␣ Up-regulates G6Pase Gene Expression
at YONSEI UNIVERSITY on November 13, 2013
http://www.jbc.org/
and anti-G6Pase antibodies. PPAR␣ as well as G6Pase pro-tein levels were increased in liver of db/db mice (Fig. 4C). Glucose and insulin levels of db/db mice showed hypergly-cemia and hyperinsulinemia (Fig. 4, D and E). These results indicated that PPAR␣-mediated activation of G6Pase
ex-pression may contribute to the increased hepatic glucose production in db/db mice.
DISCUSSION
Gluconeogenesis occurs in the liver of animals when they are subjected to long term fasting (40) or in a diabetic state (41). Because PPAR␣ plays an important role as a lipid sensor and regulator of cellular energy metabolism, fatty acid-medi-ated PPAR␣ activation is critical in fatty acid and lipid metab-olism (42, 43). Although human inborn errors of the mito-chondrial fatty acid oxidation are asymptomatic in a normal feeding condition, these patients show hypoketotic hypogly-cemia, liver dysfunction, cardiomyopathy, intracellular accu-mulation of neutral lipid in liver and heart, and sudden death in a short term fasting condition (44). The molecular mecha-nism of the symptoms is not well understood, however, possi-ble causes include: 1) an inadequate energy supply in the heart, which uses mitochondrial-oxidation of fatty acids as the main source of energy, and 2) toxic effects of elevated in-tracellular concentrations of the intermediary metabolites of fatty acids (45). These characteristics are partially similar to PPAR␣-deficient mice subjected to dietary fasting (29, 31, 33). PPAR␣-null mice demonstrate increased levels of plasma free fatty acid due to defects in fatty acid oxidation in the fasting state. Additionally, the plasma glucose levels of PPAR␣-null mice are lower than those of wild-type mice under fasting conditions (Fig. 1E) (29), suggesting a potential link between PPAR␣ and gluconeogenesis. Although increased free fatty acids could be responsible for enhanced gluconeogenesis and hepatic glucose production (3, 46), a direct mechanism of how PPAR␣ increases glucose production is not well addressed.
In PPAR␣-null mice, hepatic glucose metabolism is di-rected toward synthesis of glycogen (47). Indeed, PPAR␣ up-regulates glycerol-3-phosphate dehydrogenase and glycerol kinase gene expression, which are important enzymes that convert glycerol to glyceraldehyde 3-phosphate for inducing gluconeogenic flux (47). In addition, glycogen and UDP-glu-cose levels were increased in the liver of fasted PPAR␣-null mice (47) despite gluconeogenic flux and concentration of glucose 6-phosphate unchanged compared with wild-type mice.
Thus, we hypothesized that there is a direct correlation between PPAR␣ and G6Pase gene expression. To this end, we cloned the promoter region of G6Pase, which is one of the critical enzymes responsible for gluconeogenesis, and showed that PPAR␣ binds directly to a putative PPRE in the promoter of G6Pase and increases the transcription of G6Pase gene. In addition, the PPAR␣ protein level was increased by fasting state of both wild-type and db/db mice.
Moreover, our data showed that G6Pase and PEPCK mRNA levels were significantly decreased in fasted PPAR ␣-null mice. In contrast, G6Pase mRNA levels were not altered by a fasting/refeeding regimen in PPAR␣-null mice, indicat-ing that G6Pase could be a direct target gene of PPAR␣. We also demonstrated that serum glucose levels in fasted PPAR ␣-null mice were reduced compared with wild-type mice. This mechanism might explain the increase in hepatic gluconeo-genesis during fasting in wild-type or a diabetic mice. Inter-FIGURE 2. Effect of PPAR␣ ligands on the mRNA level of gluconeogenic
genes in the primary cultured hepatocytes. A–D, hepatocytes isolated
from mice were treated with 1, 2, 10, or 20MWy14,643 (A and B) or fenofi-brate (C and D), respectively, for 24 h. G6Pase (A and C) and PEPCK (B and D) mRNA levels were measured by qPCR. E and F, effects of dexamethasone, cAMP, and Wy14,643 on the mRNA levels of G6Pase (E) and PEPCK (F) are shown. Primary cultured hepatocytes were treated with 100 nM dexametha-sone, 1McAMP, and/or 20MWy14,643 for 24 h as indicated. mRNA levels were measured by qPCR. All mRNA levels were normalized to Rplp0 mRNA levels. G, time course measurement of G6Pase mRNA level by qPCR in pri-mary cultured hepatocytes is shown. Cells were treated with 20MWy14,643 as indicated. **, p⬍ 0.02, Wy14,643 versus Wy14,643 and dexamethasone treatment.
at YONSEI UNIVERSITY on November 13, 2013
http://www.jbc.org/
estingly, in the refed animals, the plasma insulin level was not increased in PPAR␣-null mice. Previous studies showed that PPAR␣ plays a role in glucose-stimulated insulin secretion in pancreatic-cells (48). Therefore, insulin levels in serum should be decreased in PPAR␣-null mice during refeeding (Fig. 1F), and insulin target genes like Gck and L-PK in the liver should be also down-regulated (Fig. 1, G and H), causing an increased glucose level in the refed state of PPAR␣-null mice. Based on previous studies and our data, we suggest a model that PPAR␣ enhances glucose output through glu-coneogenic gene regulation in fasting or diabetes state (Fig. 5).
Increased free fatty acids have been implicated in hepatic gluconeogenesis in fasting and in T2DM animal models (3, 49). Several putative mechanisms have been proposed to ex-plain the link between free fatty acids and hepatic glucose production (3). Among these mechanisms, free fatty acids FIGURE 3. Identification of PPRE in the 5ⴕ-flanking region of the G6Pase
gene. A, comparison of PPRE sequence among mouse, rat, and human
G6Pase 5⬘-flanking regions and a mutated PPRE mouse promoter sequence used for luciferase reporter assays. The numbers indicate the distance in nucleotides from the transcription start site (⫹1) of mouse, rat, and human G6Pase genes. B, effects of PPAR␣ on the promoter reporter activities of serial deletion constructs of the G6Pase gene. Each serial deletion construct of the mouse G6Pase promoter was transiently co-transfected with pcDNA3 (open bars) or PPAR␣ expression vector (filled bars) in HepG2 cells. After 24 h, media were changed with 20MWy14,643. Luciferase activities were normalized to Renilla activity. C, effect of PPRE mutation on the G6Pase ⫺1188/⫹66 promoter reporter construct. HepG2 cells were transiently co-transfected with pGL4, G6Pase promoter reporter (⫺1188/⫹66), or G6Pase PPRE mutant promoter reporter (Mut), respectively, with pcDNA3 (open bars) or PPAR␣ expression vector (filled bars) as above. D, schematics of the PCR amplification region containing PPRE in the G6Pase promoter. The re-gion between⫺190 and ⫹4 was amplified. E–G, ChIP assay for PPAR␣ bind-ing to PPRE of the G6Pase gene. For the ChIP assay, chromatin was ex-tracted from the livers of mice fasted for 24 h or refed for 12 h after 24-h fasting (n⫽ 3 per group). The chromatin was immunoprecipitated with antibody against PPAR␣ (E and G) and FoxO1 (F). The quantity of DNA in the precipitation was normalized to chromatin input (1/100 of chromosomal DNA used for precipitation). The amplified region from the G6Pase gene
promoter was⫺190/⫹3 (E and F) and ⫺902/⫺750 (G). FoxO1 binding to PPRE of the G6Pase promoter was used shown as a positive control (F), and the nonspecific region between⫺902 bp and ⫺750 bp, which is outside the PPRE in the G6Pase promoter, was used as a negative control (G). Re-sults represent the mean⫾ S.E. (error bars) for three experiments with each sample assayed in triplicate.*, p⬍ 0.004, ⫺88 bp versus ⫺52 bp; **, p ⬍ 0.003, mock versus PPAR␣; #, p ⬍ 0.02, IgG versus PPAR␣; §, p ⬍ 0.02 IgG versus FoxO1.
FIGURE 4. Binding of PPAR␣ to the putative PPRE in the G6Pase gene in
the liver of db/db mice. A, mRNA levels of G6Pase and PEPCK in lean and
db/db mice. All mRNA levels were measured by qPCR and were normalized to that of Rplp0. B, ChIP assay for PPAR␣ binding to PPRE of the G6Pase gene in db/db mice. The region between⫺190/⫹4 was amplified. Chromatins ex-tracted from the livers of lean or db/db mice were precipitated by PPAR␣ anti-bodies. The DNA fragments were amplified by qPCR using primers containing PPRE in the G6Pase promoter. Details are described under “Experimental Proce-dures.” C, protein levels of PPAR␣ and G6Pase in lean and db/db mice. D and E, plasma glucose (D) and insulin (E) levels of lean versus db/db mice. †, p⬍ 0.004, lean versus db/db mice; ‡, p⬍ 0.003, lean versus db/db mice; #, p ⬍ 0.021, IgG versus PPAR␣ precipitation; *, p ⬍ 0.021; **, p ⬍ 0.001.
PPAR
␣ Up-regulates G6Pase Gene Expression
at YONSEI UNIVERSITY on November 13, 2013
http://www.jbc.org/
up-regulate expression of genes involved in gluconeogenesis through activating transcription factors such as PPAR␣ (50) and HNF-4␣ (3, 51). Consensus sequence analysis indicated the presence of seven putative HNF-4␣ binding sites in the G6Pase gene promoter (⫺751/⫺466 bp), and these sites were shown to be responsible for free fatty acid-mediated activa-tion of the G6Pase gene (52). Thus, there are possibilities that PPAR␣ could be involved in the free fatty acid-induced acti-vation of G6Pase gene expression through these regions. In addition, it was reported that HNF-4␣ activated the G6Pase gene expression by binding to the⫺76 bp/⫺64 bp region of the promoter (53) in H4IIE cells, but we were not able to ob-serve an increase in the G6Pase promoter activity by HNF-4␣ or co-transfection with PPAR␣ in HepG2 cells (supplemental Fig. 2B). A possible explanation for the discrepancies between HNF-4␣ and PPAR␣ activation of G6Pase could be the differ-ence in the cell line characteristics. Because PPAR␣ is ex-pressed at a low level in the H4IIE cell line, the PPAR␣ effect on G6Pase gene expression would not be observed (53). In this study, we demonstrated the binding of PPAR␣ to the G6Pase promoter region using an in vivo ChIP assay (Figs. 3 and 4).
The PPRE of the PEPCK gene has an intermediate affinity (54). Because the PPRE in the PEPCK promoter overlaps with a potential HNF-4 binding region of⫺433/⫺457 bp (55), it is assumed that HNF-4␣ may compete with PPAR␣ in binding to the putative PPRE. Indeed, in the primary cultured hepato-cytes, the PPAR␣ ligand did not increase the PEPCK mRNA level (Fig. 2B), probably due to competition between other transcription factors such as HNF-4␣ and RXR␣/RAR␣ (56). However Wy14,643 activated the PEPCK promoter reporter activity (supplemental Fig. 2A). In addition, PEPCK mRNA gene expression is shown to be increased by Wy14,643 and glucocorticoid in a synergistic manner (30), suggesting that the precise control of gene expression of G6Pase and PEPCK may be different.
Although mRNA levels of PPAR␣ in the Wy-14,643- or fenofibrate-treated primary cultured hepatocyte were not changed (supplemental Fig. 1, A and C), G6Pase gene expres-sion was increased in a dose-dependent and time-dependent manner (Fig. 2, A and G). In addition, the mRNA level of PPAR␣ in the livers of fasted wild-type mice showed a mar-ginal change, although the protein levels of PPAR␣ and G6Pase were increased (Fig. 1B). These results suggest that increased endogenous PPAR␣ ligands might be responsible for the increase in the stability of PPAR␣ by reducing ubiq-uitination-mediated proteasomal degradation of PPAR␣ (57).
Glucocorticoid and glucagon have been shown to activate gluconeogenic gene expression either by the glucocorticoid receptor, PGC-1␣, or cAMP-responsive element-binding pro-tein in the fasting liver (58). To understand the correlation between the PPAR␣ agonist and dexamethasone or cAMP in primary cultured hepatocytes, we compared the effects of these agents on G6Pase and PEPCK mRNA levels. The degree of G6Pase mRNA induction was similar among these agents. In contrast, the dexamethasone-treated group showed the highest PEPCK mRNA level. Additionally, dexamethasone showed synergistic effects with Wy14,643 in both G6Pase and PEPCK gene transcription (Fig. 2, E and F). These data are consistent with PPAR␣ and glucocorticoid effects on the G6Pase promoter (supplemental Fig. 2C). Dexamethasone is shown to up-regulate PPAR␣ gene expression (59), and its effect was increased in time-dependent manner up to 24-h incubation time (supplemental Fig. 1A).
The current study provides evidence that up-regulation of the G6Pase gene can be mediated by direct action of PPAR␣ and adds to our understanding of the transcriptional control of G6Pase gene expression. Despite an improvement in the lipid parameters and resulting amelioration in the overall metabolic profile by PPAR␣ agonist treatment (27), it should be taken into account that PPAR␣ agonists potentially acti-vate gluconeogenic genes, specifically G6Pase. Studying the diverse effects of PPAR␣ will provide insight for development of selective PPAR␣ modulators that reduce hepatic gluconeo-genesis while maintaining lipid-reducing effects. Understand-ing the diversity of PPAR␣ may also establish a role for PPAR␣ in the liver of diabetic animals. This study provides a novel avenue for therapeutic intervention in high fat diet-induced diabetes.
Acknowledgment—We thank Dr. Frank J. Gonzalez for providing PPAR␣-null mice.
REFERENCES
1. Boden, G., Chen, X., and Stein, T. P. (2001) Am. J. Physiol. Endocrinol.
Metab. 280,E23–E30
2. Bergman, R. N., and Ader, M. (2000) Trends Endocrinol. Metab. 11, 351–356
3. Lam, T. K., Carpentier, A., Lewis, G. F., van de Werve, G., Fantus, I. G., and Giacca, A. (2003) Am. J. Physiol. Endocrinol. Metab. 284, E863–E873
4. Goodridge, A. G. (1987) Annu. Rev. Nutr. 7, 157–185
5. Massillon, D., Barzilai, N., Hawkins, M., Prus-Wertheimer, D., and Ros-setti, L. (1997) Diabetes 46, 153–157
6. Chu, R., Lim, H., Brumfield, L., Liu, H., Herring, C., Ulintz, P., Reddy, FIGURE 5. Regulation of gluconeogenic gene expression. A proposed
model of the role of PPAR␣ in the regulation of G6Pase/PEPCK gene expres-sion in the fasting state or T2DM (db/db) mice is shown. PPAR␣ could be activated either by free fatty acids (FFA) or glucocorticoid, causing up-regu-lation of gluconeogenic genes.
at YONSEI UNIVERSITY on November 13, 2013
http://www.jbc.org/
J. K., and Davison, M. (2004) Mol. Cell. Biol. 24, 6288 – 6297 7. Mithieux, G. (1997) Eur. J. Endocrinol. 136, 137–145
8. Argaud, D., Kirby, T. L., Newgard, C. B., and Lange, A. J. (1997) J. Biol. Chem. 272,12854 –12861
9. Xu, C., Chakravarty, K., Kong, X., Tuy, T. T., Arinze, I. J., Bone, F., and Massillon, D. (2007) J. Nutr. 137, 554 –559
10. Lange, A. J., Argaud, D., el-Maghrabi, M. R., Pan, W., Maitra, S. R., and Pilkis, S. J. (1994) Biochem. Biophys. Res. Commun. 201, 302–309 11. Grempler, R., Kienitz, A., Werner, T., Meyer, M., Barthel, A., Ailett, F.,
Sutherland, C., Walther, R., and Schmoll, D. (2004) Biochem. J. 382, 471– 479
12. Metzger, S., Goldschmidt, N., Barash, V., Peretz, T., Drize, O., Shilyan-sky, J., Shiloni, E., and Chajek-Shaul, T. (1997) Am. J. Physiol. Endocrinol. Metab. 273,E262–E267
13. Argaud, D., Zhang, Q., Pan, W., Maitra, S., Pilkis, S. J., and Lange, A. J. (1996) Diabetes 45, 1563–1571
14. Haber, B. A., Chin, S., Chuang, E., Buikhuisen, W., Naji, A., and Taub, R. (1995) J. Clin. Invest. 95, 832– 841
15. Massillon, D., Barzilai, N., Chen, W., Hu, M., and Rossetti, L. (1996) J. Biol. Chem. 271,9871–9874
16. Trinh, K. Y., O’Doherty, R. M., Anderson, P., Lange, A. J., and Newgard, C. B. (1998) J. Biol. Chem. 273, 31615–31620
17. Evans, R. M., Barish, G. D., and Wang, Y. X. (2004) Nat. Med. 10, 355–361
18. Kersten, S., Desvergne, B., and Wahli, W. (2000) Nature 405, 421– 424 19. Rosen, E. D., Hsu, C. H., Wang, X., Sakai, S., Freeman, M. W., Gonzalez,
F. J., and Spiegelman, B. M. (2002) Genes Dev. 16, 22–26
20. Michalik, L., Auwerx, J., Berger, J. P., Chatterjee, V. K., Glass, C. K., Gonzalez, F. J., Grimaldi, P. A., Kadowaki, T., Lazar, M. A., O’Rahilly, S., Palmer, C. N., Plutzky, J., Reddy, J. K., Spiegelman, B. M., Staels, B., and Wahli, W. (2006) Pharmacol. Rev. 58, 726 –741
21. Hsu, M. H., Savas, U., Griffin, K. J., and Johnson, E. F. (2001) J. Biol. Chem. 276,27950 –27958
22. Schoonjans, K., Staels, B., and Auwerx, J. (1996) J. Lipid Res. 37, 907–925 23. Patsouris, D., Mandard, S., Voshol, P. J., Escher, P., Tan, N. S., Havekes,
L. M., Koenig, W., Ma¨rz, W., Tafuri, S., Wahli, W., Mu¨ller, M., and Ker-sten, S. (2004) J. Clin. Invest. 114, 94 –103
24. Aoyama, T., Peters, J. M., Iritani, N., Nakajima, T., Furihata, K., Hashi-moto, T., and Gonzalez, F. J. (1998) J. Biol. Chem. 273, 5678 –5684 25. Motojima, K., Passilly, P., Peters, J. M., Gonzalez, F. J., and Latruffe, N.
(1998) J. Biol. Chem. 273, 16710 –16714
26. Guerre-Millo, M., Gervois, P., Raspe´, E., Madsen, L., Poulain, P., Deru-das, B., Herbert, J. M., Winegar, D. A., Willson, T. M., Fruchart, J. C., Berge, R. K., and Staels, B. (2000) J. Biol. Chem. 275, 16638 –16642 27. Kim, H., Haluzik, M., Asghar, Z., Yau, D., Joseph, J. W., Fernandez, A. M., Reitman, M. L., Yakar, S., Stannard, B., Heron-Milhavet, L., Wheeler, M. B., and LeRoith, D. (2003) Diabetes 52, 1770 –1778 28. Chou, C. J., Haluzik, M., Gregory, C., Dietz, K. R., Vinson, C., Gavrilova,
O., and Reitman, M. L. (2002) J. Biol. Chem. 277, 24484 –24489 29. Kersten, S., Seydoux, J., Peters, J. M., Gonzalez, F. J., Desvergne, B., and
Wahli, W. (1999) J. Clin. Invest. 103, 1489 –1498
30. Cassuto, H., Kochan, K., Chakravarty, K., Cohen, H., Blum, B., Olswang, Y., Hakimi, P., Xu, C., Massillon, D., Hanson, R. W., and Reshef, L. (2005) J. Biol. Chem. 280, 33873–33884
31. Lee, S. S., Pineau, T., Drago, J., Lee, E. J., Owens, J. W., Kroetz, D. L., Fer-nandez-Salguero, P. M., Westphal, H., and Gonzalez, F. J. (1995) Mol.
Cell. Biol. 15,3012–3022
32. Kim, T. H., Kim, H., Park, J. M., Im, S. S., Bae, J. S., Kim, M. Y., Yoon, H. G., Cha, J. Y., Kim, K. S., and Ahn, Y. H. (2009) J. Biol. Chem. 284, 15071–15083
33. Leone, T. C., Weinheimer, C. J., and Kelly, D. P. (1999) Proc. Natl. Acad. Sci. U.S.A. 96,7473–7478
34. Bihan, H., Rouault, C., Reach, G., Poitout, V., Staels, B., and Guerre-Millo, M. (2005) FEBS Lett. 579, 2284 –2288
35. Yoon, J. C., Puigserver, P., Chen, G., Donovan, J., Wu, Z., Rhee, J., Adel-mant, G., Stafford, J., Kahn, C. R., Granner, D. K., Newgard, C. B., and Spiegelman, B. M. (2001) Nature 413, 131–138
36. Barthel, A., and Schmoll, D. (2003) Am. J. Physiol. Endocrinol. Metab.
285,E685–E692
37. Bernal-Mizrachi, C., Weng, S., Feng, C., Finck, B. N., Knutsen, R. H., Leone, T. C., Coleman, T., Mecham, R. P., Kelly, D. P., and Semenkov-ich, C. F. (2003) Nat. Med. 9, 1069 –1075
38. Memon, R. A., Tecott, L. H., Nonogaki, K., Beigneux, A., Moser, A. H., Grunfeld, C., and Feingold, K. R. (2000) Endocrinology 141, 4021– 4031 39. Asayama, K., Sandhir, R., Sheikh, F. G., Hayashibe, H., Nakane, T., and
Singh, I. (1999) Mol. Cell. Biochem. 194, 227–234 40. Cherrington, A. D. (1999) Diabetes 48, 1198 –1214 41. Shulman, G. I. (2000) J. Clin. Invest. 106, 171–176
42. Berger, J., and Moller, D. E. (2002) Annu. Rev. Med. 53, 409 – 435 43. Lefebvre, P., Chinetti, G., Fruchart, J. C., and Staels, B. (2006) J. Clin.
Invest. 116,571–580
44. Roe, C. R., and Coates, P. M. (1995) in The Metabolic and Molecular Bases of Inherited Disease(C. R., Scriver, A. I., Beaudet, W. S., Sly, and D. Valle), pp. 1501–1533, McGraw-Hill, New York
45. Kelly, D. P., and Strauss, A. W. (1994) N. Engl. J. Med. 330, 913–919 46. Chen, X., Iqbal, N., and Boden, G. (1999) J. Clin. Invest. 103, 365–372 47. Bandsma, R. H., Van Dijk, T. H., Harmsel At, A., Kok, T., Reijngoud,
D. J., Staels, B., and Kuipers, F. (2004) J. Biol. Chem. 279, 8930 – 8937 48. Sugden, M. C., and Holness, M. J. (2004) Diabetes 53, S71–S81 49. Oakes, N. D., Cooney, G. J., Camilleri, S., Chisholm, D. J., and Kraegen,
E. W. (1997) Diabetes 46, 1768 –1774
50. Suh, H. N., Huong, H. T., Song, C. H., Lee, J. H., and Han, H. J. (2008) Am. J. Physiol., Cell Physiol. 295,C1518 –C1527
51. Rhee, J., Inoue, Y., Yoon, J. C., Puigserver, P., Fan, M., Gonzalez, F. J., and Spiegelman, B. M. (2003) Proc. Natl. Acad. Sci. U.S.A. 100, 4012– 4017
52. Massillon, D., Arinze, I. J., Xu, C., and Bone, F. (2003) J. Biol. Chem. 278, 40694 – 40701
53. Boustead, J. N., Stadelmaier, B. T., Eeds, A. M., Wiebe, P. O., Svitek, C. A., Oeser, J. K., and O’Brien, R. M. (2003) Biochem. J. 369, 17–22 54. Juge-Aubry, C., Pernin, A., Favez, T., Burger, A. G., Wahli, W., Meier,
C. A., and Desvergne, B. (1997) J. Biol. Chem. 272, 25252–25259 55. Yanuka-Kashles, O., Cohen, H., Trus, M., Aran, A., Benvenisty, N., and
Reshef, L. (1994) Mol. Cell. Biol. 14, 7124 –7133
56. Sugiyama, T., Scott, D. K., Wang, J. C., and Granner, D. K. (1998) Mol. Endocrinol. 12,1487–1498
57. Blanquart, C., Barbier, O., Fruchart, J. C., Staels, B., and Glineur, C. (2002) J. Biol. Chem. 277, 37254 –37259
58. Puigserver, P., and Spiegelman, B. M. (2003) Endocr. Rev. 24, 78 –90 59. Lemberger, T., Staels, B., Saladin, R., Desvergne, B., Auwerx, J., and
Wahli, W. (1994) J. Biol. Chem. 269, 24527–24530