Research Article
Hierarchical Aggregation of Uncertain Sensor Data for M2M
Wireless Sensor Network Using Reinforcement Learning
Yunjeong Choi
1and Inshil Doh
21Department of Internet Information, Kyungmin University, Seoul 480-811, Republic of Korea
2Department of Computer Science and Engineering, Ewha Womans University, Seoul 120-750, Republic of Korea Correspondence should be addressed to Inshil Doh; [email protected]
Received 9 November 2013; Revised 1 April 2014; Accepted 1 April 2014; Published 29 May 2014 Academic Editor: Hongke Zhang
Copyright © 2014 Y. Choi and I. Doh. This is an open access article distributed under the Creative Commons Attribution License, which permits unrestricted use, distribution, and reproduction in any medium, provided the original work is properly cited. The communication among heterogeneous embedded devices could lead to correctness problems in M2M environment. Sometimes, it is not easy to classify the data because they may provide wrong or uncertain information. The data from these devices should be gathered in a safe, efficient, and right manner without the help of server or human intervention; even the low-level information from each device causes interoperability problems. This data gathering or data fusion process is very important because the data mapping result could be understood as totally different situation and hence cause different reaction, feedback, and controls. In this paper, we propose a hierarchical aggregation for uncertain sensor data using reinforcement learning to get correct and efficient data gathering result for reliable wireless sensor network. In our proposal, we add a new category for uncertain data and classify them through reinforcement learning using hierarchical subcategories. By adopting our proposed aggregation, false classification caused by uncertain data can be decreased and the correctness of data gathering can be enhanced.
1. Introduction
In wireless sensor network, a lot of sensor nodes are deployed in the field; they sense data and send them to the sink node. Sensor network technology has been utilized for military, environment monitoring, healthcare, agriculture, weather conditions, home automation, vehicular automation, and so on. This machine-to-machine (M2M) communication appli-cation area will be further extended in various industries. For decreasing communicational and computational overhead of dealing with the sensed data, we need aggregators or clusterheads which can gather the data from each sensor node and then aggregate them before sending the aggregated data to the server system. This process, which is called aggregation or data fusion, is the technique which combines data from multiple sources and gathers that information to make inferences. With this process, we can decrease the amount of redundant data and filter the wrong sensed results, which include false positive and false negative, and can increase the accuracy of the result through classification of the sensed data.
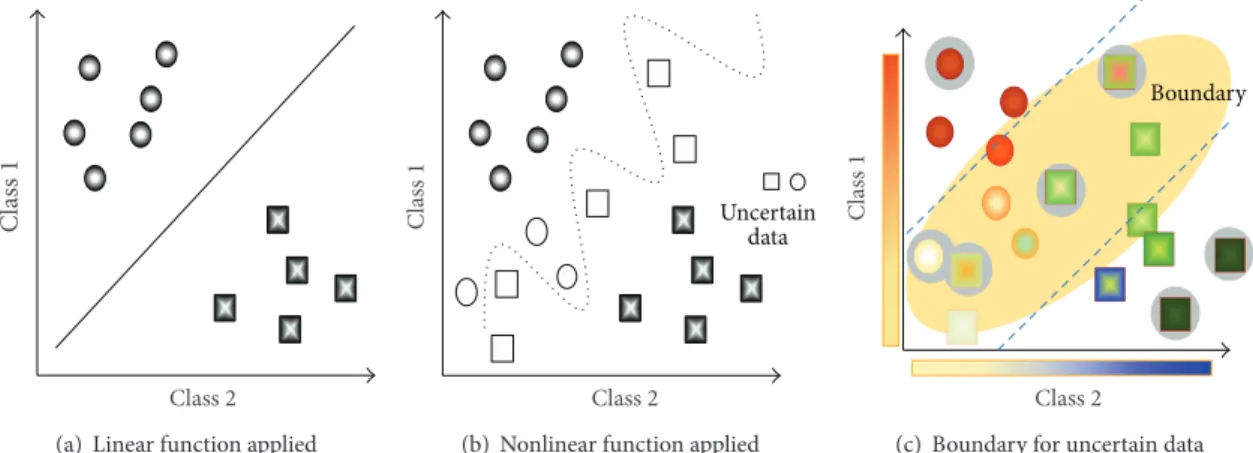
Several sensed data aggregation mechanisms have been proposed considering the efficiency and correctness of the result. However, they have disadvantages when some data are not easy to classify because they are located somewhere between the two groups and show uncertainty as inFigure 1. A linear function can be applied to data as inFigure 1(a). In some cases, we need a nonlinear function as inFigure 1(b)
or a delimitation function to detect boundaries for uncertain data as inFigure 1(c).
In this work, we propose an efficient data classification mechanism which can determine the uncertain data correctly based on risk levels of system purpose. Some sensed data stream and environment information can be easily classified in any of the groups while the others are hard to be categorized because of their subtle and slight differences. Our proposed method can assign the uncertain data to proper class through the reinforcement learning process and class hierarchy and relevance information. Automatic detection of uncertain area and organization method is well represented in our previous work [1]. In ubiquitous environment, we need several preprocessing modules, acquisition module
Class 1
Class 2
(a) Linear function applied
Cla ss 1 Class 2 Uncertain data
(b) Nonlinear function applied
Class 1
Class 2
Boundary
(c) Boundary for uncertain data
Figure 1: Data classification problem with data uncertainty.
and context management module, for service [2]. Based on the previous process, our proposal can be adopted as an aggregation module at the last phase of processing modules for mobile device. With our proposal, sensed data and environment information can be classified in a more accurate and efficient way so that the server system can analyze the status correctly and cope with the situation properly.
This paper is organized as follows. In Section 2, we present related work about general aggregation models and data classification mechanisms. In Section 3, we explain our proposed aggregation method based on hierarchical classification and reinforcement learning.Section 4describes simulation results and analysis. We conclude the paper and describe our future work inSection 5.
2. Related Work
In ubiquitous environment, the types of information, their complexity, and their similarity have been increased. Even if the similar features and common values were extracted from each data, some of them are hard to classify because they are uncertain to be assigned to any of the groups, such as inFigure 1. Some researches dealing with this problem have been carried out.
Su et al. proposed a hierarchical aggregate classification mechanism in tree structure where each sensor node locally makes cluster analysis and forwards only its decision to the parent node [3]. The decisions are aggregated along the tree, and eventually the global agreement is achieved at the sink node. Kunal and Mohan presented a distributed reinforcement learning (DReL) middleware that provides adaptive WSN management by applying techniques from reinforcement learning and utility theory by exploiting a two-tier learning scheme [4]. Mal-Sarkar et al. proposed a soft computing approach to manage uncertainty by reasoning over inconsistent, incomplete, and fragmentary information using classical rough set and dominance-based rough set the-ories [5]. Yu et al. presented a comprehensive framework for managing continuously changing data objects with insights into the spatiotemporal uncertainty problem and presented an original parallel-processing solution for managing the
uncertainty using the map-reduce platform of cloud comput-ing [6]. Zhang et al. proposed a trust based framework, which is rooted in statistics and some other coupled techniques. The trustworthiness of each individual sensor node is evaluated by using an information theoretic concept, Kullback-Leibler (KL) distance, to identify the compromised nodes through an unsupervised learning algorithm [7]. Ou et al. presented a reinforcement learning approach to multisensor fusion problems with conflicting objectives when the mapping of multiple raw streams of sensory data to the appropriate actions is not easy, especially when multiple conflicting objectives are involved [8]. Savi´c and Limbourg proposed a reliable aggregation of sensor data for safety related systems applying the Dempster-Shafer theory to combine multiple unreliable and uncertain knowledge sources [9]. Fong et al. presented a stream-based classification to handle continuous data streams, which are unbound and unstructured and simulated on analyzing biological signal such as diagnostic tests in real time [10]. In [11], Ho´nko proposed a framework for generating classification rules from relational data. The framework was intended for mining relational data and was defined in granular computing theory. Pedrycz and Bargiela designed granular prototypes being reflective of the structure of data to a higher extent than the representation that is provided by their numeric counterparts [12]. The design was formulated as an optimization problem, which is guided by the coverage criterion, meaning that it maximizes the number of data for which their granular realization includes the original data.
3. Hierarchical Classification
and Reinforcement Learning
for Data Uncertainty
In this work, our goal is to increase reasonability while min-imizing predictive error using class hierarchy reinforcement learning.
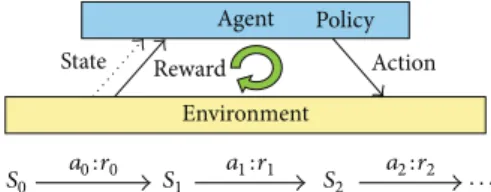
Figure 2simply shows elements of reinforcement learning and explains the process of how action influences next states in transition model. Reward𝑟𝑖is an immediate value of state-action transition and policy maps states to state-action 𝑎𝑖, and
Environment
State Reward Action
S0 a0:r0 S1 a1:r1 S2 a2:r2 · · ·
Figure 2: Elements of reinforcement learning.
an agent can be used to predict how the environment will respond to its actions. Given a state and an action, the model produces a prediction of the resultant next state and next reward. If the model is stochastic, there are several possible next states and next rewards, each with some probability of occurring [13].
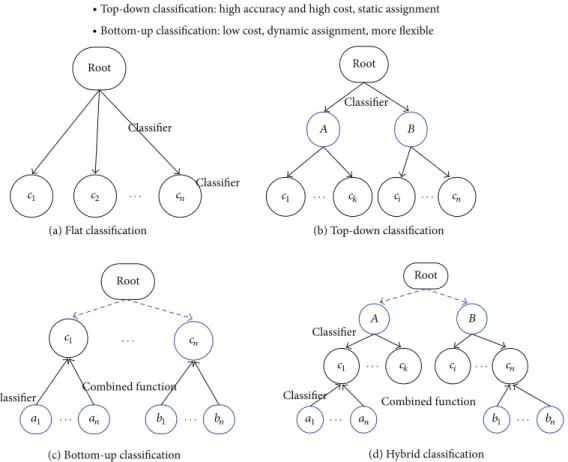
Most classification systems assume that the level of all classes is flat and each document is labeled by one class. Hierarchically structured classes were examined in some researches where the classes are reorganized into a hierarchi-cal structure for increasing specificityFigure 3. Though a doc-ument assigned to a child class is automatically considered as belonging to a parent class, the document is not allowed to belong to more than two classes but on a generalization path in the hierarchy. Hierarchical classification can achieve much better performance than flat classification; however, it is also known as the complex related to class organization. Combining functions for class assignment is also very high. In general, top-down method is known as more superior than bottom-up. However, bottom-up method is more flexible than top-down because we need only to adjust combining functions without entire retraining process to update existing rules.
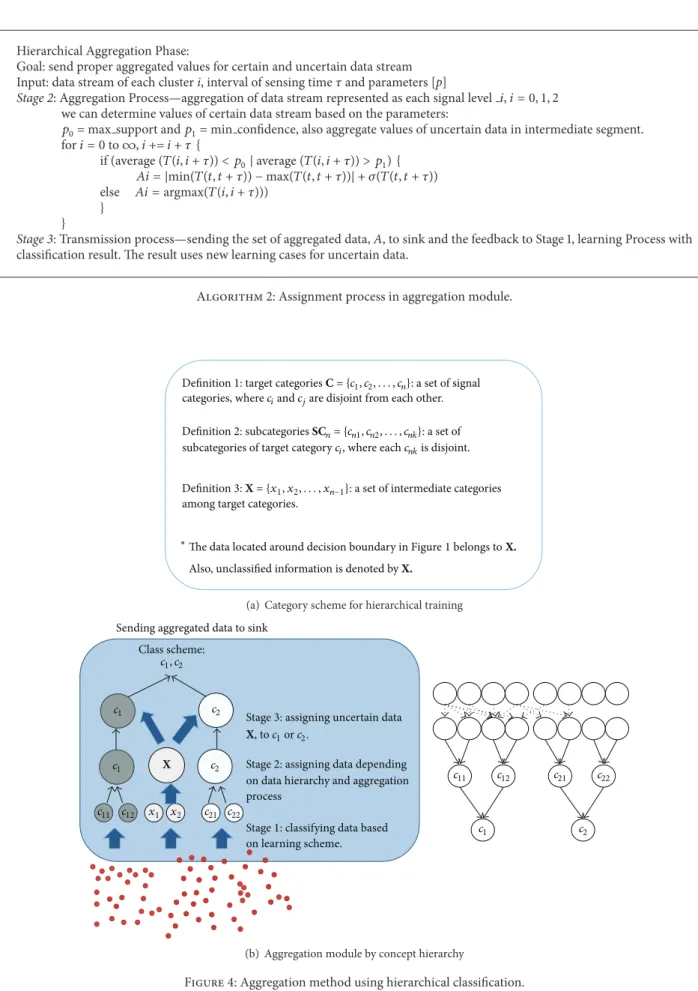
Figure 4shows the overview of our proposed classifica-tion method based on hierarchical classificaclassifica-tion.
The training set construction part of each target category is based on our previous work, and it was proposed for automatic finding of uncertain boundary area X through clustering algorithms, well presented in previous study [2]. In our system, uncertain information collected from sensor data stream and current status are reorganized to subcategories based on class relevance and hierarchy. And the information is used for learning process, and then future classification can be reassigned more correctly performing a bottom-up hierarchical classification. New input data can also be classified more accurately in progress through multiple stages in a manner of reinforcement learning. And they can be decided under predefined condition or action in the final stage. After the aggregated data are sent to the server, the result is sent back to learning process. Processes are described in more detail.
3.1. Category Design and Definition. In Figure 1, decision boundary is not a line but a region, and the data on this boundary region could be predicted as false positive. Thus we separate the training set into target and intermediate categories as in (c).Figure 4shows the categorization scheme for hierarchical training and assignment rules of reinforce-ment approach. For hierarchical training, we add category
categories C is predefined categories given by the user for the classification task, and the set is ultimately classified. The set of subcategories SCnis divided relatively into small classes from a target category𝑐𝑖, whose subcategories𝑐𝑖𝑗are disjoint from one another. Aset of intermediate categories X is for uncertain data. We need to analyze the relevance among target classes to categorize the data in the class X, and these unclassified data categorized in X need to be assigned to target classes later. Here is the definition of each category.
3.1.1. A Set of Target Categories. A set of target categories,
C = {𝑐1, 𝑐2, . . . , 𝑐𝑛}, is a set of predefined categories given by user for classification task. Also, Tr{C} is a set of training doc-uments for a set of target categories, C. They are constructed from documents representing each𝑐𝑖.
3.1.2. A Set of Boundary Categories. A set of boundary
categories, X = {𝑥1, 𝑥2, . . . , 𝑥𝑚}, means a conceptual region representing uncertain boundary area distinguishing of each target class. It is to analyze the relevance among target classes. The data located around decision boundary belong to X. Figure 1(b) represents a confusional area between 𝑐𝑖 and 𝑐𝑗, and this area becomes meaningless when there are few common features and when there is also low correlation between𝑐𝑖and𝑐𝑗.
3.1.3. A Set of Subclasses. A set of subclasses, Sc𝑖= {𝑐𝑖1, 𝑐𝑖2, . . . ,
𝑐𝑖𝑗}, is a set of more relatively small classes from a target category,𝑐𝑖, where each𝑐𝑛𝑗is disjoint with one another. Also, the entire set of subclasses for a set of target categories, SC, is presented as SC= sc1∪ sc2 ∪, . . . , ∪ sc𝑛.
3.2. Reinforcement Learning and Classification for Data Uncer-tainty. In aggregation module, sensed data are checked if
they are authentic or not and then gathered according to environment information representing current status. After being gathered, they are aggregated and finally transmitted to server system. Uncertain information of the entire data can be assigned to the proper categories, and then feedback rules are found for a guideline on the previous stages in reinforcement manner.
Generally, traditional classifier makes a list of candidates in given data. And the list is simply assigned to the first candidate in the list, even though there may be subtle differences among the candidates. But, it is usually prone to make misclassification errors in an area of uncertain data in that case.Figure 4(b)shows how computation is adapted in the assigning process for uncertain data.
In stage 1, to classify the data in low layer category, we used well trained training dataset. They were trained by the reinforcement learning scheme. We can get the first candidate list made by bottom-up hierarchical classification based on learning scheme. These lists are sent to the next stage and ana-lyzed on comparisons using the candidates’ scores given by the classifier. In stage 2, we define a simple rule and parameter values as threshold to filter the uncertain data. When the data score satisfies a condition rule, including parameter values,
Classifier Root
c1 c2 cn
Classifier
· · ·
∙ Top-down classification: high accuracy and high cost, static assignment ∙ Bottom-up classification: low cost, dynamic assignment, more flexible
(a) Flat classification (b) Top-down classification
Root A B c1 ck ci cn Classifier · · · · Root a1 an b1 bn c1 cn Combined function Classifier · · · · · · ·
(c) Bottom-up classification (d) Hybrid classification
A B c1 ck ci cn a1 an b1 bn Root Combined function Classifier Classifier · · · · · · · ·
Figure 3: Comparison of classifications depending on hierarchy: solid line represents the need to apply a classification algorithm.
Reinforcement Learning Phase:
(i) Goal: finding optimal parameters for signal boundaries, where # of Signal level is n (ii) Input: data stream of sensor node gathered by learning policy P.
P is composed of a learning schedule, i.e. interval of learning time, and constrained-decision matrix D= {Dlevel 0, Dlevel 1, . . . , Dlevel n}.
Stage 1:
(a) Learning Process—finding optimal parameters, max support and min confidence
We perform reinforcement learning with Schedule𝑆 and decision 𝐷 given by experts.
(1) making learning data sets from sensor data streams segmented into different class and time between 𝑡 and 𝑡 + 𝜏, 𝑇(𝑡, 𝑡 + 𝜏), where 0 < 𝑡 < ∞
(2) analyzing segmented sensor data to be covered or be diverged by constrained-decision,𝑇(𝑡, 𝑡 + 𝜏), weight applied
𝑇(𝑡, 𝑡 + 𝜏) = 𝑇(𝑡, 𝑡 + 𝜏) + 𝑤,
w = weight parameter given by expert-constraint by (1) (3) aggregating values in segments
𝐴level𝑖= min (𝑇 (𝑡, 𝑡 + 𝜏)) − max (𝑇(𝑡, 𝑡 + 𝜏)) + 𝜎 (𝑇(𝑡, 𝑡 + 𝜏)), level 𝑖 = {0, 1, 2}
(4) computing threshold parameters for setting boundary region by (2), parameter(0) means max support, upper limit value in signal level 0., parameter(1) means min confidence, lower limit value in signal level 2.
these approximate factors, max support and min confidence are used in the next stage for hierarchical classification. (b) Classifying Process—applying the category scheme segmented by optimal parameters to sensor data
Hierarchical Aggregation Phase:
Goal: send proper aggregated values for certain and uncertain data stream Input: data stream of each cluster i, interval of sensing time𝜏 and parameters [p]
Stage 2: Aggregation Process—aggregation of data stream represented as each signal level 𝑖, 𝑖 = 0, 1, 2
we can determine values of certain data stream based on the parameters:
𝑝0= max support and𝑝1= min confidence, also aggregate values of uncertain data in intermediate segment. for𝑖 = 0 to ∞, 𝑖 += 𝑖 + 𝜏 { if (average (𝑇(𝑖, 𝑖 + 𝜏)) < 𝑝0| average (𝑇(𝑖, 𝑖 + 𝜏)) > 𝑝1){ 𝐴𝑖 = |min(𝑇(𝑡, 𝑡 + 𝜏)) − max(𝑇(𝑡, 𝑡 + 𝜏))| + 𝜎(𝑇(𝑡, 𝑡 + 𝜏)) else 𝐴𝑖 = argmax(𝑇(𝑖, 𝑖 + 𝜏))) } }
Stage 3: Transmission process—sending the set of aggregated data, A, to sink and the feedback to Stage 1, learning Process with
classification result. The result uses new learning cases for uncertain data.
Algorithm 2: Assignment process in aggregation module.
categories, whereciandcjare disjoint from each other.
subcategories of target categoryci, where eachcnkis disjoint.
among target categories.
Definition1: target categories C = {c1, c2, . . . , cn}: a set of signal
Definition2: subcategories SCn={cn1, cn2, . . . , cnk}: a set of
Definition3: X = {x1, x2, . . . , xn−1}: a set of intermediate categories
∗The data located around decision boundary in Figure1 belongs to X.
Also, unclassified information is denoted by X.
(a) Category scheme for hierarchical training
c2 c1 c2 c1 c21 c22 c11 c12
Stage1: classifying data based
on learning scheme.
Stage2: assigning data depending
on data hierarchy and aggregation process
Class scheme: c1, c2
Sending aggregated data to sink
c11
c1 c2
c12 c21 c22
x1 x2
X
Stage3: assigning uncertain data
X, to c1orc2.
(b) Aggregation module by concept hierarchy
0 2 4 6 8 10 12 0 5 10 15 20 25 30 35 Data stream
Recomputed data stream
Aggregation values Time
(T1) (T2) (T3) Interval of learning time:10
Figure 5: The effect of aggregation scheme by reinforcement learning (𝑥-axis: time, 𝑦-axis: data values).
Location1 Location2
Location3 Location4
Location5 Location6
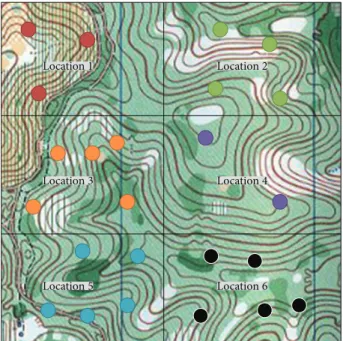
Figure 6: Simulation environment for sensing earthquake.
the data are classified in the final target category. When there are two categories, max support and min confidence represent the threshold scores to be considered for target categorization.
Time period in learning policy is optimally decided by the experts. Constrained-decision is also set by the expert for training. However, it can be computed dynamically depending on the environment information collected by the clusters as rounds are repeated. In constrained-decision matrix,𝐷 = {𝐷level0, 𝐷level1, . . . , 𝐷level𝑛}, level 𝑖 is the signal level to be monitored. And𝐷level𝑖 = [𝐷(𝑡, 𝑡 + 𝜏), 𝑤] is the pair of data stream patterns in time interval𝜏 and the related weight.
Figure 5shows the learning result of sensed value modifi-cation with weighted values applied. To compare the original data stream for learning and the learning result adopting our proposal, we accomplished some computations using basic
data. We set the learning time as 5, 10, 15, 20, 25, 30, and 35 and showed the difference between learning results.𝑇1shows that the current status is negative and𝑇3shows positive, where𝑇2 is not clear. Solid line shows the original values sensed by the nodes, and these values are adjusted in dotted line according to𝑇(𝑡, 𝑡 + 𝜏) inAlgorithm 1to get the better decision on the situation. Our proposal makes it clear whether the result is positive or negative. By adjusting the data, we can make more accurate decisions.
In constrained-decision matrix𝑐𝐷 = {𝐷level0, 𝐷level1, . . . ,
𝐷level𝑛}, level 𝑖 is signal level of data to be monitored. 𝐷level𝑖
is denoted by[𝐷(𝑡, 𝑡 + 𝜏), 𝑤]. It means a set of pairs with data pattern and corresponding weight value to each pattern in interval of time𝜏. Constrained-decision is set by experts at the initial stage and can be computed dynamically according to the aggregation result by aggregators or clusterheads
𝑤 ={{{{ { < 1, if signal level = 0 = 1, if signal level = 1 > 1, if signal level = 2 in # of signal level= 2, (1)
[parameters] = average (𝐴level𝑖+ 𝐴level𝑖+1) . (2) In aggregation phase, we can determine values of certain data stream based on parameters and aggregate values of uncertain data in intermediate segmentAlgorithm 2. When the signal level is 2, we can get two parameters, 𝑝0 and 𝑝1. 𝑝0 means upper limit value in signal level 0 and 𝑝1 means a lower limit value in signal level 2. We finally send the aggregated data to sink, and the feedback of these results comes back to learning phase. These classified results analyzed through each phase will be trained as informative and useful learning cases for uncertain data and they are used for further analysis.
4. Simulation and Analysis
4.1. Simulation Environment. In this section, we describe our
simulation and analyze the result. We used Matlab for our simulation.Figure 6shows the experiment environment for earthquake sensing. We divided the area into six sections, and a lot of sensor nodes and a clusterhead in each cluster are located in each location. Sensor nodes sense the vibrations of the earth and send the data to each clusterhead, and then the clusterheads aggregate the data before sending the result to server system or base station. We assume that there is an earthquake in time slot 3.
In the experiment, we used 0.3 and 1.6 as weight values for reinforcement learning phase. Then we get a set of parameters for thresholds in each location. Upper limit value, 𝑝0, and lower limit value,𝑝1, are given by the learning results. Sensing values are between 0 and 8, and when sensors sense more than or equal to 4, it could be an earthquake, while 7 or 8 means a strong earthquake. We assume the tremor lasts more than 10 seconds. Sensor nodes sense the earth every one second and clusterheads aggregate data every 20 seconds.
0 5 10 15 20 25 30 35 1 2 3 4 5 6 Da ta Time Mean Min Max Recomputed value 0 5 10 15 20 25 30 35 1 2 3 4 5 6 Da ta Time Location 3 Mean Min Max Recomputed value 0 5 10 15 20 25 30 35 1 2 3 4 5 6 Da ta Time Location 4 0 5 10 15 20 25 30 35 1 2 3 4 5 6 Da ta Time 0 5 10 15 20 25 30 35 1 2 3 4 5 6 Da ta Time Location 5 0 5 10 15 20 25 30 35 1 2 3 4 5 6 Da ta Time Location 6
Figure 7: Comparison of earthquake sensing results.
4.2. Simulation Result and Analysis. We have compared our
proposal and the other methods about sample data streams. As inFigure 7, our proposal shows a more informative and correct result by showing higher sensing value when there is a shake in location 1 in timeslot 3 and lower value in other timeslots or in different time slots.
It is possible that these data streams can send unclear results and are prone to analytical error. In our proposal, when data in the field delivered to the clusterhead are uncertain, we categorize the data to classify them more correctly based on threshold parameters given by hierarchical categorizing and reinforcement learning. The result can be more accurate when more learning is carried out.
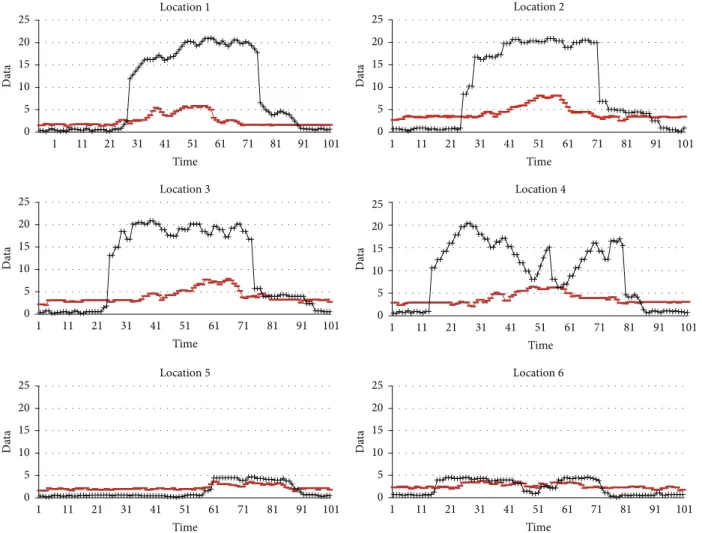
Figure 8shows the aggregation result from six locations in 100 unit times. Solid line is from aggregated values and the dotted lines are from the values with our proposal adopted.
With the values in dotted line, we can see that the aggregated values in solid line with slight differences are getting valid enough to be categorized in different classes.
5. Conclusion and Future Work
In a sensor network composed of many sensor nodes and a server system, intermediate devices between two elements need to communicate with one another to send and aggregate the sensed data before the data are delivered to server system. As the complex applications in specific domain are increased, management for data uncertainty is required, and aggregation needs to be dealt with in the process.
In this work, we have proposed a hierarchical aggrega-tion mechanism for classifying uncertain informaaggrega-tion from
0 5 10 15 20 25 1 11 21 31 41 51 61 71 81 91 101 Da ta Time Location 1 0 5 10 15 20 25 1 11 21 31 41 51 61 71 81 91 101 Da ta Time Location 2 0 5 10 15 20 25 1 11 21 31 41 51 61 71 81 91 101 Da ta Time Location 3 0 5 10 15 20 25 1 11 21 31 41 51 61 71 81 91 101 Da ta Time Location 4 0 5 10 15 20 25 1 11 21 31 41 51 61 71 81 91 101 Da ta Time Location 5 0 5 10 15 20 25 1 11 21 31 41 51 61 71 81 91 101 Da ta Time Location 6
Figure 8: Simulation result of our aggregation process (unit time = 100).
sensor data streams and environment information based on reinforcement learning to get correct and efficient data gathering result for reliable wireless sensor network. Different from traditional aggregation mechanisms, our proposal gives feedback to previous learning phase after sending aggregated information to server system. This feedback makes the data reorganized and retrained and it helps classification of uncer-tain data through the bottom-up hierarchical classification in reinforcement method. It provides additional advantages of reducing human efforts for identifying complex information. Our proposal can be adopted in various application systems which may include characteristics of uncertainty, and it can increase the reliability and robustness of the system. Our future work is to simulate the mechanism in multiple vector spaces such as physical sensor stream and context information of time and locations. We will show that our work can improve the efficiency in data processing and management.
Conflict of Interests
The authors declare that there is no conflict of interests regarding the publication of this paper.
Acknowledgment
This research was supported by Basic Science Research Program through the National Research Foundation of Korea (NRF) funded by the Ministry of Education, Science, and Technology (no. 2012R1A1A3019459).
References
[1] Y. J. Choi, J. G. Ji, and S. S. Park, “Construction scheme of training data using automated exploring,” Journal of Korea
Information Processing Systems B, vol. 16, no. 6, pp. 1479–1488,
2009.
[2] Y. J. Choi and I. Doh, “Security based semantic context awareness system for M2M ubiquitous healthcare service,” in
Ubiquitous Information Technologies and Applications, vol. 214
of Lecture Notes in Electrical Engineering, pp. 187–196, 2013. [3] L. Su, J. Gao, Y. Yang, T. F. Abdelzaher, B. Ding, and J. Han,
“Hierarchical aggregate classification with limited supervision for data reduction in wireless sensor networks,” in Proceedings
of the 9th ACM Conference on Embedded Networked Sensor Systems (SenSys ’11), pp. 40–53, November 2011.
[4] S. Kunal and K. Mohan, “DReL: a middleware for wireless sensor networks management using reinforcement learning
on Middleware Tools, Services and Run-Time Support for Sensor Networks (MidSense ’10), pp. 1–7, 2010.
[5] S. Mal-Sarkar, I. U. Sikder, Y. Chansu, and V. K. Konangi, “Uncertainty-aware wireless sensor networks,” International
Journal of Mobile Communications, vol. 7, no. 3, pp. 330–345,
2009.
[6] B. Yu, R. Sen, and D. H. Jeong, “An integrated framework for managing sensor data uncertainty using cloud computing,”
Information Systems, vol. 38, no. 8, pp. 1252–1252, 2013.
[7] W. Zhang, S. K. Das, and Y. Liu, “A trust based framework for secure data aggregation in wireless sensor networks,” in
Proceedings of the 3rd Annual IEEE Communications Society on Sensor and Ad hoc Communications and Networks (Secon ’06),
pp. 60–69, September 2006.
[8] S. Ou, A. H. Fagg, P. Shenoy, and L. Chen, “Application of reinforcement learning in multisensor fusion problems with conflicting control objectives,” Intelligent Automation and Soft
Computing, vol. 15, no. 2, pp. 223–235, 2009.
[9] R. Savi´c and P. Limbourg, “Aggregating uncertain sensor information for safety related systems,” in Proceedings of the
European Safety and Reliability Conference (ESREL ’06), pp.
1909–1913, September 2006.
[10] S. Fong, Y. Hang, S. Mohammed, and J. Fiaidhi, “Stream-based biomedical classification algorithms for analyzing biosignals,”
Journal of Information Processing Systems, vol. 7, no. 2, pp. 717–
732, 2011.
[11] P. Ho´nko, “Granular computing for relational data classifica-tion,” Journal of Intelligent Information Systems, vol. 4, no. 2, pp. 187–210, 2013.
[12] W. Pedrycz and A. Bargiela, “An optimization of allocation of information granularity in the interpretation of data structures: toward granular fuzzy clustering,” IEEE Transactions on
Sys-tems, Man, and Cybernetics, vol. 42, no. 3, pp. 582–590, 2012.
[13] P. Dayan and B. W. Balleine, “Reward, motivation, and rein-forcement learning,” Neuron, vol. 36, no. 2, pp. 285–298, 2002.