J Korean Acad Community Health Nurs (지역사회간호학회지) https://doi.org/10.12799/jkachn.2019.30.4.508
Factors Influencing Participation in National Health Screening Program
among Korean Older Adults by Cognitive Function Level
Han, Song Yi
1· Ko, Young
21Assistant Professor, Department of Nursing Science, Sunmoon University, Asan 2Associate Professor, College of Nursing, Gachon University, Incheon, Korea
Purpose: The aim of this study was to identify the participation rate of the National Health Screening Program (NHSP) and its influencing factors by cognitive function level in Korean older adults. Methods: This study was a secondary analysis using data from the survey of the Korean Longitudinal Study of Aging in 2016. The data were analyzed using x2 test and multiple logistic regression. Results: The participation rates of the NHSP in the mild cognitive impairment
group (79.6%) and the suspected dementia group (58.0%) were lower than the normal cognitive function group (88.1%). The factors influencing NHSP varied by cognitive function level. Especially, in the suspected dementia group, higher participation rates of the NHSP were associated with living in rural areas, enrollment in private health insurance, no depressive symptoms, participation in social activities, and no living with children. Depression and participation in social activities influenced participation in NHSP in all groups. Conclusion: This study suggests that interventions differentiated by cognitive function level are important for increasing the participation in the health screening. Key Words: Aged; Mass screening; Cognition
Corresponding author: Ko Young
College of Nursing, Gachon University, 191 Hambakmoei-ro, Yeonsu-gu, Incheon 21936, Korea. Tel: +82-32-820-4205, Fax: +82-32-820-4201, E-mail: [email protected]
Received: Aug 20, 2019 / Revised: Nov 7, 2019 / Accepted: Nov 7, 2019
This is an open access article distributed under the terms of the Creative Commons Attribution Non-Commercial License (http://creativecommons.org/licenses/ by-nc/3.0), which permits unrestricted non-commercial use, distribution, and reproduction in any medium, provided the original work is properly cited.
INTRODUCTION
1. Background
As the elderly population is rapidly growing across the world, interest in the life in old age is increasing. To im-prove the quality of life of the older adults, extending the health expectancy of the older adults has become an im-portant element of health policies [1]. The prevalence rates of chronic diseases are increasing as population aging pro-gresses, and the growth of the elderly population natu-rally leads to an increase in the medical expenditures of older adults [1,2]. In fact, 89.5% of the elderly population in Korea are reported to have chronic diseases, and 51.0% are estimated to have three or more chronic diseases [3]. The medical expenditures for older adults are also re-ported to account for 40% of the total medical expendi-tures, so there is a need to take measures for this problem [4]. Therefore, preventive medicine services to prevent chronic diseases and reduce age-associated declines in
physical, mental, and cognitive functions are becoming in-creasingly important [1,2]. Many countries have already recognized the need for health screening as a preventive health policy and have implemented national health screening programs [5-8]. Korea introduced the National Health Screening Program (NHSP) in 1980 and is cur-rently implementing it for the entire population across the lifespan. This program contributes to health maintenance, health promotion, and disease prevention, and at the same time helps to minimize economic losses caused by medical expenditures [9]. Actually, the NHSP has greatly contri-buted to the detection of chronic diseases and improve-ment of the treatimprove-ment rates of chronic diseases [10]. There-fore, for older adults, health screening will play an im-portant role in helping them to have a healthy old age. However, while the screening rate of the NHSP in the en-tire population is about 82%, the screening rate in the eld-erly population is relatively low with about 61%, so it is re-quired to take measures to increase the screening rate in the elderly population.
As the elderly population increases, the number of old-er adults with cognitive decline is increasing. As of 2018, the prevalence of dementia and that of mild cognitive im-pairment in older adults are 10.2% and 22.6%, respectively [11]. The number of older adults with dementia is esti-mated to increase more and more rapidly [11]. In addition to demographic characteristics, the presence of chronic diseases such as hypertension, diabetes, and hyperlipi-demia has been reported to be a risk factor for mild cogni-tive impairment [12]. In a previous study comparing the prevalence rates of chronic diseases between older adults with cognitive impairment and those with normal cogni-tive function, the prevalence of chronic diseases was found to be higher in older adults with cognitive impairment [13]. These findings demonstrate that management of chro-nic diseases is important for prevention of dementia. There-fore, health screening is necessary for early detection and management of chronic diseases in older adults with cogni-tive impairment. However, there has been a lack of research on the screening rate of the NHSP among older adults with cognitive decline and the influencing factors for it.
As social interest in health screening has been increas-ing, several studies on factors influencing the participa-tion rate of the health screening have been conducted [14- 17]. According to previous studies, participation in health screening is influenced by various factors, including gen-der, age, marital status, education level, income level, health behavior, health status, social networks, and enroll-ment status of private health insurance [14-17]. However, so far, most of the studies on the participation rate of the NHSP have been conducted among the total middle-aged population or the elderly population [14,15,18]. In addi-tion, the characteristics of the participation rate by the cog-nitive functional level of older adults have not been iden-tified. Therefore, this study aimed to investigate the partic-ipation rate of the NHSP by cognitive function level in old-er adults and the factors affecting the participation rate.
2. Purpose
The purpose of this study was to identify the partic-ipation rate of the NHSP according to cognitive functional levels of older adults and to identify the factors influenc-ing the participation rate.
METHODS
1. Study Design
This study is a secondary analysis research using the
data from the 6th Korean Longitudinal Study of Aging
(KLoSA) conducted in 2016.
2. Participants
The KLoSA has been conducted by the Korea Employ-ment Information Service every two years since 2006. This survey is conducted among people aged 45 or older nation-wide in 15 administrative regions of Korea, including 7 special/metropolitan cities (Seoul, Busan, Daegu, Incheon, Gwangju, Daejeon, and Ulsan) and 8 provinces (Gyeong-gi, Gangwon, Chungbuk, Chungnam,Jeonbuk,Jeonnam, Gyeongbuk, and Gyeongnam), excluding Jeju Province among 9 provinces of Korea. The data is publicly available and can be downloaded at the homepage of the Korea Employment Information Service. This study was con-ducted using the data of 4,581 people aged 65 or over from the 6th KLoSA conducted in 2016. Among the 4,581 older adults, 250 people with missing data for the analysis varia-bles were excluded, and a total of 4,331 people were in-cluded in the final analysis. The participants consisted of 622 older adults with suspected dementia, 1,025 older adults with mild cognitive impairment, and 2,684 older adults with normal cognitive function.
This study was conducted after receiving an exemption determination from the IRB of the university where the re-searcher belongs (IRB no. 1044396-201609-HR-069-01).
3. Measures
1) General characteristics
The general characteristics of participants included gender, age, education level, presence of the spouse, pres-ence of religion, residential area, subjective economic sta-tus, enrollment status of private health insurance, smok-ing status, drinksmok-ing status, participation in social activity, and co-residence with children. Regarding age, older adults were divided into young-old adults (aged 65-74 years) and old-old adults (aged 75 years or over). The edu-cation level was reclassified into 'elementary school grad-uation or lower' and 'middle school gradgrad-uation or higher.' The presence of the spouse was examined using the ques-tion about marital status, and if the participant's marital status was married, it was classified as 'married.' If the participant's marital status was separated, divorced, wid-owed, spouse missing, or unmarried, it was classified as 'unmarried/separated.' Subjective economic status was assessed using the question about satisfaction with one's economic status. Subjective economic status was classified as 'low' if the score for satisfaction with one's economic
status was 0~30 points, as 'medium' if the score was 40~ 60 points, and as 'high' if the score was 70~100 points. Participation in social activity was examined using the question "Is there any social group or meeting you partic-ipate among the activities listed below?", and it was classi-fied as 'participation in social activities' or 'no partic-ipation in social activities' according to whether or not the respondent participates in one or more social activities among religious meetings, social gatherings (rotating sav-ings and credit associations, senior centers, etc.), leisure/ culture/sports-related organizations, alumni associations/ hometown community associations/clan meetings, vol-unteer groups, and political party organizations/civil so-ciety organizations/interest groups. Co-residence with children was classified into 'living with children' and 'no living with children', using the question asking about whether the respondents currently live with their children in the same household.
2) Health status
Health status was assessed in terms of depression, sub-jective health status, and the number of chronic diseases. Depression was measured using the Korean version of the Center for Epidemiological Studies-Depression Scale (CES- D-10). The total scores for depression were calcu-lated by adding the scores of 10 dichotomous items, scored 0 or 1 point, and if the total score was 4 points or higher, it was considered to indicate the presence of depression [19, 20]. In this study, the reliability coefficient of the depres-sion assessment tool was .841. Subjective health status was reclassified as follows: it was categorized as 'good' if the participant's health status was self-assessed as 'very good' or 'good' in response to the question asking about how in-dividuals would rate their overall health status, and classi-fied as 'fair' if health status was self-rated as 'fair', and clas-sified as 'poor' if health status was self-rated as 'poor' or 'very poor.' The number of chronic diseases was reclassi-fied into 'none', 'one', and 'two or more' by counting the number of diagnosed diseases among 10 listed chronic diseases, such as hypertension, diabetes, cancer (malignant tumor), chronic lung disease, hepatic disease, cardiovas-cular disease, cerebrovascardiovas-cular disease, psychiatric disease, arthritis and rheumatic disease, and urinary system disease.
3) Cognitive function
Cognitive function was measured using the total scores of the Korean Mini-Mental State Examination (K-MMSE) [21]. The maximum total score of the K-MMSE is 30 points. A score of 17 or less points was classified as 'suspected de-mentia', a score of 18 to 23 points was classified as 'mild
cognitive impairment' and a score of 24 or higher points was considered to indicate 'normal cognitive function'[21]. The value for reliability was .801 in this study.
4) Participation in NHSP
The participation or non-participation in the NHSP was examined using the participants' responses (Yes or No) to the dichotomous question "Have you ever received pri-mary health screening freely provided by the National Health Insurance Service and the Medical Aid Program in the past two years?"
4. Data Analysis
Collected data was analyzed using SPSS/WIN 23. The general characteristics of participants were analyzed us-ing descriptive statistics such as the frequency, percent-age, mean, and standard deviation. x2 test was used to
an-alyze differences in the participation rate of the NHSP ac-cording to general characteristics between the groups of older adults with suspected dementia, older adults with mild cognitive impairment, and older adults with normal cognitive function. Logistic regression analysis was per-formed to identify the factors influencing the participation rate of the NHSP, and odds ratios and 95% confidence in-tervals were estimated.
RESULTS
1. General Characteristics of Participants
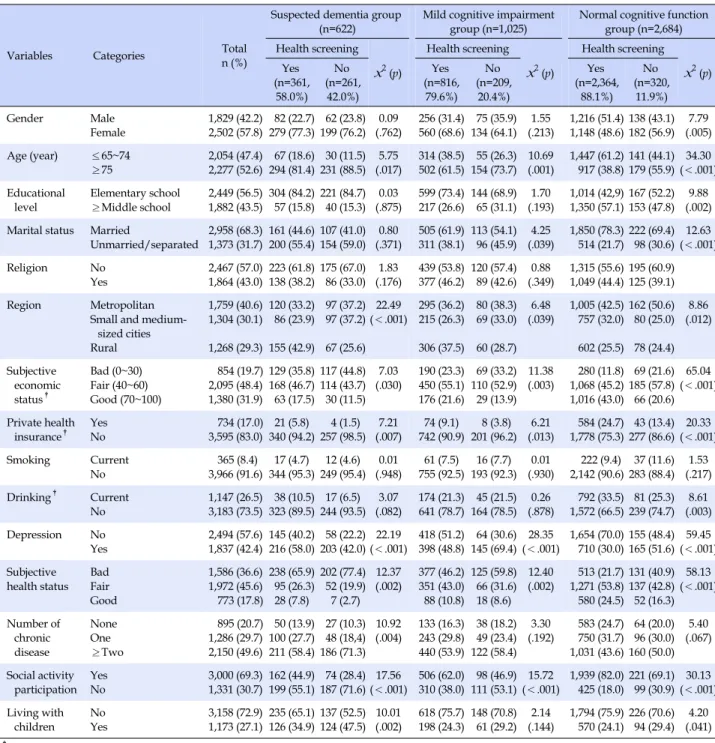
The general characteristics of participants are shown in Table 1. The number of female participants was higher than that of male participants, with 2,502 females (57.8%) and 1,829 males (42.2%), and the mean age of participants was 75.55±7.16 years. In terms of cognitive function lev-els, the participants consisted of 622 older adults with sus-pected dementia (14.4%), 1,025 older adults with mild cog-nitive impairment (23.7%), and 2,684 older adults with normal cognitive function (62.0%). Among the partici-pants, 3,541 people (81.8%) were found to have received health screening provided by the NHSP.
2. Differences in the Participation Rate of the NHSP
according to Cognitive Function Levels
The differences in the participation rate of the NHSP ac-cording to cognitive function levels are shown in Table 1. In older adults with suspected dementia, there were sig-nificant differences in the participation rate of NHSP
ac-Table 1. Differences of Health Screening Program Participation by Cognitive Function (N=4,331)
Variables Categories n (%)Total
Suspected dementia group
(n=622) Mild cognitive impairment group (n=1,025) Normal cognitive function group (n=2,684) Health screening x2(p) Health screening x2(p) Health screening x2(p) Yes (n=361, 58.0%) No (n=261, 42.0%) Yes (n=816, 79.6%) No (n=209, 20.4%) Yes (n=2,364, 88.1%) No (n=320, 11.9%) Gender Male Female 1,829 (42.2)2,502 (57.8) 82 (22.7)279 (77.3) 62 (23.8)199 (76.2) (.762)0.09 560 (68.6)256 (31.4) 75 (35.9)134 (64.1) (.213)1.55 1,216 (51.4)1,148 (48.6)138 (43.1)182 (56.9) (.005)7.79 Age (year) ≤65~74 ≥75 2,054 (47.4)2,277 (52.6) 67 (18.6)294 (81.4) 30 (11.5)231 (88.5) (.017)5.75 502 (61.5)314 (38.5) 55 (26.3)154 (73.7) 10.69(.001) 1,447 (61.2)917 (38.8)141 (44.1)179 (55.9)(<.001)34.30 Educational level Elementary school ≥Middle school 2,449 (56.5) 1,882 (43.5) 304 (84.2) 57 (15.8) 221 (84.7) 40 (15.3) 0.03 (.875) 599 (73.4) 217 (26.6) 144 (68.9) 65 (31.1) 1.70 (.193) 1,014 (42,9) 1,350 (57.1) 167 (52.2) 153 (47.8) 9.88 (.002) Marital status Married
Unmarried/separated 2,958 (68.3)1,373 (31.7) 161 (44.6)200 (55.4)107 (41.0)154 (59.0) (.371)0.80 311 (38.1)505 (61.9) 113 (54.1) 96 (45.9) (.039)4.25 1,850 (78.3)514 (21.7)222 (69.4) 98 (30.6)(<.001)12.63
Religion No
Yes 2,467 (57.0)1,864 (43.0) 223 (61.8)138 (38.2)175 (67.0) 86 (33.0) (.176)1.83 439 (53.8)377 (46.2) 120 (57.4) 89 (42.6) (.349)0.88 1,315 (55.6)1,049 (44.4)195 (60.9)125 (39.1) Region Metropolitan
Small and medium- sized cities Rural 1,759 (40.6) 1,304 (30.1) 1,268 (29.3) 120 (33.2) 86 (23.9) 155 (42.9) 97 (37.2) 97 (37.2) 67 (25.6) 22.49 (<.001) 295 (36.2) 215 (26.3) 306 (37.5) 80 (38.3) 69 (33.0) 60 (28.7) 6.48 (.039) 1,005 (42.5) 757 (32.0) 602 (25.5) 162 (50.6) 80 (25.0) 78 (24.4) 8.86 (.012) Subjective economic status† Bad (0~30) Fair (40~60) Good (70~100) 854 (19.7) 2,095 (48.4) 1,380 (31.9) 129 (35.8) 168 (46.7) 63 (17.5) 117 (44.8) 114 (43.7) 30 (11.5) 7.03 (.030) 190 (23.3) 450 (55.1) 176 (21.6) 69 (33.2) 110 (52.9) 29 (13.9) 11.38 (.003) 280 (11.8) 1,068 (45.2) 1,016 (43.0) 69 (21.6) 185 (57.8) 66 (20.6) 65.04 (<.001) Private health insurance† Yes No 3,595 (83.0)734 (17.0) 340 (94.2)21 (5.8) 257 (98.5) 4 (1.5) (.007)7.21 742 (90.9)74 (9.1) 201 (96.2) 8 (3.8) (.013)6.21 1,778 (75.3)584 (24.7) 43 (13.4)277 (86.6)(<.001)20.33 Smoking Current No 365 (8.4) 3,966 (91.6) 17 (4.7) 344 (95.3) 12 (4.6) 249 (95.4) 0.01 (.948) 61 (7.5) 755 (92.5) 16 (7.7) 193 (92.3) 0.01 (.930) 222 (9.4) 2,142 (90.6) 37 (11.6) 283 (88.4) 1.53 (.217) Drinking† Current No 1,147 (26.5)3,183 (73.5) 38 (10.5)323 (89.5)244 (93.5)17 (6.5) (.082)3.07 641 (78.7)174 (21.3) 45 (21.5)164 (78.5) (.878)0.26 1,572 (66.5)792 (33.5) 81 (25.3)239 (74.7) (.003)8.61 Depression No Yes 2,494 (57.6)1,837 (42.4) 145 (40.2)216 (58.0) 58 (22.2)203 (42.0)(<.001)22.19 398 (48.8)418 (51.2) 64 (30.6)145 (69.4)(<.001)28.35 1,654 (70.0)710 (30.0)155 (48.4)165 (51.6)(<.001)59.45 Subjective health status Bad Fair Good 1,586 (36.6) 1,972 (45.6) 773 (17.8) 238 (65.9) 95 (26.3) 28 (7.8) 202 (77.4) 52 (19.9) 7 (2.7) 12.37 (.002) 377 (46.2) 351 (43.0) 88 (10.8) 125 (59.8) 66 (31.6) 18 (8.6) 12.40 (.002) 513 (21.7) 1,271 (53.8) 580 (24.5) 131 (40.9) 137 (42.8) 52 (16.3) 58.13 (<.001) Number of chronic disease None One ≥Two 895 (20.7) 1,286 (29.7) 2,150 (49.6) 50 (13.9) 100 (27.7) 211 (58.4) 27 (10.3) 48 (18,4) 186 (71.3) 10.92 (.004) 133 (16.3)243 (29.8) 440 (53.9) 38 (18.2) 49 (23.4) 122 (58.4) 3.30 (.192) 583 (24.7)750 (31.7) 1,031 (43.6) 64 (20.0) 96 (30.0) 160 (50.0) 5.40 (.067) Social activity participation YesNo 3,000 (69.3)1,331 (30.7) 162 (44.9)199 (55.1) 74 (28.4)187 (71.6)(<.001)17.56 506 (62.0)310 (38.0) 98 (46.9)111 (53.1)(<.001)15.72 1,939 (82.0)425 (18.0)221 (69.1) 99 (30.9)(<.001)30.13 Living with children NoYes 3,158 (72.9)1,173 (27.1) 235 (65.1)126 (34.9)137 (52.5)124 (47.5) (.002)10.01 618 (75.7)198 (24.3) 148 (70.8) 61 (29.2) (.144)2.14 1,794 (75.9)570 (24.1)226 (70.6) 94 (29.4) (.041)4.20 †
Missing value excluded.
cording to age (x2=5.75, p=.017), residential area (x2=22.49,
p<.001), subjective economic status (x2=7.03, p=.030),
en-rollment status of private health insurance (x2=7.21, p=
.007), depression (x2=22.19, p<.001), subjective health status
(x2=12.37, p<.001), number of chronic diseases (x2=10.92,
p=.004), participation in social activity (x2=17.56, p<.001),
and living with children (x2=10.01, p=.002).
In older adults with mild cognitive impairment, there were differences in the participation rate of NHSP
ac-cording to age (x2=10.69, p=.001), presence of the spouse
(x2=4.25, p=.039), residential area (x2=6.48, p=.039),
sub-jective economic status (x2=11.38, p=.003), enrollment in
private health insurance (x2=6.21, p=.013), depression
level (x2=28.35, p<.001), subjective health status (x2=12.40,
p=.002), and participation in social activity (x2=15.72,
p<.001). In older adults with normal cognitive function, there were differences in the screening rate of NHSP de-pending on all the characteristics other than smoking status.
Table 2. Influencing Factors on Participation of National Health Screening Program (N=4,331) Variables Categories Suspected dementia group (n=622) Mild cognitive impairment group (n=1,025) Normal cognitive function group (n=2,684)
OR (95% CI) p OR (95% CI) p OR (95% CI) p
Gender Female (ref.)
Male 0.89 (0.49~1.63) .707 1.23 (0.73~2.09) .441 1.59 (1.10~2.31) .015
Age (year) 65~74
≥75 (ref.) 1.33 (0.77~2.29) .305 1.62 (1.10~2.40) .015 1.69 (1.29~2.21) <.001
Educational level
≤Elementary school (ref.)
≥Middle school 1.02 (0.60~1.75) .937 0.71 (0.48~1.04) .074 0.93 (0.70~1.22) .588
Marital status Married
Unmarried/separated (ref.)
1.15 (0.76~1.74) .507 1.26 (0.87~1.81) .226 0.97 (0.72~1.30) .825
Religion No (ref.)
Yes 1.17 (0.80~1.70) .424 1.10 (0.79~1.53) .581 1.17 (0.91~1.51) .229
Region Metropolitan (ref.)
Small and medium-sized cities Rural 0.69 (0.45~1.07) 1.53 (1.00~2.33) .094 .049 0.89 (0.60~1.32) 1.34 (0.90~1.99) .552 .151 1.41 (1.05~1.90) 1.17 (0.86~1.60) .021 .323 Subjective economic status† Bad (0~30) (ref.) Fair (40~60) Good (70~100) 1.11 (0.76~1.63) 1.13 (0.64~2.00) .601 .683 1.17 (0.80~1.69) 1.41 (0.83~2.42) .424 .207 1.04 (0.75~1.44) 2.12 (1.42~3.17) .807 <.001 Private health insurance Yes No (ref.) 3.51 (1.06~11.60) .040 1.85 (0.83~4.16) .131 1.46 (1.02~2.09) .040
Smoking Current (ref.)
No 0.77 (0.44~1.33) .349 0.61 (0.38~1.00) .051 0.74 (0.52~1.05) .336
Drinking† Current (ref.)
No 0.56 (0.29~1.08) .083 1.10 (0.71~1.69) .672 0.88 (0.65~1.19) .395 Depression No Yes (ref.) 2.07 (1.40~3.06) <.001 1.94 (1.37~2.76) <.001 1.79 (1.38~2.31) <.001 Subjective health status Bad (ref.) Fair Good 1.15 (0.74~1.79) 1.96 (0.76~5.09) .534 .165 1.36 (0.93~1.99) 1.07 (0.57~2.00) .109 .829 1.56 (1.16~2.10) 1.51 (1.02~2.25) .003 .040 Number of chronic disease None One ≥Two (ref.) 1.25 (0.71~2.22) 1.64 (1.07~2.52) .440 .024 0.70 (0.47~1.11) 1.11 (0.75~1.64) .133 .591 0.88 (0.62~1.23) 0.93 (0.70~1.24) .442 .633 Social activity participation Yes No (ref.) 1.64 (1.11~2.42) .013 1.55 (1.11~2.16) .010 1.35 (1.01~1.79) .040 Living with children No Yes (ref.) 1.80 (0.26~2.59) .001 1.19 (0.82~1.71) .358 1.22 (0.93~1.61) .151 OR=odds ratio; CI=confidence interval; ref.=reference; †
Missing value excluded.
3. Factors Influencing the Participation Rate of the
NHSP
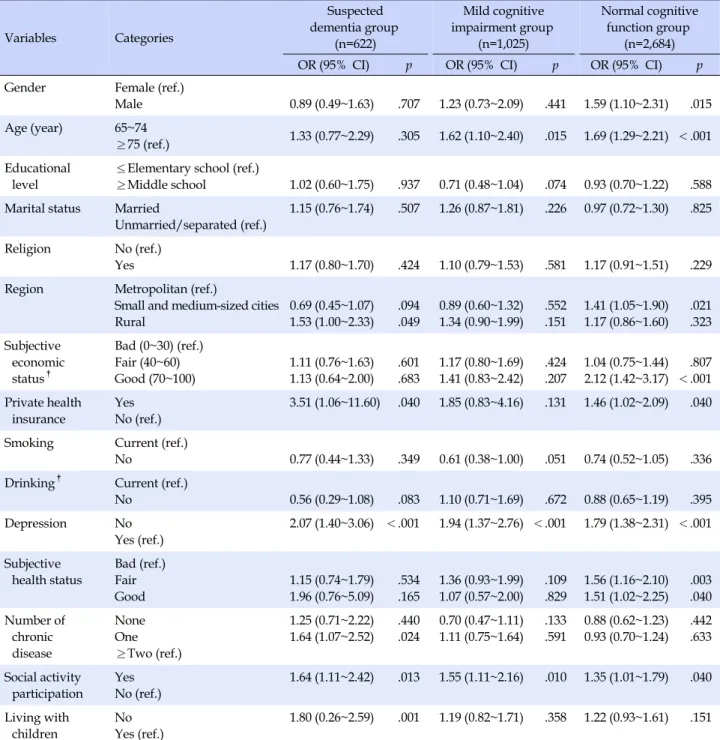
Logistic regression analysis was performed to identify the factors influencing the participation rate of the NHSP in older adults. The results are shown in Table 2.
In the suspected dementia group, residential area, en-rollment in private health insurance, depression, number of chronic diseases, participation in social activity, and
living with children were found to have a significant effect on the participation rate of the NHSP. As for residential area, older adults living in rural area were 1.53 times more likely to receive national health screening than those liv-ing in metropolitan cities (95% Confidence Interval [95% CI]=1.00~2.33). Regarding enrollment in private health in-surance, older adults with private health insurance were 3.51 times more likely to participate in NHSP than those without private health insurance (95% CI=1.06~11.60).
Regarding depression, older adults without depression were 2.07 times more likely to receive health screening than those with depression (95% CI=1.40~3.06). As to the number of chronic diseases, older adults with one chronic disease were 1.64 times more likely to attend the NHSP than those with two or more chronic diseases (95% CI=1.07~2.52). Regarding social activity participation, older adults participating in social activities were 1.64 times more likely to participate in the NHSP than those who do not participate in social activity (95% CI=1.11~ 2.42). As for co-residence with children, older adults who do not live with children were 1.80 times more likely to participate in the NHSP than those living with children in the same household (95% CI=1.26~2.59).
In the mild cognitive impairment group, age, depres-sion, and social activity participation were found to be sig-nificant influencing factors. Young-old adults (aged 65~74 years) were 1.62 times more likely to participate in the NHSP compared to old-old adults (aged 75 years and over) (95% CI=1.10~2.40). Also, older adults without de-pression were 1.94 times more likely to get health screen-ing than those without depression (95% CI=1.37~2.76). In addition, older adults participating in social activities were 1.55 times more likely to receive health screening than those without social activity participation (95% CI=1.11~ 2.16).
In normal cognitive function group, the participation rate of the NHSP was significantly different according to gender, age, residential area, subjective economic status, enrollment status of private health insurance, depression, subjective health status, and social activity participation. Regarding gender, older men were 1.59 times more likely to receive health screening than older women (95% CI= 1.10~2.31). In terms of age, young-old adults (aged 65~74 years) were 1.69 times more likely to receive health screen-ing than old-old adults (aged 75 and over) (95% CI=1.29~ 2.21). Regarding residential area, older adults living in small and medium-sized cities were 1.41 times more likely to get health screening than those living in metropolitan cities (95% CI=1.05~1.90). As for subjective economic sta-tus, older adults with high subjective economic status were 2.12 times more likely to get health screening than those with low subjective economic status (95% CI=1.42~ 3.17). Participants with private health insurance were 1.46 times more likely to receive health screening than those without it (95% CI=1.02~2.09). Older adults without de-pression were 1.79 times more likely to receive health screening than those with depression (95% CI=1.38~2.31). In addition, older adults with fair subjective health status were 1.79 times more likely to receive health screening
than those with poor subjective health status (95% CI= 1.16~2.10), and older adults with good subjective health status were 1.51 times more likely to receive health screen-ing than those with poor subjective health status (95% CI=1.02~2.25). Finally, older adults participating in social activities were 1.35 times more likely to get health screen-ing than those with no social activities (95% CI=1.01~1.79).
DISCUSSION
The elderly population with physical illnesses and cog-nitive problems is increasing as a result of rapid pop-ulation aging. Therefore, early detection and prevention of diseases and self-care of older adults are becoming in-creasingly more important. Accordingly, the 4th Health
Plan 2020 (2016~2020) of Korea has presented strategies for health promotion across the life span [22]. In particular, the government is implementing prevention-oriented pro-jects including the NHSP as one of the measures for health promotion for older adults. To this end, the government aims to increase the participation rate in the NHSP of older adults to 85% [22]. Therefore, this study attempted to ex-amine the participation rate of the NHSP in the elderly population and factors influencing the screening rate, us-ing the KLoSA data in order to present the basic data for practice and policies for improving the participation rate in the NHSP among elderly population. For this purpose, the participants were divided into three groups according to cognitive function levels: older adults with suspected dementia, those with mild cognitive impairment, and those with normal cognitive function.
The analysis results revealed various factors influenc-ing the participation rate in the NHSP accordinfluenc-ing to the cognitive function levels in the elderly population. First, age was a significant influencing factor for the participa-tion rate in the NHSP among older adults with mild cogni-tive impairment and normal cognicogni-tive function. This is consistent with the results of previous studies which showed a lower health screening rate in the old-old pop-ulation [5,14,15]. Rapid poppop-ulation aging has led to a rise in the number of older adults with mild cognitive impairment along with an increase in the old-old population.[3] To in-crease the participation rate of the NHSP in the old-old population, it is necessary to provide support for them to allow them to receive health screening easily in the commu-nity where they live. Especially, it is necessary to encour-age older adults to participate in the NHSP through face- to-face counseling and to strengthen measures such as trans-port services or mobility assistance for health screening.
NHSP only in the group of normal cognitive function group. In agreement with previous studies conducted in Korea, it was found that the participation rate of the NHSP was lower in older women than older men [14,15]. This re-sult is not consistent with the rere-sults of studies conducted in other countries. Several researchers reported a higher rate of health screening among older women [6,8,23]. In Korea, older women have more health problems due to their lower socioeconomic status than older men, and they play a greater role as caregivers, such as providing care for the family and the spouse, even in old age compared to older men [24]. These factors are reported to contribute to large gender disparities in health between older men and women [24]. In addition, it has been reported that there ex-ist great differences in life expectancy between older men and women, and that the ratio of older women to older men increases with increasing age [3]. These differences between older men and women may account for the fact that the participation rate of the NHSP was found to be lower among older women than older men in Korea in contrast with the results of studies in other countries. However, in order to prepare and take appropriate meas-ures, further research is needed to identify the reasons why older women showed a lower participation rate of the NHSP than older men in Korea.
In this study, the status of enrollment in private health insurance was found to have a significant effect on the par-ticipation rate of the NHSP in the suspected dementia group and normal cognitive function group, and this re-sult is consistent with findings of previous studies [15,25]. Economic status has been reported to be an important fac-tor influencing the participation rate of the NHSP [5], and the enrollment rate in private health insurance has been found to be higher among older adults with higher eco-nomic status [26]. These findings of previous studies seem to show that since older adults with higher economic sta-tus have more interest in health care, they are more likely to enroll in private health insurance plans [15]. The results of this study also showed that higher subjective economic status is associated with higher participation rates in the NHSP in the normal cognitive function group and this finding indicates that economic status is linked to enroll-ment in private medical insurance. In particular, economic status was found to be the most influential factor for par-ticipation in the NHSP in the normal cognitive function group. These results show the need to create social envi-ronments which can help to improve economically vulner-able older adults' awareness of self-management of their health and encourage them to receive health screening re-gardless of their economic status.
On the other hand, depression and social activity partic-ipation were found to be important factors influencing the participation rate of the NHSP in all the groups of older adults regardless of the cognitive function level. Consis-tent with previous studies [16,17], the participation rate of the NHSP in older adults was found to be positively influ-enced by participation in social activities rather than the relationship with the family such as the presence of the spouse or co-residence with children [16,17]. A possible explanation of these results is that independent older adults with a high level of social engagement and social activity participation tend to perform health promoting behaviors more actively. In addition, unlike in the past, co-residence with their children was found to have little influence on the participation rate of the NHSP. In partic-ular, it is remarkable that living with children in the same household was found to be associated with lower partic-ipation rates of NHSP among older adults with suspected dementia. This finding is similar to the results of previous studies which reported that preventive health behaviors such as participation in the flu vaccination program or the cancer screening program were found to be lower among older adults living with children in the same household [27,28]. Therefore, it is necessary to strengthen the social support system for older adults within the local commun-ity rather than the family support system in order to in-crease the participation rate of the NHSP and thereby lead old adults to do self-care and prevent diseases. Older adults with mild cognitive impairment as well as older adults with normal cognitive function may need addi-tional support for NHSP. In particular, the participation rate of the NHSP has been reported to be higher when pro-motional activities are carried out face-to-face with sub-jects [6]. Therefore, it would be effective to conduct pro-motion and other activities for health screening through institutions such as senior welfare centers and senior citi-zen centers which older adults generally use. In addition, for older adults with a low level of social activity partic-ipation, home visiting healthcare service personnel should directly provide them with information on the NHSP and encourage them to receive health screenings. In addition, there is also a need to strengthen the support for older adults with physical decline through a mobile health screening program.
In the present study, older adults with depression showed a lower participation rate of the NHSP, and de-pression was identified as a major influencing factor in all the groups of older adults divided according to cognitive function levels. According to statistical data, 21.1% of the elderly population have depressive symptoms and the
percentage of people with depressive symptoms increases with age [3]. Depression has been reported to have neg-ative effects on physical health and lead to a decline in so-cial activities in older adults, so there is a need to imple-ment active interventions to prevent and manage depres-sion [29].
In this study, the participation rate of the NHSP was sig-nificantly lower in older adults with mild cognitive im-pairment and those with suspected dementia than those with normal cognitive function. As the elderly population increases, the percentage of older adults with cognitive de-cline is increasing [11]. The prevalence of chronic diseases has been found to be higher among older adults with mild cognitive impairment or among those with dementia than among those with normal cognitive function [13,30]. These findings highlight the necessity of increasing the partic-ipation rate of the NHSP as one of the measures for disease prevention and management. Therefore, if customized in-terventions are offered based on the findings on the influ-encing factors for the participation in the NHSP in older adults with cognitive function decline such as older adults with mild cognitive impairment and those with suspected dementia, they are expected to increase the participation rate of the NHSP and ultimately contribute to the improve-ment of the level of health status in older adults.
This study has some limitations which need to be point-ed out. First of all, this study regardpoint-ed the participation rate of primary health screening provided freely by the National Health Insurance Service and the Medical Aid Program as the participation rate of the NHSP. Therefore, because individuals who participate in primary health screening do not always receive secondary health check-ups and undergo subsequent treatment, care should be taken in interpreting the results of this study. Second, the results of this study showed that participation in social activities is an influencing factor for participation in the NHSP. However, the level of the quality of social activity participation was not taken into consideration, so this weakness of the study should be addressed in future studies.
CONCLUSION
These days, greater emphasis is placed on the impor-tance of preventive healthcare policies in improving the health status of the growing elderly population. Therefore, it is necessary to enhance the early detection and pre-vention of diseases by improving the participation rate of the NHSP among the elderly population. This study ana-lyzed the data from the KLoSA to investigate the
partic-ipation rate of the NHSP according to the cognitive func-tion levels among older adults and identify the factors in-fluencing the participation rate. As a result, it was found that the participation rate of the NHSP in the elderly pop-ulation did not reach the goal set in the 4th Health Plan
(2016~2020) and that the participation rate of the NHSP was lower among older adults with mild cognitive impair-ment and those with suspected deimpair-mentia than those with normal cognitive function. People with cognitive impair-ment have difficulty in managing their own health or get-ting health screenings. Therefore, it is necessary to devel-op policies to increase the screening rate among older adults with cognitive impairment. In particular, there is a need to provide social support for older adults with limi-tations of physical activity due to a decline in physical function, including those with mild cognitive impairment or dementia and those living in long-term care facilities so that these groups of older adults can also receive health screenings.
The results of this study revealed various factors affect-ing the participation rate of the NHSP accordaffect-ing to the cognitive function levels. In older adults with suspected dementia and normal older adults, female gender, low subjective economic status, and non-enrollment of private health insurance were associated with lower participation rates. In the entire group of participants, older adults with depression and those with limited social activity partic-ipation showed lower health screening rates. In addition, in old adults with dementia or suspected dementia, the participation rate was lower among older adults living in small and medium-sized cities and rural areas than in met-ropolitan cities. Therefore, differentiated approaches ac-cording to the cognitive function levels of older adults are required. In order to develop specific policies, follow-up studies should be conducted to investigate the negative ef-fects of non-participation in the NHSP on health outcomes among older adults and to identify the reasons for not re-ceiving health screenings in older adults with dementia or mild cognitive impairment.
REFERENCES
1. Oh YH. Health status and policy for the elderly [Internet]. Sejong: Korea Institute for Health and Social Affairs. 2013 [cited 2018 December 01]. Available from:
http://repository.kihasa.re.kr/handle/201002/10981 2. Prince MJ, Wu F, Guo Y, Gutierrez Robledo LM, O'Donnell M,
Sullivan R, et al. The burden of disease in older people and im-plications for health policy and practice. The Lancet. 2015;385: 549-562. https://doi.org/10.1016/S0140-6736(14)61347-7
3. Ministry of Health and Welfare. 2017 elderly survey [Internet]. Sejong: Ministry of Health and Welfare. 2017 [cited 2019 July 15]. Available from:
http://www.mohw.go.kr/react/jb/sjb030301vw.jsp?PAR_ MENU_ID=03&MENU_ID=032901&CONT_SEQ=344953 4. National Health Insurance Service. 2018 Health Insurance
Statistics [Internet]. Wonju: National Health Insurance Ser-vice. 2019 [cited 2019 July 15]. Available from:
https://www.nhis.or.kr/bbs7/boards/B0074/29670?board Key=29&boardName=B0074
5. Schülein S, Taylor KJ, Schriefer D, Blettner M, Kluga SJ. Par-ticipation in preventive health check-ups among 19,351 wom-en in Germany. Prevwom-entive Medicine Reports. 2017;6:23-26. https://doi.org/10.1016/j.pmedr.2017.01.011
6. Cook EJ, Sharp C, Randhawa G, Guppy A, Gangotra R, Cox J. Who uses NHS health checks? Investigating the impact of eth-nicity and gender and method of invitation on uptake of NHS health checks. International Journal for Equity in Health. 2016; 15:13. https://doi.org/10.1186/s12939-016-0303-2
7. Yoon S, Jun DB, Park S. The effect of general health checks on healthcare utilization: Accounting for self-selection bias. Jour-nal of Royal Statistical Society, series A. 2019;1-34.
https://doi.org/10.1111/rssa.12482
8. Dryden R, Williams B, McCowan C, Themessl-Huber M. What do we know about who does and does not attend general health checks? Findings from a narrative scoping review. BMC Public Health. 2012;12:723.
https://doi.org/10.1186/1471-2458-12-723
9. National Health Insurance Service. 2017 The National Health Screening Statistical Yearbook [Internet]. Wonju: National Health Insurance Service. 2017 [cited 2019 June 17]. Available from:
http://www.nhis.or.kr/menu/boardRetriveMenuSet.xx?me nuId=F3328
10. Kang SY, Lee JA, Kim YS. Knowledge and attitude of health care providers for Korean National Health Examination. Kore-an Journal of Health Promotion. 2017;17(4):252-258.
https://doi.org/10.15384/kjhp.2017.17.4.252
11. Central Dementia Center. 2018. 2016 National Dementia Epi-demiology Survey [Internet]. Seongnam: Central Dementia Center. 2018 [cited 2019 July 23]. Available from:
https://www.nid.or.kr/notification/data_view.aspx?board_ seq=76
12. Ritchie K, Ancelin ML, Beaino E, Portet F, Brickman AM, Dartigues JF, et al. Retrospective identification and character-ization of mild cognitive impairment from a prospective pop-ulation cohort. The American Journal of Geriatric Psychiatry. 2010;18(8):692-700.
https://doi.org/10.1097/jgp.0b013e3181df4897
13. Lee YK, Sung MR, Lee DY. Comorbidity and health habits of
Seoul city elders with dementia. Journal of Korean Academy of Nursing. 2011;41(3):411-422.
https://doi.org/10.4040/jkan.2011.41.3.411
14. Yeo JY, Jeong HS. Determinants of health screening and its effects on health behaviors. Health Policy and Management. 2012;22(1):49-64.
https://doi.org/10.4332/KJHPA.2012.22.1.049
15. Jung YK. Determinants of general health check-up among older adults in Korea. Crisisonomy. 2018;14(1):135-148. https://.doi.org/10.14251/crisisonomy.2018.14.1.135 16. Stafford M, von Wagner C, Perman S, Taylor J, Kuh D,
She-ringham J. Social connectedness and engagement in preven-tive health services: An analysis of data from a prospecpreven-tive co-hort study. The Lancet Public Health. 2018;3(9):e438-e446. https://doi.org/10.1016/S2468-2667(18)30141-5
17. Vozikaki M, Linardakis M, Philalithis A. Preventive health services utilization in relation to social isolation in older adults. Journal of Public Health. 2017;25(5):545-556.
https://doi.org/10.1007/s10389-017-0815-2
18. Park KY, An HG. Factors influencing the health examination in middle-aged men in Korea: Using data from the 6th Korea National Health and Nutrition Examination Survey (KNHANES VI-1), 2013. Journal of the Korean Data Analysis Society. 2016; 18(2):1035-1049.
19. Irwin M, Artin KH, Oxman MN. Screening for depression in the older adult: Criterion validity of the 10-item Center for Epidemiological Studies Depression Scale (CES-D). Archives of Internal Medicine. 1999;159(15):1701-1704.
https://doi.org/10.1001/archinte.159.15.1701
20. Chung SD, Koo MJ. Factors influencing depression: A compar-ison among babyboomers, the pre-elderly, and the elderly. Jounal of Welfare for the Aged. 2011;52:305-324.
21. Korea Employment Information Service. User's guide of 2019 Korean Longitudinal Study of Ageing (KLoSA). Eumseong: Korea Employment Information Service. 2019 [cited 2019 April 2]. Available from:
https://survey.keis.or.kr/klosa/klosaguide/List.jsp
22. Ministry of Health and Welfare. The 4th Health plan 2020 ('16~ '20). Sejong: Ministry of Health and Welfare. 2016 [cited 2019 June 11]. Available from:
http://www.mohw.go.kr/react/jb/sjb030301vw.jsp?PAR_M ENU_ID=03&MENU_ID=0319&CONT_SEQ=330479&page=1 23. Gidlow C, Ellis N, Randall J, Cowap L, Smith G, Iqbal Z, et al.
Method of invitation and geographical proximity as predic-tors of NHS Health Check uptake. Journal of Public Health. 2015;37(2):195-201.
https://doi.org/10.1093/pubmed/fdu092
24. Oh S, Ko Y. Activities of daily living, depression, and self-rated health and related factors in Korean elderly: Focused on socio-economic status and family support. Journal of Korean
Acad-emy of Community Health Nursing. 2015;26(2):140-149. https://doi.org/10.12799/jkachn.2015.26.2.140
25. Sommers BD, Blendon RJ, Orav J, Epstein AM. Changes in uti-lization and health among low-income adults after medicaid expansion or expanded private insurance. JAMA Internal Me-dicine. 2016;176(10):1501-1509.
https://doi.org/10.1001/jamainternmed.2016.4419
26. Lee YC, Im BH, Park YH. The determinants and comparison of health behavior and health service by private medical insu-rance on national health-nutrition survey. Journal of the Korea Contents Association. 2010;10(12):190-204.
27. Schmitz H, Wubker A. What determines influenza vaccination take up of elderly Europeans? Health Economics. 2011;20(11): 1281-1297. https://doi.org/10.1002/hec.1672
28. Kim JG. The impact of family type on health behavior of eld-erly people. Korean Journal of Gerontological Social Welfare. 2011;51:35-55.
29. Shin SH, Jang KS, Choi O. Study of the successful aging of the elderly women in rural area. Journal of Health Informatics and Statistics. 2019;44(2):198-205.
https://doi.org/10.21032/jhis.2019.44.2.198
30. Park M, Sung MR, Kim SK, Lee DY. Comparison of demo-graphic characteristics, comorbidity, and health habits of older adults with mild cognitive impairment and older adults with normal cognitive function. Journal of Korean Academy of Nursing. 2014;44(4):351-360.