2220
Copyright ⓒ The Korean Institute of Electrical Engineers
Dynamic Equivalent Battery as a Metric to Evaluate the Demand
Response Performance of an EV Fleet
Sung Hyun Yoon*, Young Gyu Jin
†and Yong Tae Yoon*
Abstract – Electric vehicles (EVs) are significant resources for demand response (DR). Thus, it is essential for EV aggregators to quantitatively evaluate their capability for DR. In this paper, a concept of dynamic equivalent battery (DEB) is proposed as a metric for evaluating the DR performance using EVs. The DEB is the available virtual battery for DR. The capacity of DEB is determined from stochastic calculation while satisfying the charging requirements of each EV, and it varies also with time. Further, a new indicator based on the DEB and time-varying electricity prices, named as value of DEB (VoDEB), is introduced to quantify the value of DEB coupled with the electricity prices. The effectiveness of the DEB and the VoDEB as metrics for the DR performance of EVs is verified with the simulations, where the difference of charging cost reduction between direct charging and optimized bidding methods is used to express the DR performance. The simulation results show that the proposed metrics accord well with the DR performance of an EV fleet. Thus, an EV aggregator may utilize the proposed concepts of DEB and VoDEB for designing an incentive scheme to EV users, who participate in a DR program.
Keywords: Electric vehicle, Demand response, Equivalent battery, DR metric, EV aggregator.
1. Introduction
The number of electric vehicles (EVs) has steadily increased due to their environment-friendly characteristics. Additionally, EVs can support the grid operation through demand response (DR) using their batteries [1]. There are two factors why EVs are suitable for DR. One is the internal battery can be charged fast and controllable under some constraint such as the rated power/capacity limits. Thus, the aggregate of EVs can function as an energy storage system (ESS) in the power system operation. The other factor is the usage pattern of EVs. EVs are parked most of the time and only less than 5% of the time is used to drive [2]. Thus, there are plenty of time to perform as DR resources, particularly overnight.
The capacity of an individual EV battery is so small that EVs are aggregated by so-called an EV aggregator to be used as DR resources in an electricity market [3,4]. According to market rules, an EV aggregator schedules its DR resources and submits the bids in the day ahead (DA) and/or real time (RT) markets to maximize its profit. In other words, the EV aggregator mainly focus on how to delicately and practically optimize its bids for the maximum profit.
There are studies on the various aspects of EVs, such as the charging behavior of EV users and the method for
using EVs as the DR resources. In [4], the energy storage system (ESS) is used for developing an energy bidding strategy to mitigate the EV behavioral uncertainty. In [5], EVs are utilized for DA bidding and RT frequency control combined with flexible load control techniques and uninterruptible power supply. A simple implementation using dynamic programming for the frequency regulation is proposed in [6]. The results of field tests for several ancillary services are demonstrated in [7]. In [9], the DA bid and the penalty due to the deviation from the bid are considered using the stochastic programming. In [10], the stochastic programming is utilized considering the EV staying pattern.
Although such methods in the previous studies are useful for the operational strategy of an EV aggregator, it is very difficult to recognize how much benefit can be achieved using EVs as the DR resource, and when the EVs are available to participate a DR program. In addition, the resulting strategies from the literatures can be applied only to a given circumstance, but they do not give any insight about the available DR resource from an EV fleet.
Therefore, in this paper, we propose a new concept for representing a large number of small batteries of an EV fleet as a single equivalent battery, which can be used as a metric to quantitatively evaluate the DR performance of the EVs. The number of EVs arriving/departing and charging/discharging at a certain time changes with time. Each EV has different initial state-of-charge (SOC) when it starts charging, and it has different target SOC and staying time before departure. Thus, the capacity of the equivalent battery is time-varying or dynamic, and it is named as † Corresponding Author: Dept. of Electrical Engineering, Jeju
National University, Korea. (ygjin93@jejunu.ac.kr)
* Dept. of Electrical and Computer Engineering, Seoul National University, Korea. ({ysh154947, ytyoon}@ snu.ac.kr)
dynamic equivalent battery (DEB) in this paper. The capacity of DEB can be determined from the probabilistic calculation assuming that the probability density functions (pdfs) of the parameters related the EVs are known. This method for determining the capacity of DEB is also presented. Using the concept of the DEB, an EV aggregator can easily grasp the available DR resources from EVs over time. Further, the DR performance is dependent on the electricity prices. Therefore, we also introduced the concept of value of DEB (VoDEB) to quantify the value of DEB coupled with the electricity prices. The VoDEB is closely related to the DR performance, that is, the reduction of charging cost of EVs.
The remainder of this paper is organized as follows. In Section 2, the process of modeling the DEB is described. A method for determining the capacity of DEB is presented in Section 3. The concept of the VoDEB is explained also in Section 3. In Section 4, the effectiveness of the DEB and the VoDEB as metrics for the DR performance of EVs is verified with the simulations. In the simulations, 100 scenarios for 369 EVs are generated from the pdfs. Concluding remarks are given in Section 5.
2. Modeling of Dynamic Equivalent Battery
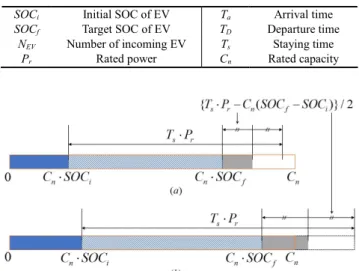
In the model of the DEB, it is assumed that the behavioral information of EVs are available. The parameters of the usage information of EVs considered in this study are listed in Table 1. The initial SOC, target SOC, arrival time, departure time and number of incoming EVs are random variables with its own pdf. In the following expression, the index k for the k-th EV will be added to the parameters in Table 1. Thus, for example, Ta k, indicatesthe arrival time of the k-th EV.
Fig. 1 shows the method for determining the capacity of
equivalent battery of an EV. If the EV has enough time to charge it to the target SOC, the rest of time before departure can be used for DR. In other words, the charging pattern can be changed to implement the DR function once the constraint on the target SOC is met at the departure time.
Basically, as shown in Fig. 1(a), the total available charging quantity is T Ps× r , and the required charging quantity is C SOCn( f -SOCi). The extra charging capacity for DR is the difference of these two quantities. The same amount of the charging (or discharging) quantity is necessary to recover the SOC to the target value on departure. Therefore, the equivalent charging capacity for
k’s EV, which is represented with gray region, is defined as
half of the extra virtual capacity during the stay:
, , , , , ( ) 2 ( ) s k r n f k i k eq ch k T P C SOC SOC C = × - - ×d t (1)
where d(t) is a duration function to indicate the time duration when the EV is connected to grid, given by
(
)
, , ,
( ) ( a k) ( a k s k)
d t =u t T- -u t- T +T . (2)
However, the EV cannot be charged beyond its physical capacity. Thus, when the staying time is so long that the capacity in (1) exceeds the physical capacity, as shown in Fig. 1(b), the upper limit of the equivalent capacity for charging, Ceq ch k, , , can be expressed as
(
)
( )
, , 1 , .
eq ch k n f k
C =C -SOC ×d t (3)
The equivalent capacity for discharging is defined in a similar manner. In the basic case, the equivalent capacity for discharging is the same as (1). However, the EV cannot discharge beyond the SOC of zero. Thus, when the capacity in (1) exceeds the initial SOC, the equivalent capacity for discharging, Ceq dch k, , , should be differently
calculated as
, , ( , ) ( ).
eq dch k n i k
C =C SOC ×d t (4)
It should be noted from Eqs. (1), (3), and (4) that the equivalent battery has a symmetric capacity for charging and discharging like a normal battery system in a basic case; but it has the asymmetric capacity in some cases depending on the staying time and the initial/target SOCs.
3. Characteristics of Dynamic Equivalent Battery
3.1 Calculation of dynamic equivalent battery
Eqs. (3) and (4) in Section 2 are given to describe the concept of the equivalent capacity for charging and Table 1. Usage information of EVs for modeling the DEB
SOCi Initial SOC of EV Ta Arrival time
SOCf Target SOC of EV TD Departure time
NEV Number of incoming EV Ts Staying time
Pr Rated power Cn Rated capacity
Fig. 1. Capacity of equivalent battery for an EV: (a) basic case; (b) when the staying time is relatively long
discharging, respectively. Thus, the stochastic properties, such as probability distribution of the initial SOC, target SOC, staying time, and the number of incoming EVs, should be considered to calculate the specific capacity of DEB. Taking from the parameters in [9-11], the truncated Gaussian distribution (TGD) is used to model initial SOC, target SOC and staying time. The number of incoming EV is modeled as the Poisson distribution. Table 2 lists a set of pdfs used in the calculation of the capacity.
Given the pdfs, the capacity of DEB for an EV is calculated by jointly integrating the pdfs considering the conditions described in Section 2. Then, the capacity of DEB for charging (Ceq ch k, , ) and for discharging (Ceq dch k, , )
for an EV are expressed as
, eq ch C =
( )
( )
, 2 0 1 2 1 1 2 0, ( ) , ( ) ( ) ( ) ( ) ( ) s r n f i f i s f i s s r n f i n f n f f i s f i s s r n f i n f T P C SOC SOC d t f f f dSOC dSOC dT T P C SOC SOC if C SOCd t C SOC f f f dSOC dSOC dT
T P C SOC SOC if C SOC otherwise × ì ï ï ï ï ï ï ï í ï ï ï ï ï ï - -× × × × × - -£ < -× - × × × × - -> -ï î
òòò
òòò
(5) , eq dch C =( )
( )
, 2 0 1 2 ( ) ( ) ( ) ( ) , 2 0 ) , ( ) ( s r n f i f i s f i s s r n f i n f n i f i s f i s s r n f i n i T P C SOC SOC d t f f f dSOC dSOC dT T P C SOC SOC if C SOCd t C SOC f f f dSOC dSOC dT
T P C SOC SOC if C SOC otherwise × - -× × × × × - -£ < ì ï ï ï ï ï ïï í -× × × × × - -> ï ï ï ï ï ï ïî
òòò
òòò
(6)Finally, the capacity of DEB of the whole EVs (Ceq ch, , ,
eq dch
C , and Ceq) can be determined by summing the capacity for each EV as
, , , eq ch eq ch k k C =
å
C , eq dch, eq dch k, , k C =å
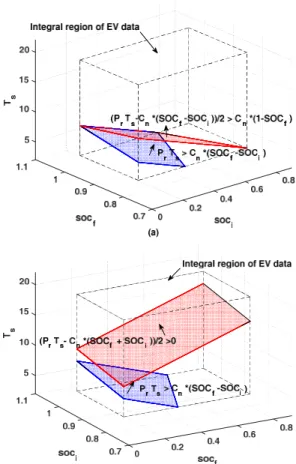
C (7) , , eq eq ch eq dch C =C +C . (8)Fig. 2. Integral area of equivalent capacity: (a) charging case; (b) discharging case
Fig. 2(a) and Fig. 2(b) shows the integration area for the capacity of DEB for charging and discharging in (5) and (6), respectively. Since the values of the variable are limited, the whole integration area is given as a cuboid. In the case of charging, the first value of Eq. (5) corresponds to the region between the blue and the red planes. Specifically, if there is enough time for DR while fulfilling the charging requirements and not exceeding the physical capacity of 100% SOC, all the remaining time can be utilized as the DR capacity in this intermediate region. However, the initial SOC is high and/or the staying time is long, there is much capacity for DR and the physical capacity of 100% SOC limits the equivalent capacity for charging. Then, the second value of Eq. (5) is aggregated as the capacity of DEB. The third value of zero in (5) indicates the case where it is short of time for meeting the target SOC due to the, e.g., short staying time. The same reasoning is applied to the capacity of DEB for discharging in (6) and Fig. 2(b).
3.2 Value of DEB coupled with electricity prices
A price-based DR program is conducted by buying electricity at a low price and selling it at a high price. The EV aggregator performs the same operation. Consequently, the DR performance depends on the time-varying Table 2. Probability density functions for calculating the
capacity of DEB i SOC SOCf EV N (t) Ts 2 N(m si, i) ; , ( , , ) i i i f xm s a b 2 N(mf,sf) ; , ( , , ) f f f f xm s c d Poisson(l( )t ) ( )
(
;)
N f xl t 2 N(m ss, s) ; , ( , , ) s s s f xm s e felectricity prices. In other words, even the ESSs with the same capacity result in the different values of cost reduction for different electricity prices.
The value of the DEB in terms of DR is coupled with the electricity prices. It is obvious that the DEB at the time of high price is more valuable than that at the time low price. Thus, we further introduce the concept of value of DEB (VoDEB) based on both the capacity of DEB and the time-varying prices. The VoDEB is calculated by summing the DEB multiplied by the relative magnitude of the price, which is expressed as Value of DEB(VoDEB) eq ( t ( t)) / s t C r min r r =
å
× - (9) s t t r =å
r (10)where rt is the electricity price, and rs is the sum of t
r for normalizing the price. Since the benefit from DR is closely related the relative price difference, the VoDEB can be used as a metric to evaluate the DR performance of EVs together with the DEB.
4. Simulation results
To verify the effectiveness of the DEB and VoDEB as metrics for DR performance, simulations are performed for an EV fleet with an average 369 EVs. The DR performance is measured by the difference of the charging cost of direct charging and optimized charging methods for 100 randomly generated scenarios. For the direct charging method, charging operation starts at arrival and ends as soon as the target SOC is satisfied. For the optimized charging, the charging schedule of individual EV is adjusted to minimize the charging cost. This optimization problem is explained in detail in the appendix. Then, the DR performance is calculated as
DR performance
Direct charging cost optimized charging cost Direct charging cost
-= . (11)
The specific parameters of the probability distributions are given in Table 3, and the numbers of incoming EVs for 24 hours from noon today (12h) to noon of the next day (35h) are listed in Table 4. In Table 3, the pdf of the initial SOC is taken from in [11], of which the average is modified to magnify the amount of DR resource; the pdf of the staying time, T , is calculated as the difference s between the departure and arrival times as in Eq. (12), whose pdfs are taken from Mobilität in [10].
2 2
2 2 2 2 s
s = + = (12)
Table 3. Probability density functions and the parameters for simulations SOCi SOCf Ts 2 N(0.45, 0.25 ) ( ; 0.45, 0.25, 0.1, 0.8) I f x 2 N(0.9, 0.1 ) ( ; 0.9, 0.1, 0.8,1) f f x 2 N(12, 4 ) ( ;12, 4, 4, 20) s f x EV N (t) Pr Cn Poisson(l( ))t ; ( ( )) N f xlt 5kW 50kWh
Table 4. Average number of incoming EVs
t 12 13 14 15 16 17 18 19 20 21 22 23 ( )t l 0 0 0 0 34 46 55 59 55 46 34 22 t 24 25 26 27 28 29 30 31 32 33 34 35 ( )t l 12 6 0 0 0 0 0 0 0 0 0 0
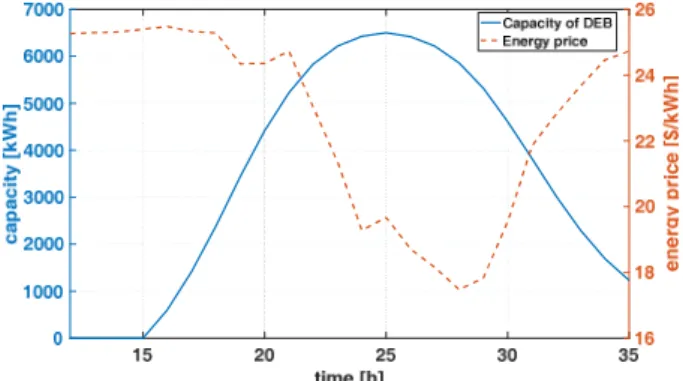
Fig. 3. Total connected EVs and average number of incoming EVs
Fig. 4. Capacity of DEB and electricity prices However, after approximating the value in (12) to
4 s
s = , the simulations are performed with various values of ss =1, 2, 3, 4, and 5 to investigate its effect on the values of DEB and VoDEB. For the pdf of the target SOC, its average and standard deviation are arbitrarily selected as 0.9 and 0.1, respectively.
Fig. 3 shows total connected EVs with the average number of incoming EVs. Electricity prices are taken from the PJM’s locational marginal prices of a typical day in
2017. The capacity of DEB for this base configuration is calculated and shown in Fig. 4.
To identify the relationship between the DR performance and the DEB, the capacity of DEB is calculated for different values of standard deviation of (ss ) of the staying time T . Fig. 5 shows the capacity of DEB with s respect to ss. As ss becomes larger, the graph spreads out and the peak becomes lower. It means that the capacity of DEB for the small ss has more capacity than the capacity of DEB for the large ss especially at midnight. Therefore, an EV aggregator can expect that the EV fleet with the small variation of staying time leads to more DR benefit, that is, greater reduction of the charging cost.
The VoDEB for the different values of ss are listed in Table 5. It shows that the VoDEB is also inversely
proportional to ss like the DEB. It can be expected from the results that the DR benefit increases as the variation of staying time of EV is small. Moreover, the results for the DR performance and the VoDEB are depicted in Fig. 6 to clarify their relationship. It can be clearly seen from Fig. 6 that the VoDEB accords very well with the DR performance, which verifies the usefulness of the VoDEB as a quantitative metric for EVs as DR resources.
To further verify the effectiveness of the VoDEB as a metric, the same capacity of DEB is applied to the simulations with the five cases of different prices. Case 1 is the base case with the same electricity price as Fig. 4; in Case 2 and Case 3, the price is increased and decreased from the base case by 5% for all the time instants, respectively; in Case 4 and Case 5, the price is gradually increased to 10% and decreased to –10% from the base case, respectively. The five cases of the price are shown in Fig. 7.
The simulation results are listed in Table 6. In Case 2 and Case 3, the DR performance and the VoDEB are equal to the results of Case 1. This is because the charging schedule from the optimal bidding method selected is determined based on the relative difference of the prices in different time, such that the increase or decrease of the price by the same amount does not change the optimal charging schedule. This result is another evidence of the usefulness of VoDEB because it does not change in Cases 1, 2, and 3.
On the contrary, the DR performance and the VoDEB are different in Case 4 and Case 5 compared with Case 1. To Table 5. DR performance and VoDEB for different
distributions of staying time s
s 1 2 3 4 5
Direct charging cost ($) 200.4 197.8 198.0 195.7 193.2 Optimized charging cost
($) 166.3 165.4 167.5 167.0 165.9 DR performance (%) 17.03 16.37 15.38 14.63 14.14 VoDEB 573 552 525 504 490
Fig. 5. Capacity of DEB according to standard deviation of staying time (Ts)
Fig. 6. Relationship between VoDEB and DR performance
Table 6. DR performance and VoDEB for five case of different electricity prices
Case 1 2 3 4 5
Direct charging cost
($) 199.5 209.4 189.5 214.6 184.4 Optimized charging cost
($) 167.0 175.4 158.7 179.1 154.5 DR performance
(%) 16.27 16.27 16.27 16.51 16.20
VoDEB 552 552 552 576 526
investigate the correlation between the VoDEB and the DR performance more closely, the relative prices to the base case are depicted in Fig. 8, and the relative values of DR performance and VoDEB and listed in Table 7. The increase in Case 4 and decrease in Case 5 of the DR performance can be reflected as the increase and decrease of the VoDEB. Thus, it can be clearly seen that the VoDEB follows the tendency of the DR performance. In other words, although the change of VoDEB is not exactly equal to the change of the DR performance in the view of absolute value, the VoDEB approximately reflects the DR performance.
Based on these results, it can be concluded that the DEB and VoDEB are useful metrics to evaluate the DR performance of an EV fleet because the capacity of DEB is large when many EVs are available for DR and the VoDEB is high when the DR benefit from EVs is high given the electricity prices. Therefore, an EV aggregator can evaluate its DR resources without complex optimization process but with simple calculation. Moreover, the information from DEB and VoDEB is easy to understand. Thus, an EV aggregator may utilize the proposed concepts of DEB and VoDEB for maximizing its profit and for designing an incentive scheme to EV users, who participate in a DR program.
5. Conclusion
In this paper, the concepts of dynamic equivalent battery
(DEB) and the value of DEB (VoDEB) are proposed as metrics to quantitatively represent the DR performance of EVs. The capacity of DEB is calculated using the probability distributions of the behavioral information of EVs. The simulation results verified the effectiveness of DEB and VoDEB as metrics related to DR.
The proposed concepts of DEB and VoDEB are easy to recognize the aggregate DR resource from EV, and very useful for an EV aggregator to develop its own DR program for EVs. Thus, further researches are necessary to develop a method for designing a DR program maximizing its profit and/or minimizing the charging cost based on these concepts. It may also be interesting to design a campaign for EV users to shape the desirable charging pattern in the view of DEB and VoDEB.
Appendix
The optimized charging is derived by solving the following mixed integer optimization problem.
(
)
(
)
(
)
min , , * r* t t k x t k -y t k P råå
(A-1) s.t.(
)
(
)
SOC t, k =SOC t-1,k r(
(
1,)
(
1,)
)
n P x t k y t k C + - - -(A-2)(
)
0£SOC t k, £1 (A-3)(
,)
(
,)
1 x t k +y t k £ (A-4)(
)
(
)
* ( , ) (, ) * ( ) ( ) departure r n f i t arriavl P x t k y t k C SOC k SOC k = - ³-å
(A-5) where(
,)
x t k = binary variable for k’th EV charging status
(
,)
y t k = binary variable for k’th EV discharging status
Eq. (A-2) expresses the change of SOC due to the charging and discharging operations; Eq. (A-3) is the constraint on the upper and lower limits of SOC; Eq. (A-4) describes the condition that an EV cannot be charged and discharged at the same time; Eq. (A-5) requires that the target SOC of the EV should be satisfied at the time of departure.
Acknowledgements
This work was supported by the research grant of Jeju National University in 2017.
Table 7. Relative values of VoDEB and DR performance compared with the base case (Case 1)
Case 1 2 3 4 5
VoDEB / VoDEB (Case 1) 100 100 100 101.43 99.58 DR performance/
DR performance (Case 1) 100 100 100 104.29 95.32
Fig. 8. rt- min
( )
rt ) /rs of five cases of different electricity pricesReferences
[1] J. C. Mukherjee and A. Gupta, “A Review of Charge Scheduling of Electric Vehicles in Smart Grid,” IEEE
Systems Journal, vol. 9, no. 4, pp. 1541-1553, 2015.
[2] Tefft, B.C, “American Driving Survey: 2015-2016,”
AAA Foundation for Traffic Safety, Washington, D.C.
Jan. 2018.
[3] E. Sortomme and M. A. El-Sharkawi, “Optimal Charging Strategies for Unidirectional Vehicle-to-Grid,” IEEE Trans. Smart Grid, vol. 2, no. 1, pp. 131-138, 2011.
[4] C. Jin, J. Tang and P. Ghosh, “Optimizing Electric Vehicle Charging With Energy Storage in the Elec-tricity Market,” IEEE Trans on Smart Grid, vol. 4, no. 1, pp. 311-320, 2013.
[5] S. Li, M. Brocanelli, W. Zhang and X. Wang, “Integrated Power Management of Data Centers and Electric Vehicles for Energy and Regulation Market Participation,” IEEE Trans. Smart Grid, vol. 5, no. 5, pp. 2283-2294, 2014.
[6] S. Han, S. Han and K. Sezaki, “Development of an Optimal Vehicle-to-Grid Aggregator for Frequency Regulation,” IEEE Trans. Smart Grid, vol. 1, no. 1, pp. 65-72, 2010.
[7] K. Knezović, S. Martinenas, P. B. Andersen, A. Zecchino and M. Marinelli, “Enhancing the Role of Electric Vehicles in the Power Grid: Field Validation of Multiple Ancillary Services,” IEEE Trans. on
Transportation Electrification, vol. 3, no. 1, pp.
201-209, 2017.
[8] S. I. Vagropoulos and A. G. Bakirtzis, “Optimal Bidding Strategy for Electric Vehicle Aggregators in Electricity Markets,” IEEE Trans. Power Systems, vol. 28, no. 4, pp. 4031-4041, Nov. 2013.
[9] P. Sánchez-Martín, S. Lumbreras and A. Alberdi-Alén, “Stochastic Programming Applied to EV Charging Points for Energy and Reserve Service Markets,”
IEEE Trans. Power Systems, vol. 31, no. 1, pp.
198-205, Jan. 2016.
[10] D. Dallinger, D. Krampe and M. Wietschel, “Vehicle-to-Grid Regulation Reserves Based on a Dynamic Simulation of Mobility Behavior,” IEEE Trans on
Smart Grid, vol. 2, no. 2, pp. 302-313, June 2011.
[11] R. J. Bessa, M. A. Matos, F. J. Soares and J. A. P. Lopes, “Optimized Bidding of a EV Aggregation Agent in the Electricity Market,” IEEE Trans. Smart
Grid, vol. 3, no. 1, pp. 443-452, March 2012.
Sung Hyun Yoon He received B.S degree in electrical engineering from Seoul National University in 2013. Currently, he is working on Doctor’s course in SNU. His research interests are EV aggregator operation, grid segmentation and HVDC.
Young Gyu Jin He received B.S., M.S., and Ph.D. degrees in Electrical Engineering from Seoul National University in 1999, 2001, and 2014, respectively. He had worked for KT Inc. during 2002-2010. Currently, he is an Assistant Professor in the Department of Electrical Engineering at Jeju National University, Korea. His research interests include optimal operation of smart grid/microgrid, renewable energy, and evolution of electrical grid.
Yong Tae Yoon He received his B.S., M. Eng., and Ph.D. degrees from M.I.T., USA in 1995, 1997, and 2001, respectively. Currently, he is a Pro-fessor in the Department of Electrical and Computer Engineering at Seoul National University, Korea. His research interests include power systems economics, smart grid/microgrid, and decentralized operation.