Taurine ameliorates the progression
of diabetic nephropathy
in type 2 diabetic rat model
Jang Hyun Koh
The Graduate School
Yonsei University
Department of Medicine
Taurine ameliorates the progression
of diabetic nephropathy
in type 2 diabetic rat model
Directed by Professor Choon Hee Chung
A Doctoral Dissertation
submitted to the Department of Medicine,
the Graduate School of Yonsei University
in partial fulfillment of the requirements
for the degree of Doctor of Philosophy
Jang Hyun Koh
July 2012
This certifies that the dissertation
of Jang Hyun Koh is approved.
[signature]_________________________________
Thesis Supervisor: Choon Hee Chung
[signature]_________________________________
Thesis Committee Member: Soon Hee Jung
[signature]_________________________________
Thesis Committee Member: Byung Pil Cho
[signature]_________________________________
Thesis Committee Member: Young Goo Shin
[signature]_________________________________
Thesis Committee Member: Byung Il Yeh
The Graduate School
Yonsei University
ACKNOWLEDGEMENTS
I would like to express my very sincere gratitude to my supervisor, Professor Choon Hee Chung who encouraged and supported me in completing this thesis all the way to the end and always for giving me visions. Although it took a lot of years to complete this thesis, it is worthy of spending time and energy because it was a great experience in my life and it provided me better attitude towards the research and future medicine. I would also like to express my thanks to doctoral dissertation committee, Professor Byung Il Yeh, Young Goo Shin, Byung Pil Cho and Soon Hee Jung who showed me great interests. I want to acknowledge Mi Ri Hyun and Professor Eun Young Lee at Soonchunhyang University College of Medicine who gave support for in vitro experiment, and I want to acknowledge research assistant Eun Soo Lee who dedicated very long time to help out the experiments, and also to the Yonsei University Wonju College of Medicine Department of Endocrinology for the support. Also I want to thank Professor Young Woo Vahc who is my uplifting class teacher. Finally, I want to thank my parents and my family, wife and daughter and a son for the support and care. Without all the supports from the above it would be impossible to finish my graduate work.
Celebrating the day, July 1, 2012 Written by Jang Hyun Koh
i
CONTENTS
LIST OF TABLES --- iii
LIST OF FIGURES --- iv
ABSTRACT --- vi
I. INTRODUCTION --- 1
II. MATERIALS AND METHODS --- 4
2.1. Reagents --- 4
2.2. Treatment of rats --- 4
2.3. Measurements of fasting blood glucose, plasma insulin and adiponectin --- 5
2.4. Determination of urinary malondialdehyde (MDA) levels --- 6
2.5. Histological examination of kidney --- 6
2.6. Immunohistochemical staining for VEGF --- 7
2.7. Expression of nephrin and VEGF mRNA in kidney --- 8
2.8. Immunoblot analysis in kidney --- 8
2.9. Cell cultures --- 9
2.10. Reactive oxygen species (ROS) production in podocytes --- 9
ii
III. RESULTS --- 11
3.1. Clinical and biochemical characteristics of experimental rats ---11
3.2. Histological characteristics of renal glomeruli --- 15
3.3. Electron microscopic morphometry of glomerular basement membrane -- 18
3.4. The mRNA expression of nephrin in kidney --- 21
3.5. The VEGF expression in kidney --- 23
3.6. Antioxidant effect of taurine on kidney --- 26
3.7. The effects of taurine on nephrin, VEGF, and ROS in the podocytes --- 28
IV. DISCUSSION --- 32
V. CONCLUSION --- 35
REFERENCES --- 36
iii
LIST OF TABLES
Table 1. Changes of body weight in experimental groups --- 12
Table 2. Biochemical characteristics in experimental groups --- 13
iv
LIST OF FIGURES
Figure 1. Changes of 24 hours urine albumin and ACR in experimental rats on the
basis of the duration of diabetes mellitus --- 14
Figure 2. Morphological characteristics of renal glomeruli in four groups --- 17
Figure 3. Changes of the numbers of open slit pore. --- 19
Figure 4. Changes of the thickness of GBM among four groups --- 20
Figure 5. The difference of nephrin mRNA expression in kidney --- 22
Figure 6. The VEGF expression in glomerular area --- 24
Figure 7. Effects of taurine on the expression of VEGF in glomeruli by real-time PCR and western blot immunostaining --- 25
v
Figure 9. Nephrin mRNA expression by real-time PCR in podocytes --- 29
Figure 10. Renal VEGF mRNA expression by real-time PCR in podocytes --- 30
vi
ABSTRACT
Taurine ameliorates the progression of diabetic
nephropathy in type 2 diabetic rat model
Jang Hyun Koh
Department of Medicine The Graduate School, Yonsei University
Diabetic nephropathy is the most common diabetic microvascular complication and the most common cause of end-stage renal disease. It is believed to be caused by diverse factors, and a variety of mechanisms have been suggested. The overexpression of vascular endothelial growth factor (VEGF) is known to participate in the pathogenesis of diabetic nephropathy. Taurine has some beneficial effects on diabetic nephropathy, but its mechanisms are still unknown. In the present study, the preventive effect and mechanism of taurine on diabetic nephropathy were investigated.
Taurine was administered to Otsuka-Long-Evans-Tokushima fatty (OLETF) rats during 20 weeks. Blood glucose and urine albumin creatinine ratio (ACR) were measured. Glomerular basement membrane (GBM) thickness and slit pore numbers of podocytes were measured by electron microscopy. Renal VEGF mRNA and protein
vii
synthesis were evaluated by quantitative real time-polymerase chain reaction (qRT-PCR) and western blot immunostaining. Nephrin and VEGF expression were determined in podocytes cultured with high glucose. Fasting blood glucose, twenty four hours urinary albumin and ACR were reduced, and insulin and homeostasis model assessment of beta-cell function (HOMA-β) were increased in taurine treated diabetic group compared with those in diabetic control group. In taurine treated diabetic group, GBM thickness was decreased and open slit pore numbers were increased. Taurine effectively lowered the elevated VEGF mRNA levels in diabetic group. In podocytes cultured with taurine and high glucose, reactive oxygen species (ROS) formation and VEGF mRNA expression were reversed to the control levels. Nephrin mRNA expressions were increased in podocytes cultured with taurine and high glucose.
These data support that taurine prevents the progression of diabetic nephropathy possibly through the recovery of nephrin and insulin secretion, and the downregulation of renal VEGF expression.
1
Taurine ameliorates the progression of diabetic
nephropathy in type 2 diabetic rat model
Jang Hyun Koh Department of Medicine
The Graduate School, Yonsei University (Directed by Professor Choon Hee Chung)
I.
INTRODUCTION
Diabetes mellitus, which may cause many complications, is becoming more and more common in the present day. Diabetic nephropathy is the first cause of end-stage renal disease and the most common microvascular complication to treat (Andersen et al. 1983, 496-501).
The mechanisms of diabetic nephropathy are variable. Many growth factors may initiate the diabetic renal complications (Flyvbjerg 2000, 1205-23). Among growth factors, vascular endothelial growth factor (VEGF) may play a part in the pathogenesis of diabetic nephropathy (Cha et al. 2000, S104-12). The expression of VEGF was delineated at first to be increased in extremely vascularized and quickly growing tumors (Kim et al. 1993, 841-4). VEGF is known to increase vascular permeability to macromolecules (Gilbert et al. 2000, 1360-7) and its expression is localized to the epithelial glomerular cells, podocytes, distal tubules and renal
2
collecting duct in the normal kidney (Cooper et al. 1999, 2229-39). VEGF is increased especially during the early stage of diabetic nephropathy (Cha et al. 2004, 183-94). The reduction of VEGF overexpression may ameliorate diabetic renal disease (Lee et al. 2004, 65-70).
One of the methods that make a diagnosis of diabetic nephropathy is the detection of proteinuria. Recent studies focused on the change of glomerular basement membrane (GBM) structure (Lemley et al. 2000, 2095-105, Tryggvason, and Wartiovaara 2001, 543-9). Nephrin is a podocyte specific protein (Ruotsalainen et al. 1999, 7962-7), and its expression is reduced in an early period of proteinuric diabetic patients (Doublier et al. 2003, 1023-30).
A variety of drugs, such as angiotensin II receptor blocker (ARB), have been developed to improve diabetic nephropathy. Taurine is one of the candidates for the treatment of diabetic nephropathy. It is composed of sulfur-containing β-amino acid and is present in many tissues of animals and human with a broad range of biological effects (Huxtable 1992, 101-63). Both plasma and platelet taurine concentrations were decreased in type 1 diabetic patients and these levels were increased to normal after oral taurine administration (Franconi et al. 1995, 1115-9). Since Trachtman et al. had reported the marked reduction of proteinuria in streptozotocin (STZ) induced diabetic rats with decreased renal lipid peroxidation by oral supplementation of taurine in 1995, the effects of taurine on diabetic nephropathy was showed through the improvement of oxidative stress (Das, and Sil 2012, Higo et al. 2008, E35-45, Wang et al. 2008, 763-71, Winiarska et al. 2009, 261-70) and the reduction of
3
TGF-βexpression (Higo et al. 2008, E35-45). Recently, a study also showed that taurine administration prevented the occurrence and development of diabetic nephropathy by decreasing blood glucose, improving lipid metabolism and glomerular basement membrane metabolism (Lin et al. 2010, S46). These effects of taurine on diabetic nephropathy have not been fully demonstrated yet and under investigation.
In this study, we investigated whether taurine could improve diabetic nephropathy and also investigated which mechanism would be associated with the effect of taurine on diabetic kidney disease.
4
II.
MATERIALS AND METHODS
2.1. Reagents
Taurine was purchased from Sigma-Aldrich Chemical Company (St. Louis, MO, USA). Losartan was kindly provided by Merck & Co., Inc. (Whitehouse station, NJ, USA).
2.2. Treatment of rats
All experiments were performed under the approval of the Institutional Animal Care and Use Committee (IACUC), Yonsei University at Wonju Campus. Ten male Long-Evans-Tokushima-Otsuka (LETO, Otsuka Pharmaceutical Co., Ltd., Tokushima, Japan) rats, a model of non diabetic control and 30 male Otsuka-Long-Evans- Tokushima-Fatty (OLETF) rats, type 2 diabetes mellitus model, were purchased from Otsuka Pharmaceutical Co., Ltd. (Tokushima, Japan). At 25 weeks of age, we classified them into four groups: normal control group, diabetic control group, taruine treated diabetic group (200 mg/kg/day), and losartan treated diabetic group (10 mg/kg/day). Animals were housed at constant temperature (20±2ºC) and humidity (50-60%) with a 12-hour light and 12-hour dark cycles. They had free access to water and 20% sucrose contained rat chow(Junsei Chemical Company Ltd., Tokyo, Japan) until 45 weeks of age. The chemicaltreated groups were received by oral gavage tube from 26 weeks to 45 weeks. At 15, 25, 35 and 45 weeks of age, the rats were checked body weight. At 25, 35 and 45 weeks of age, the rats were collected 24-hour urine with the metabolic cage to measure the urinary albumin (Exocell Nephrat II; Exocell
5
Inc., Philadelphia, PA, USA) and creatinine (Exocell The Creatinine Companion; Exocell Inc., Philadelphia, PA, USA). We calculated a urinary albumin creatinine ratio (ACR). At 45 weeks of age, all rats were anesthetized with ZoletilⓇ(Virvac Laboratories, Carros, France) by intraperitoneal injection. Blood samples were taken by cardiac puncture and collected in heparin solution containing test tube and centrifuged at 1,500 g for 10 minutes to obtain plasma. The plasma was stored at -80ºC until use. After perfusion with 0.9% saline, both kidneys were removed. One kidney was stored at -80ºC for analysis of mRNA and protein expression and the other kidney was embedded to 4% paraformaldehyde for histological examination.
2.3. Measurements of fasting blood glucose, plasma insulin and adiponectin
Twelve-hour fasting blood glucose levels were analyzed with the LifeScan SureStep (Lifescan, Burnby, Canada) in tail vein blood. Plasma glucose disposal rate (short insulin tolerance test, Kitt; %/min), which indicates the time necessary to reduce the basal glucose level by one-half, was calculated as 0.693/t1/2, where t1/2 was determined from the slope of the glycemic concentrations from 3 to 15 minutes after intravenous regular insulin injection (1U/kg). Plasma levels of insulin (Shibayagi Co., Shibukawa, Japan) and adiponection (AdipoGen Inc., Seoul, Korea) were measured using ELISA kit. Insulin resistance and beta cell function was determined by homeostasis model assessment for insulin resistance (HOMA-IR) and homeostasis model assessment of beta-cell function (HOMA-β). HOMA-IR was calculated as follows: fasting insulin (μU/mL) × fasting glucose (mM/L)/22.5. HOMA-β was calculated as follows: fasting insulin (μU/mL) × 20/fasting glucose (mM/L)–3.5.
6
2.4. Determination of urinary malondialdehyde (MDA) levels
A rapid and sensitive fluorometric HPLC method was used to measure urine MDA and it was analyzed by the NeoDin Medical Institute (Seoul, Korea). Urine samples were treated with 0.1125N PCA and 40mM 2-TBA, and were made a derivative with heat at 97 ºC for 1 hour. After that to stop the reaction, put on ice for 20 minutes. Thereafter add the methanol and 20% TCA buffer. Mix the samples and centrifuge 13,000 g for 6 minutes and transfer the supernatant to the insert vial. The fluorescence detector was set at an excitation wave length of 525 nm and emission of 560 nm. The run time was 2 minutes, and flow rate was 1 mL/min.
2.5. Histological examination of kidney
Paraffin-embedded kidney tissue was sectioned at 4-μm and stained with periodic acid-Schiff (PAS). We examined these sections with an optical microscope that was equipped with a charge coupled device camera (Pulnix, Sunnyvale, CA, USA) in order to obtain the pictures of glomeruli from the outer and middle thirds of the renal cortex. We measured glomerular areas using an image analysis system (GmbH, SIS, Minster, Germany) and calculated glomerular volume using the Weibel and Gomez formula (Lane et al., 1992): Glomerular volume (Gv) = Area1.5×1.38/1.01 (1.38: shape coefficient, 1.01: size distribution coefficient). About 30 glomeruli were observed in the kidney sections of each rat.
For the evaluation of ultra-structure in glomeruli, kidney tissue was thin-sectioned and examined under a JEOL transmission electron microscope (JEM-1200EX II, JEOL Ltd., Tokyo, Japan). Electron micrographs were taken at × 30,000 for each
7
sample. The numbers of slit pore were counted and divided the glomerular basement membrane (GBM) length (10-μm) to arrive at the linear density using an image analysis system. About 10 glomeruli were observed in the kidney sections of each rat.
2.6. Immunohistochemical staining for VEGF
4% paraformaldehyde fixed kidney tissues were embedded in paraffin. The kidney tissues were prepared with 4-μm sections and placed on a microscope slide. They were removed paraffin on 60ºC for 1 hour and dehydrated in xylene. They were graded alcohols and immersed in distilled water (PBS-T) for 5 minutes. And then they were incubated in 20 μg/mL proteinase K solution (DAKO, Glostrup, Denmark) for 15 minutes. The slides were washed with PBS-T and incubated in Ultra V block (DAKO, Glostrup, Denmark) for 5 minutes in room temperature.
The polyclonal anti-VEGF (Santa Cruz Biotechnology Inc., Santa Cruz, CA, USA) was added at an 1:100 dilution for overnight at 4ºC. The slides were washed with PBS-T and added biotinlylated secondary antibody (Santa Cruz Biotechnology Inc., Santa Cruz, CA, USA). The antibody binding was visualized using the avidin and biotinylated horseradish peroxidase reaction. To evaluate the VEGF staining, slides were observed using a light-microscope adhered to a charge-coupled camera device (Pulnix, Sunnyvale, CA, USA). We measured the optical density of stained VEGF using an image analysis system (GmbH, SIS, Minster, Germany). About 20 glomeruli were observed in the kidney sections of each rat.
8
2.7. Expression of nephrin and VEGF mRNA in kidney
Total RNA was isolated and purified from kidney cortex and concentrations were determined using micro-spectrophotometer. For cDNA synthesis, reverse transcription was performed with 1μg RNA. The cDNA was prepared using these samples as templates according to protocols provided with a commercially available QuantiTect Reverse Transcription kit (QuantiTect® reverse transcription kit; Qiagen, Hilden, Germany). For quantitative real time PCR, SYBR Green PCR master mix (Applied Biosystem, Foster City, CA, USA) was performed in an ABI PRISM 7900HT Sequence Detection System (Applied Biosystems, Foster City, CA, USA). Quantitative real time PCR was activated and cDNA denatured by a pre-incubation for 15 minutes at 95°C; the template was amplified for 35 cycles of denaturation for 15 seconds at 94°C, annealing of primers at 58°C programmed for 30 seconds, and extension at 72°C for 30 seconds.
2.8. Immunoblot analysis in kidney
To analyze the protein expression of VEGF in kidney tissue, western blot analysis was performed. Kidney cortex was homogenized by the TissueLyser II (QIAGEN GmbHm Haan, Germany) in a RIPA lysis buffer (Thermo Scientific, Rockford, IL, USA). The protein samples were heated for 5 minutes at 95°C and then electrophoresed on SDS-PAGE (10%) gels, and transferred to polyvinylidene difluoride (PVDF) membrane (Immobilon; Millipore, Bedford, MA, USA) for 2 hours at 250 mA. The membrane was blocked by 5% skim milk for 1 hour at room temperature. And rabbit anti-GAPDH (1:1000) and anti-VEGF (1:500) antibodies
9
(Santa Cruz Biotechnology Inc., Santa Cruz, CA, USA) were incubated for overnight at 4℃. The membrane washed 5 times in Tris-buffer saline/0.1% Tween 20 prior to 1 hour of probing with horseradish peroxidase-conjugated secondary antibody. The blots were detected using enhanced chemiluminescent substrate (Thermo Fisher Scientific Inc., Fremont, CA, USA).
2.9. Cell cultures
Conditionally immortalized mouse podocytes (gift of Dr. Mundel P, University of Miami, Miami, FL, USA) were cultured at 37.5°C without γ-interferon in DMEM contained 5.5 mM glucose. Differentiated podocytes were synchronized into quiescence by growing cells in serum free medium for 24 hours. The cultured podocytes were treated by high glucose media (30 mM) and high glucose media with high glucose-taurine treated podocytes (30 mM) or high glucose-losartan treated podocytes (30 mM). After 24-hour, we measured nephrin and VEGF mRNA expression.
2.10. Reactive oxygen species (ROS) production expression in podocytes
For measurement of ROS production, cultured podocytes were added dichlorofluorescein diacetae (DCF-DA) 10μM at 37.5℃ condition for 30 minutes and then analyzed the fluorescence by the fluorometer (GloMax®-Multi Jr Single Tube Multimode Reader, Promega Corporation, Madison, WI, USA).
10 2.11. Data analysis
Data are expressed as means ± SEM. Statistical analyses were conducted using SPSS version 18.0 for windows using one-way ANOVA and Tukey’s test. T-test was used for experiments with only two groups. Differences were considered significant at
11
III.
RESULTS
3.1. Clinical and biochemical characteristics of experimental rats
While the body weight of normal control group (LETO) increased continuously
until 45 weeks of age, those of three diabetic OLETF groups decreased slightly after 35 weeks of age (Table 1). Insulin level was significantly decreased in three diabetic OLETF groups compared to those in normal control group. Between the diabetic groups, the insulin was significantly higher in taurine treated diabetic group (OLETF+TA) compared to those in diabetic control group (OLETF). Fasting blood glucose level was significantly increased in diabetic control group compared to that of normal control group, and was significantly decreased in taurine treated diabetic group and losartan treated diabetic group (OLETF+LO). HOMA-β was increased in taurine treated diabetic group compared to that of diabetic control group. Adiponectin was decreased significantly in diabetic control group compared to those in normal control group, and was increased in taurine treated OLETF group but not statistically significant (Table 2). Twenty-four hours urine albumin level and ACR were significantly decreased in taurine treated diabetic group compared to those in diabetic control group at 35 weeks but they were not statistically different at 45 weeks (Fig. 1).
12
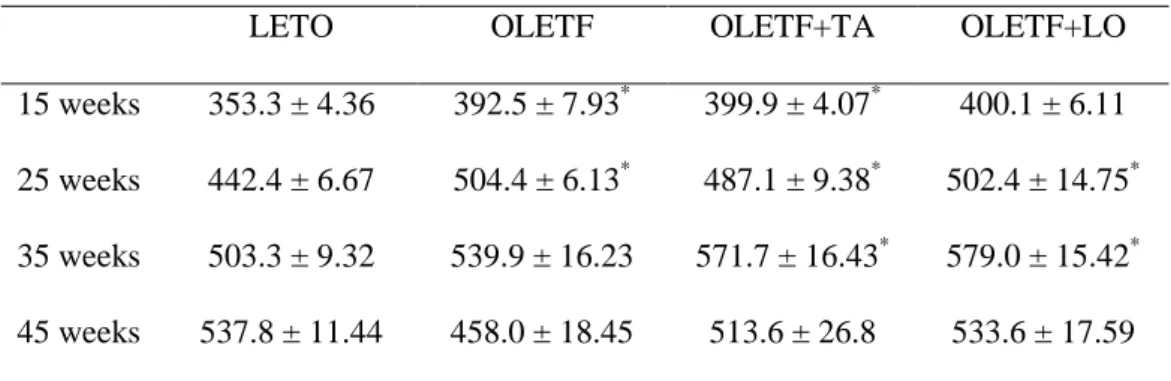
Table 1. Changes of body weight in experimental groups
LETO OLETF OLETF+TA OLETF+LO
15 weeks 353.3 ± 4.36 392.5 ± 7.93* 399.9 ± 4.07* 400.1 ± 6.11 25 weeks 442.4 ± 6.67 504.4 ± 6.13* 487.1 ± 9.38* 502.4 ± 14.75* 35 weeks 503.3 ± 9.32 539.9 ± 16.23 571.7 ± 16.43* 579.0 ± 15.42* 45 weeks 537.8 ± 11.44 458.0 ± 18.45 513.6 ± 26.8 533.6 ± 17.59
Data are expressed as mean ± SEM.; LETO, normal control group; OLETF, diabetic control group; OLETF+LO, losartan treated diabetic group; OLETF+TA, taurine treated diabetic group. *, p < 0.05 compared with LETO.
13
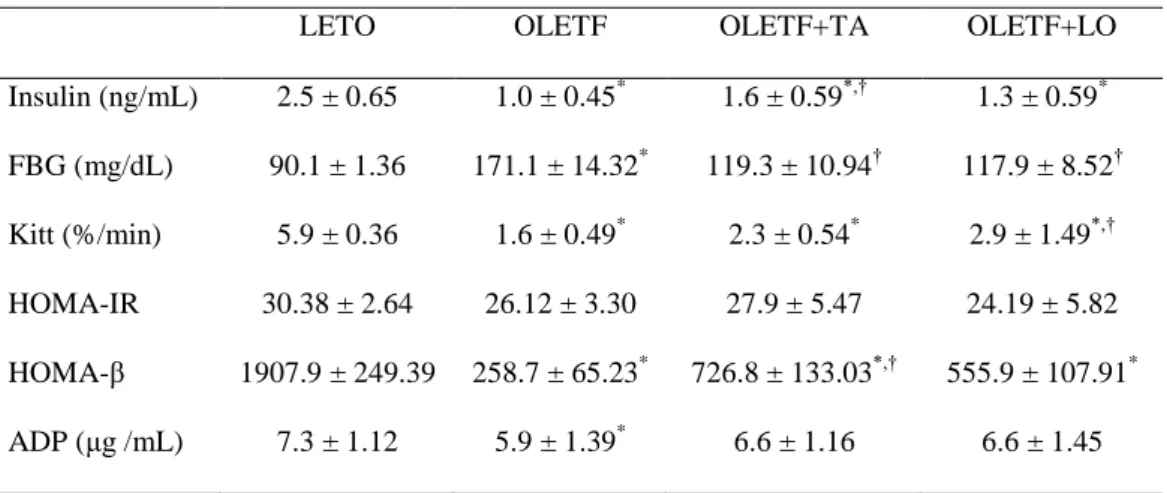
Table 2. Biochemical characteristics in experimental groups
LETO OLETF OLETF+TA OLETF+LO Insulin (ng/mL) 2.5 ± 0.65 1.0 ± 0.45* 1.6 ± 0.59*,† 1.3 ± 0.59* FBG (mg/dL) 90.1 ± 1.36 171.1 ± 14.32* 119.3 ± 10.94† 117.9 ± 8.52† Kitt (%/min) 5.9 ± 0.36 1.6 ± 0.49* 2.3 ± 0.54* 2.9 ± 1.49*,† HOMA-IR 30.38 ± 2.64 26.12 ± 3.30 27.9 ± 5.47 24.19 ± 5.82 HOMA-β 1907.9 ± 249.39 258.7 ± 65.23* 726.8 ± 133.03*,† 555.9 ± 107.91* ADP (μg /mL) 7.3 ± 1.12 5.9 ± 1.39* 6.6 ± 1.16 6.6 ± 1.45
Data are expressed as mean ± SEM.; ADP, adiponectin; FBG, fasting blood glucose; HOMA-β, homeostasis model assessment for beta-cell function; HOMA-IR, homeostasis model assessment for insulin resistance; Kitt, short insulin tolerance test; LETO, normal control group; OLETF, diabetic control group; OLETF+LO, losartan treated diabetic group; OLETF+TA, taurine treated diabetic group. *, p < 0.05 compared with LETO; †, p < 0.05 compared with OLETF.
14
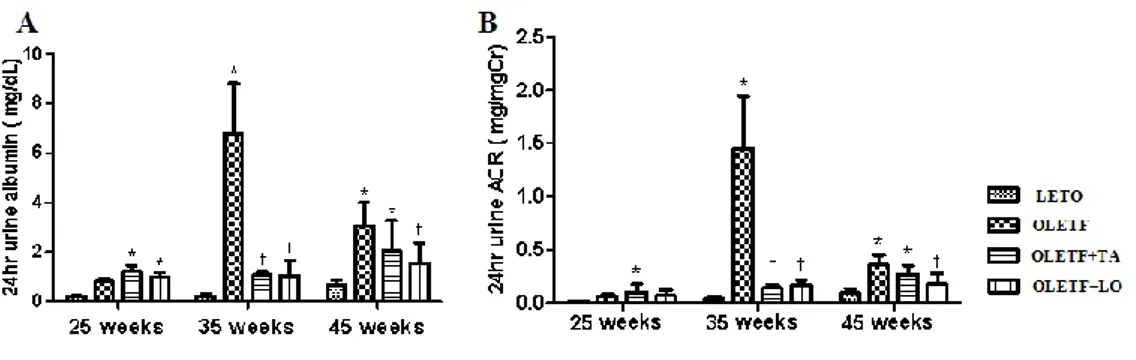
Figure 1. Changes of 24 hours urine albumin and ACR in experimental rats on the basis of the duration of diabetes mellitus. (A) Urinary albumin level was significantly lower at 35 weeks of age in taurine treated diabetic group rather than diabetic control group. (B) Twenty-four hours urine ACR was also significantly decreased in taurine treated diabetic group compared to diabetic control group. ACR, albumin creatinine ratio; LETO, normal control group; OLETF, diabetic control group; OLETF+LO, losartan treated diabetic group; OLETF+TA, taurine treated diabetic group. Data are expressed as mean ± SEM. *, p < 0.05 compared with LETO; †, p < 0.05 compared with OLETF.
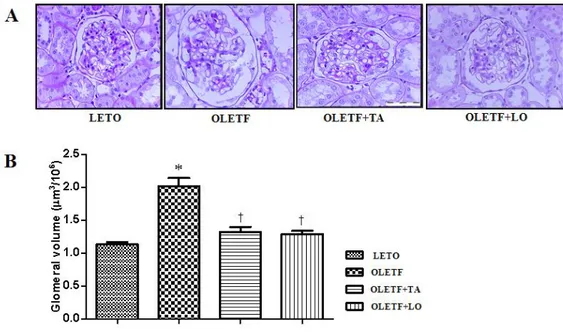
15 3.2. Histological characteristics of renal glomeruli
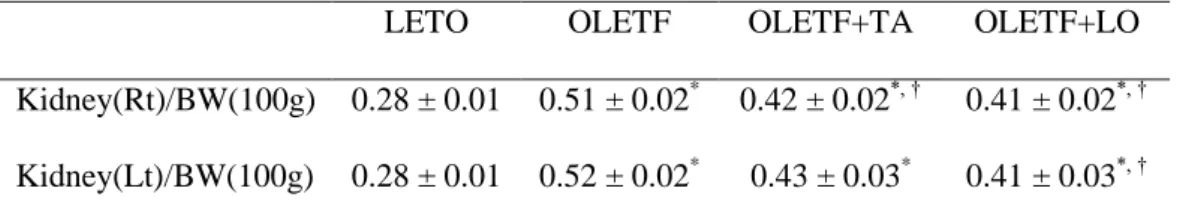
The weight of right kidney was increased in diabetic groups and significantly lighter in taurine treated diabetic group rather than that of diabetic control group. But there was no statistical significance left kidney between diabetic control and taurine treated diabetic group (Table 3). The calculated glomerular volume of diabetic control group was significantly increased compared to those in normal control group. In taurine treated diabetic group, the volume of renal glomerulus was significantly diminished compared to those in diabetic control group (Fig. 2).
16
Table 3. Weight of kidney tissues per body weight in experimental groups
LETO OLETF OLETF+TA OLETF+LO
Kidney(Rt)/BW(100g) 0.28 ± 0.01 0.51 ± 0.02* 0.42 ± 0.02*, † 0.41 ± 0.02*, † Kidney(Lt)/BW(100g) 0.28 ± 0.01 0.52 ± 0.02* 0.43 ± 0.03* 0.41 ± 0.03*, †
Data are expressed as mean ± SEM. BW, body weight; LETO, normal control group; OLETF, diabetic control group; OLETF+LO, losartan treated diabetic group OLETF+TA, taurine treated diabetic group. *, p < 0.05 compared with LETO; †, p < 0.05 compared with OLETF.
17
Figure 2. Morphological characteristics of renal glomeruli in four groups. (A) Cross sectioned glomerlui were stained with periodic acid-Schiff (× 400). (B) The volume of renal glomeruli in taurine treated diabetic group was decreased compared to those in diabetic control group. LETO, normal control group; OLETF, diabetic control group; OLETF+LO, losartan treated diabetic group; OLETF+TA, taurine treated diabetic group. Data are expressed as mean ± SEM. *, p < 0.05 compared with LETO; †, p < 0.05 compared with OLETF.
18
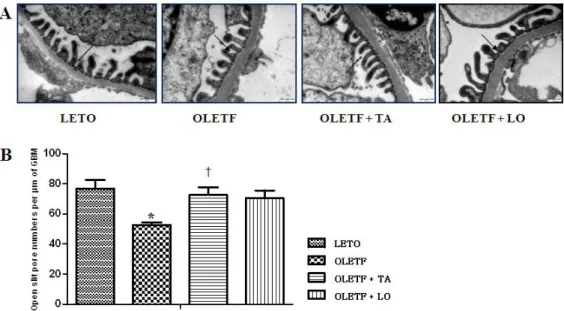
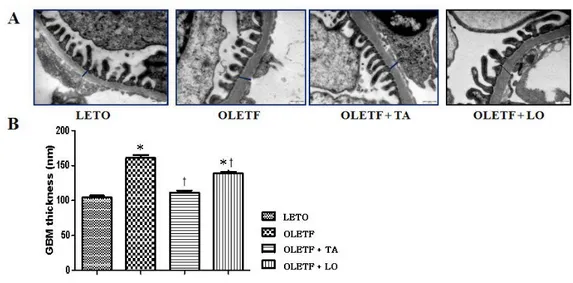
3.3. Electron microscopic morphometry of glomerular basement membrane
The numbers of open slit pore were decreased in diabetic control group compared to those in normal control group and significantly increased in taurine treated diabetic group compared to those in diabetic control group (Fig.3). The thickness of GBM was increased in diabetic control group than that of normal control group and significantly decreased in taurine treated diabetic group approaching to that of normal control group (Fig.4).
19
Figure 3. Changes of the numbers of open slit pore. (A) Electron microscopy shows open slit pores (arrows) between the foot processes of the podocytes (× 30000). (B) The numbers of open slit pore were significantly increased following taurine treatment compared to those of diabetic control group. GBM, glomerular basement membrane; LETO, normal control group; OLETF, diabetic control group; OLETF+LO, losartan treated diabetic group; OLETF+TA, taurine treated diabetic group. Data are expressed as mean ± SEM. *, p < 0.05 compared with LETO; †, p < 0.05 compared with OLETF.
20
Figure 4. Changes of the thickness of GBM among four groups. (A) Electron microscopy showed a GBM thickness. Bars indicate a thickness of GBM (× 30000). (B) Taurine treated diabetic group was significantly decreased GBM thickness against diabetic control group. GBM, glomerular basement membrane; LETO, normal control group; OLETF, diabetic control group; OLETF+LO, losartan treated diabetic group; OLETF+TA, taurine treated diabetic group. Data are expressed as mean ± SEM. *, p < 0.05 compared with LETO; †, p < 0.05 compared with OLETF.
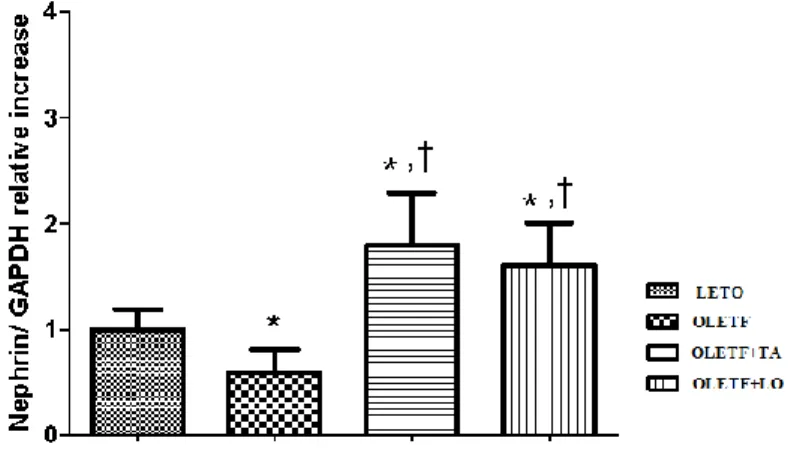
21 3.4. The mRNA expression of nephrin in kidney
Nephrin was decreased significantly in diabetic control group compared to that of normal control group. In taurine treated diabetic group, nephrin was increased significantly compared to those in both diabetic and normal control groups (Fig.5).
22
Figure 5. The difference of nephrin mRNA expression in kidney. Nephrin mRNA expression was increased in taurine treatment. LETO, normal control group; OLETF, diabetic control group; OLETF+LO, losartan treated diabetic group; OLETF+TA, taurine treated diabetic group. Data are expressed as mean ± SEM. *, p < 0.05 compared with LETO; †, p < 0.05 compared with OLETF.
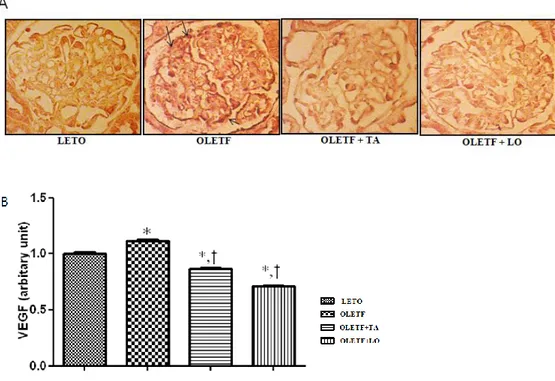
23 3.5. The VEGF expression in kidney
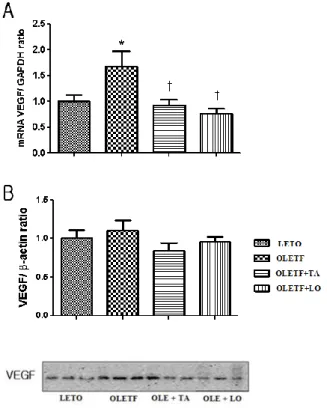
The optical densities of VEGF expression were significantly reduced in taurine treated diabetic group compared to those of diabetic control group (Fig.6). The renal VEGF mRNA expression by quantitative RT-PCR was decreased significantly in taurine treated diabetic group compared to those of diabetic control group. The renal VEGF expression by western blot immunostaining was decreased in taurine and losartan treated diabetic group but there was no statistical difference (Fig.7).
24
Figure 6. The VEGF expression in glomerular area. (A) Glomerular VEGF immunohistochemistry (arrows) in each group (× 400). (B) Optical densities of VEGF in glomeruli were decreased significantly in taurine treated diabetic group against diabetic control group. LETO, normal control group; OLETF, diabetic control group; OLETF+LO, losartan treated diabetic group; OLETF+TA, taurine treated diabetic group; VEGF, vascular endothelial growth factor. Data are expressed as mean ± SEM. *
25
Figure 7. Effects of taurine on the expression of VEGF in glomeruli by real-time PCR and western blot immunostaining. (A) Renal VEGF mRNA expression by real-time PCR was significantly decreased in taurine treated diabetic group against that of diabetic control group. (B) In taurine treated diabetic group, renal VEGF expression by western blot immunostaining was decreased compared to that of diabetic control group but there was no statistical difference. LETO, normal control group; OLETF, diabetic control group; OLETF+LO, losartan treated diabetic group; OLETF+TA, taurine treated diabetic group; VEGF, vascular endothelial growth factor. Data are expressed as mean ± SEM. *, p < 0.05 compared with LETO; †, p < 0.05 compared with OLETF.
26 3.6. Antioxidant effect of taurine on kidney
To determine the oxidative stress, we examined MDA levels in 24 hours collected urine at 45 weeks of age. MDA in diabetic control group was increased compared to that of normal control group. MDA was lower in taurine treated diabetic group than that of diabetic group, but there was no statistical significance (Fig. 8).
27
Figure 8. Changes of 24 hours urinary MDA levels at 45 weeks of age. In diabetic control group, MDA was increased compared to normal control group. MDA was decreased in taurine treatment compared to that of diabetic control group. But there was no statistical significance. MDA, malondialdehyde; LETO, normal control group; OLETF, diabetic control group; OLETF+LO, losartan treated diabetic group; OLETF+TA, taurine treated diabetic group. Data are expressed as mean ± SEM. *, p < 0.05 compared with LETO; †, p < 0.05 compared with OLETF.
28
3.7. The effects of taurine on nephrin, VEGF, and ROS in the podocytes
Nephrin mRNA expression was decreased in podocytes treated with high glucose (HG) compared to those treated with normal glucose (NG). It was recovered to the control level after taurine treatment (Fig. 9). VEGF mRNA expression was significantly decreased in taurine treated high glucose group (Fig.10). Also ROS formation was significantly decreased after taurine treatment (Fig.11).
29
Figure 9. Nephrin mRNA expression by real-time PCR in podocytes. In taurine treated high glucose group, nephrin expression was increased compared to that of high glucose group. HG, high glucose; HG+LO, losartan treated high glucose; HG+TA, taurine treated high glucose; NG, normal glucose. Data are expressed as mean ± SEM. *, p < 0.05 compared with LETO; †, p < 0.05 compared with OLETF.
30
Figure 10. Renal VEGF mRNA expression by real-time PCR in podocytes. VEGF mRNA expression was significantly decreased in taurine treated HG compared to that of HG. HG, high glucose; HG+LO, losartan treated high glucose; HG+TA, taurine treated high glucose; NG, normal glucose. Data are expressed as mean ± SEM. *, p < 0.05 compared with LETO; †, p < 0.05 compared with OLETF.
31
Figure 11. Changes of ROS formation in podocytes among four groups. Taurine treated high glucose group decreased significantly ROS production. HG, high glucose; HG+LO, losartan treated high glucose; HG+TA, taurine treated high glucose; NG, normal glucose; ROS, reactive oxygen species. Data are expressed as mean ± SEM. *, p < 0.05 compared with LETO; †, p < 0.05 compared with OLETF.
32
IV.
DISCUSSION
Since Huxtable had compiled the physiological actions of taurine in 1992, many
studies of taurine were reported (Franconi et al. 1995, 1115-9, Trachtman, Lu, and Sturman 1993, 1209-1216). Taurine is one of the endogenous antioxidants in the plasma and is also known to be localized in the medullary regions of the kidney (Huxtable 1992, 101-63, Trachtman, Lu, and Sturman 1993, 1209-1216). In diabetic nephropathy, taurine treatment reduced proteinuria and albuminuria (Das, and Sil 2012, Higo et al. 2008, E35-45, Lin et al. 2010, S46, Trachtman et al. 1995, F429-38, Winiarska et al. 2009, 261-70). This treatment prevented glomerular hypertrophy (Das, and Sil 2012, Trachtman et al. 1995, F429-38, Wang et al. 2008, 763-71), mesangial extracellular matrix expansion (Higo et al. 2008, E35-45) and hypertrophy in renal tubular epithelial cells (Huang et al. 2008, 220-6). Our data showed that taurine treated diabetic group decreased ACR and also ameliorated the glomerular volume, the thickness of GBM and the numbers of open slit core compared to diabetic control group. One of the pathogenesis for diabetic nephropathy is increased oxidative stress (Brownlee 2001, 813-20, Ha, and Kim 1999, 147-51, Suzuki et al. 1999, 822-32). Several studies reported that the prevention of diabetic renal disease after taurine treatment was associated with decreased ROS formation (Das, and Sil 2012, Higo et al. 2008, E35-45, Trachtman et al. 1995, F429-38, Wang et al. 2008, 763-71, Winiarska et al. 2009, 261-70). In our data, urinary MDA level was lower in taurine treated diabetic group than diabetic control group. But there was no statistical significance. In podocytes, ROS formation was decreased significantly in taurine treated diabetic group compared to diabetic control group.
33
The diabetes control and complications trial (DCCT) and some clinical studies demonstrated that the lowering of high blood glucose level prevents the development and progression of diabetic renal disease ("The effect of intensive treatment of diabetes on the development and progression of long-term complications in insulin-dependent diabetes mellitus. The Diabetes Control and Complications Trial Research Group" 1993, 977-86, "Intensive blood-glucose control with sulphonylureas or insulin compared with conventional treatment and risk of complications in patients with type 2 diabetes (UKPDS 33). UK Prospective Diabetes Study (UKPDS) Group" 1998, 837-53). Fasting blood glucose level was decreased significantly in taurine treated diabetic group compared to diabetic control group. It may be associated with the increment of HOMA- β in taurine treatment. Several studies have reported the effect of blood glucose for taurine. Taurine treatment could diminish the rate of renal gluconeogenesis – in other words, promote the transformation from glucose to glycogen (Goodman, and Shihabi 1990, 1-9, Lin et al. 2010, S46, Winiarska et al. 2009, 261-70).
Nephrin is a podocyte specific protein (Ruotsalainen et al. 1999, 7962-7) and its reduction is related to increased glomerular hyperpermeability in diabetic nephropathy (Kelly et al. 2002, 1327-32). The diminished nephrin expression and altered nephrin localization were showed in the patients with nephropathy with both type 1 and type 2 diabetes (Doublier et al. 2003, 1023-30). The nephrin gene expression is different according to glomerular size (Kim et al. 2007, 2303-10). Change of nephrin expression is associated with the extent of proteinuria in diabetic nephropathy (Langham et al. 2002, 1572-6). Our data showed that nephrin mRNA
34
expression was increased significantly in taurine treated high glucose group compared to high glucose group. This result implies that taurine may prevent glomerular hyperpermeability in diabetic renal disease. Nephrin expression is closely related to VEGF expression because VEGF signaling is essential for the formation and maintenance of a functional glomerular filtration barrier (Bertuccio 2011, 718609, Eremina, Baelde, and Quaggin 2007, p32-7).
VEGF is a major controller of angiogenesis and vascular permeability (Carmeliet
et al. 1996, 435-9). Renal VEGF is increased especially during the early stage of diabetic renal disease and the reduction of VEGF overexpression may ameliorate diabetic renal disease (Cha et al. 2004, 183-94, Lee et al. 2004, 65-70). Although the mechanism of VEGF induced proteinuria in diabetic nephropathy is unclear, it can be explained that high vascular permeability by renal VEGF may stimulate a collagenase production and proteolytic disruption of the endothelial basement membrane (Unemori et al. 1992, 557-62). In this study, taurine treatment decreased renal VEGF mRNA in both kidney and podocytes.
This study has two limitations. First, blood pressure was not measured. Lowering arterial pressure is related to the improvement of proteinuria. Taurine supplementation may prevent hypertension (Harada et al. 2004, 132-6) so we cannot completely exclude this effect. Second, because decreased blood glucose levels may also delay the progression of diabetic nephropathy and taurine may act as a regulator of insulin secretion (L'Amoreaux et al. 2010, S11), the protective effect of taurine on diabetic nephropathy may accomplished by the glucose lowering through the improved insulin secretion in this study.
35
V.
CONCLUSION
Our findings suggest that taurine prevents the progression of diabetic nephropathy which may be provoked possibly through the recovery of nephrin and insulin secretion, and the downregulation of renal VEGF expression.
36 REFERENCES
Andersen, A. R., J. S. Christiansen, J. K. Andersen, S. Kreiner and T. Deckert. 1983. "Diabetic nephropathy in Type 1 (insulin-dependent) diabetes: an epidemiological study". Diabetologia, 25(6): 496-501.
Bertuccio, C. A. 2011. "Relevance of VEGF and nephrin expression in glomerular diseases". J Signal Transduct, 2011: 718609.
Brownlee, M. 2001. "Biochemistry and molecular cell biology of diabetic complications". Nature, 414(6865): 813-20.
Carmeliet, P., V. Ferreira, G. Breier, S. Pollefeyt, L. Kieckens, M. Gertsenstein, M. Fahrig, A. Vandenhoeck, K. Harpal, C. Eberhardt, C. Declercq, J. Pawling, L. Moons, D. Collen, W. Risau and A. Nagy. 1996. "Abnormal blood vessel development and lethality in embryos lacking a single VEGF allele". Nature, 380(6573): 435-9.
Cha, D. R., Y. S. Kang, S. Y. Han, Y. H. Jee, K. H. Han, J. Y. Han, Y. S. Kim and N. H. Kim. 2004. "Vascular endothelial growth factor is increased during early stage of diabetic nephropathy in type II diabetic rats". J Endocrinol, 183(1): 183-94.
Cha, D. R., N. H. Kim, J. W. Yoon, S. K. Jo, W. Y. Cho, H. K. Kim and N. H. Won. 2000. "Role of vascular endothelial growth factor in diabetic nephropathy". Kidney
37
Cooper, M. E., D. Vranes, S. Youssef, S. A. Stacker, A. J. Cox, B. Rizkalla, D. J. Casley, L. A. Bach, D. J. Kelly and R. E. Gilbert. 1999. "Increased renal expression of vascular endothelial growth factor (VEGF) and its receptor VEGFR-2 in experimental diabetes". Diabetes, 48(11): 2229-39.
Das, J. and P. C. Sil. 2012. "Taurine ameliorates alloxan-induced diabetic renal injury, oxidative stress-related signaling pathways and apoptosis in rats". Amino Acids.
Doublier, S., G. Salvidio, E. Lupia, V. Ruotsalainen, D. Verzola, G. Deferrari and G. Camussi. 2003. "Nephrin expression is reduced in human diabetic nephropathy: evidence for a distinct role for glycated albumin and angiotensin II". Diabetes, 52(4): 1023-30.
"The effect of intensive treatment of diabetes on the development and progression of long-term complications in insulin-dependent diabetes mellitus. The Diabetes Control and Complications Trial Research Group". 1993. N Engl J Med, 329(14): 977-86.
Eremina, V., H. J. Baelde and S. E. Quaggin. 2007. "Role of the VEGF--a signaling pathway in the glomerulus: evidence for crosstalk between components of the glomerular filtration barrier". Nephron Physiol, 106(2): p32-7.
Flyvbjerg, A. 2000. "Putative pathophysiological role of growth factors and cytokines in experimental diabetic kidney disease". Diabetologia, 43(10): 1205-23.
38
Franconi, F., F. Bennardini, A. Mattana, M. Miceli, M. Ciuti, M. Mian, A. Gironi, R. Anichini and G. Seghieri. 1995. "Plasma and platelet taurine are reduced in subjects with insulin-dependent diabetes mellitus: effects of taurine supplementation". Am J
Clin Nutr, 61(5): 1115-9.
Gilbert, R. E., D. J. Kelly, A. J. Cox, J. L. Wilkinson-Berka, J. R. Rumble, T. Osicka, S. Panagiotopoulos, V. Lee, E. C. Hendrich, G. Jerums and M. E. Cooper. 2000. "Angiotensin converting enzyme inhibition reduces retinal overexpression of vascular endothelial growth factor and hyperpermeability in experimental diabetes".
Diabetologia, 43(11): 1360-7.
Goodman, H. O. and Z. K. Shihabi. 1990. "Supplemental taurine in diabetic rats: effects on plasma glucose and triglycerides". Biochem Med Metab Biol, 43(1): 1-9.
Ha, H. and K. H. Kim. 1999. "Pathogenesis of diabetic nephropathy: the role of oxidative stress and protein kinase C". Diabetes Res Clin Pract, 45(2-3): 147-51.
Harada, H., T. Tsujino, Y. Watari, H. Nonaka, N. Emoto and M. Yokoyama. 2004. "Oral taurine supplementation prevents fructose-induced hypertension in rats". Heart
Vessels, 19(3): 132-6.
Higo, S., S. Miyata, Q. Y. Jiang, R. Kitazawa, S. Kitazawa and M. Kasuga. 2008. "Taurine administration after appearance of proteinuria retards progression of diabetic nephropathy in rats". Kobe J Med Sci, 54(1): E35-45.
39
Huang, J. S., L. Y. Chuang, J. Y. Guh, Y. L. Yang and M. S. Hsu. 2008. "Effect of taurine on advanced glycation end products-induced hypertrophy in renal tubular epithelial cells". Toxicol Appl Pharmacol, 233(2): 220-6.
Huxtable, R. J. 1992. "Physiological actions of taurine". Physiol Rev, 72(1): 101-63.
"Intensive blood-glucose control with sulphonylureas or insulin compared with conventional treatment and risk of complications in patients with type 2 diabetes (UKPDS 33). UK Prospective Diabetes Study (UKPDS) Group". 1998. Lancet, 352(9131): 837-53.
Kelly, D. J., P. Aaltonen, A. J. Cox, J. R. Rumble, R. Langham, S. Panagiotopoulos, G. Jerums, H. Holthofer and R. E. Gilbert. 2002. "Expression of the slit-diaphragm protein, nephrin, in experimental diabetic nephropathy: differing effects of anti-proteinuric therapies". Nephrol Dial Transplant, 17(7): 1327-32.
Kim, J. J., J. J. Li, D. S. Jung, S. J. Kwak, D. R. Ryu, T. H. Yoo, S. H. Han, H. Y. Choi, H. J. Kim, D. S. Han and S. W. Kang. 2007. "Differential expression of nephrin according to glomerular size in early diabetic kidney disease". J Am Soc Nephrol, 18(8): 2303-10.
Kim, K. J., B. Li, J. Winer, M. Armanini, N. Gillett, H. S. Phillips and N. Ferrara. 1993. "Inhibition of vascular endothelial growth factor-induced angiogenesis suppresses tumour growth in vivo". Nature, 362(6423): 841-4.
40
L'Amoreaux, W. J., C. Cuttitta, A. Santora, J. F. Blaize, J. Tachjadi and A. El Idrissi. 2010. "Taurine regulates insulin release from pancreatic beta cell lines". J Biomed Sci, 17 Suppl 1: S11.
Langham, R. G., D. J. Kelly, A. J. Cox, N. M. Thomson, H. Holthofer, P. Zaoui, N. Pinel, D. J. Cordonnier and R. E. Gilbert. 2002. "Proteinuria and the expression of the podocyte slit diaphragm protein, nephrin, in diabetic nephropathy: effects of angiotensin converting enzyme inhibition". Diabetologia, 45(11): 1572-6.
Lee, E. Y., M. S. Shim, M. J. Kim, S. Y. Hong, Y. G. Shin and C. H. Chung. 2004. "Angiotensin II receptor blocker attenuates overexpression of vascular endothelial growth factor in diabetic podocytes". Exp Mol Med, 36(1): 65-70.
Lemley, K. V., K. Blouch, I. Abdullah, D. B. Boothroyd, P. H. Bennett, B. D. Myers and R. G. Nelson. 2000. "Glomerular permselectivity at the onset of nephropathy in type 2 diabetes mellitus". J Am Soc Nephrol, 11(11): 2095-105.
Lin, S., J. Yang, G. Wu, M. Liu, X. Luan, Q. Lv, H. Zhao and J. Hu. 2010. "Preventive effect of taurine on experimental type II diabetic nephropathy". J Biomed
Sci, 17 Suppl 1: S46.
Ruotsalainen, V., P. Ljungberg, J. Wartiovaara, U. Lenkkeri, M. Kestila, H. Jalanko, C. Holmberg and K. Tryggvason. 1999. "Nephrin is specifically located at the slit diaphragm of glomerular podocytes". Proc Natl Acad Sci U S A, 96(14): 7962-7.
41
Suzuki, D., T. Miyata, N. Saotome, K. Horie, R. Inagi, Y. Yasuda, K. Uchida, Y. Izuhara, M. Yagame, H. Sakai and K. Kurokawa. 1999. "Immunohistochemical evidence for an increased oxidative stress and carbonyl modification of proteins in diabetic glomerular lesions". J Am Soc Nephrol, 10(4): 822-32.
Trachtman, H., S. Futterweit, J. Maesaka, C. Ma, E. Valderrama, A. Fuchs, A. A. Tarectecan, P. S. Rao, J. A. Sturman, T. H. Boles and et al. 1995. "Taurine ameliorates chronic streptozocin-induced diabetic nephropathy in rats". Am J Physiol, 269(3 Pt 2): F429-38.
Trachtman, H., P. Lu and J. A. Sturman. 1993. "Immunohistochemical localization of taurine in rat renal tissue: studies in experimental disease states". Journal of
Histochemistry & Cytochemistry, 41(8): 1209-1216.
Tryggvason, K. and J. Wartiovaara. 2001. "Molecular basis of glomerular permselectivity". Curr Opin Nephrol Hypertens, 10(4): 543-9.
Unemori, E. N., N. Ferrara, E. A. Bauer and E. P. Amento. 1992. "Vascular endothelial growth factor induces interstitial collagenase expression in human endothelial cells". J Cell Physiol, 153(3): 557-62.
Wang, L., L. Zhang, Y. Yu, Y. Wang and N. Niu. 2008. "The protective effects of taurine against early renal injury in STZ-induced diabetic rats, correlated with inhibition of renal LOX-1-mediated ICAM-1 expression". Ren Fail, 30(8): 763-71.
42
Winiarska, K., K. Szymanski, P. Gorniak, M. Dudziak and J. Bryla. 2009. "Hypoglycaemic, antioxidative and nephroprotective effects of taurine in alloxan diabetic rabbits". Biochimie, 91(2): 261-70.
43
ABSTRACT IN KOREAN
제 2 형 당뇨병 쥐모델에서 타우린이
당뇨병성 신증에 미치는 효과
당뇨병성 신증은 가장 흔한 당뇨병의 미세혈관합병증이며 말기 신부전의 첫 번째 원인이다. 당뇨병성 신증의 발생기전에는 다양한 원인이 관여하며, 혈관 내피세포 성장인자 (VEGF)는 그 중 하나이다. 당뇨병성 신증의 발생을 예방하고 진행을 늦추려는 연구가 계속되어 왔으며, 타우린은 당뇨병성 신증에 좋은 효과를 나타내고 있으나 그 기전은 아직 명확하지 않다. 본 연구는 당뇨병성 신증에 대한 타우린의 효과와 그 기전이 무엇인가를 알아보고자 하였다. 제 2 형 당뇨병 쥐 모델인 Otsuka-Long-Evans-Tokushima-Fatty (OLETF) 쥐에 20 주간 타우린을 경구 투여하여 공복 혈당, 인슐린과 24 시간 소변 알부민/크레아티닌 비 등을 측정하였다. 사구체기저막의 두께와 족세포의 여과세극 수를 측정하였다. 신장 VEGF 의 발현을 측정하였고 족세포에서 VEGF 및 네프린 발현과 활성산소족을 측정하여 비교하였다.
44 타우린을 투여한 당뇨병 쥐군에서 혈당 및 24 시간 소변 알부민/크레아티닌 비가 당뇨병 대조군과 비교하여 감소하였고 인슐린 분비능은 증가하였다. 또한 사구체기저막 두께가 감소하였으며 족세포의 여과세극 수는 증가하였다. 신장조직에서 VEGF mRNA 발현은 감소하였고 네프린 mRNA 는 증가하였으며 족세포에서 네프린 mRNA 는 증가하였으며 VEGF mRNA 와 활성산소족은 감소하였다. 이러한 결과로 볼 때 타우린의 투여는 혈당강하와 신장 VEGF 및 네프린의 호전을 통해 당뇨병성 신증을 개선시키는 것으로 생각된다.