Published by Canadian Center of Science and Education
Capital Strength and Bank Profitability
Seok Weon Lee1
1 Division of International Studies, Ewha Woman’s University, 11-1 Daehyun-dong, Seodaemun-gu, Seoul, Korea
Correspondence: Seok Weon Lee, Division of International Studies, Ewha Woman’s University, 11-1 Daehyun-dong, Seodaemun-gu, Seoul, Korea. Tel: 82-2-3277-4456. E-mail: seoklee@ewha.ac.kr
Received: November 15, 2014 Accepted: December 29, 2014 Online Published: April 20, 2015 doi:10.5539/ass.v11n10p120 URL: http://dx.doi.org/10.5539/ass.v11n10p120
Abstract
The objective of this study is to examine the relation between capital strength and profitability of Korean banks. Employing a panel regression analysis for Korean banks during 2000-2008, this study finds that higher capital-ratio banks tend to manage the better factors of determining bank profitability. That is, the association between major explanatory variables and bank profitability is more significant and consistent with the general predictions of finance literature in the higher capital-ratio banks: Higher capital-ratio banks tend to relate larger asset size, higher capital ratio, and higher operating leverage to higher profits more significantly than lower capital-ratio banks. We find a similar result with respect to loan ratio, too. This indicates that higher capital-ratio banks may transform their advantageous position in capital strength more effectively and successfully into generating higher profits than lower capital-ratio banks. This result may be attributed to the various advantages higher capital-ratio banks have such as lower cost of capital, lower bankruptcy and financial distress costs, and less regulatory interference from bank regulator, etc. The policy implication that we can derive from the empirical results of this study may be the following. To improve bank profitability for banking sector’s soundness and safety, bank regulator needs to implement a discriminative regulatory policy between higher and lower capital ratio banks. That is, ignoring the degree of bank capital strength and imposing uniformed regulatory policy may not be effective in improving bank profitability.
Keywords: capital strength, banking sector, profitability, bank regulation, regulatory policy 1. Introduction
As a strong and stable banking system is critical to the healthiness and development of a nation’s economy, understanding decision making process and determinants of bank profitability is very important for both bankers themselves and for various stakeholders including investors in the banking industry, governments and bank regulators, etc. Korean banking industry experienced two financial crises in the last couple of decades and suffered severe damages to the banking sector’s profitability during these crises. To recover the banking sector’s profitability and vitalize the Korean economy, Korean government made comprehensive structural reform program in the banking industry. The main method of restructuring program was focused on strengthening the capital healthiness of the Korean banks. The banks whose capital ratios fall below the BIS (Bank of International Settlement) capital adequacy requirement of eight-percent were shut down and acquired by financially healthier banks. Knowledge of the relationship between capital adequacy and bank profitability would be a very important and interesting issue to derive policy implications not only for the bank regulator making reform program in the banking industry by controlling for bank capital adequacy, but also for maintaining the soundness and profitability of the banking industry.
The objective of this study is to examine the relation between capital strength and profitability of Korean banks. Employing a panel regression analysis for Korean banks during 2000-2008, this study finds that higher capital-ratio banks tend to manage the better factors of determining bank profitability. That is, the association between major explanatory variables and bank profitability is more significant and consistent with the general predictions of finance literature in the higher capital-ratio banks: Higher capital-ratio banks tend to relate larger asset size, higher capital ratio, and higher operating leverage to higher profits more significantly than lower capital-ratio banks. We find a similar result with respect to loan ratio, too. This indicates that higher capital-ratio banks may transform their advantageous position in capital strength more effectively and successfully into generating higher profits than lower capital-ratio banks. This result may be attributed to the various advantages
higher capital-ratio banks have such as lower cost of capital, lower bankruptcy and financial distress costs, and less regulatory interference from bank regulator, etc. The policy implication that we can derive from the empirical results of this study may be the following. To improve bank profitability for banking sector’s soundness and safety, bank regulator needs to implement a discriminative regulatory policy between higher and lower capital ratio banks. That is, ignoring the degree of bank capital strength and imposing uniformized regulatory policy may not be effective in improving bank profitability.
There are very few empirical literatures that directly examine the relationship between bank capital adequacy and profitability. Berger (1995) finds that bank capital ratio is positively related to bank profitability measured as the return on equity for the U.S. bank in the 1980s. Ben Naceur and Goaied (2008) find that Tunisian banks which hold a relatively high amount of capital tend to exhibit higher level of net-interest margin and profitability. Sufian and Habibullah (2009) also find that capitalization has a positive impact on the state-owned commercial banks’ profitability in China. Samadi (2012) finds a positive relationship between capital structure and bank profitability.
Data, estimation model and hypotheses are described in next section. Section 3 presents test results, and section 4 discusses concluding comments.
2. Data, Estimation Model and Hypotheses
Data source of empirical analysis in this study is the Statistics of Bank Management from the Korean Financial Supervisory Service. The sample of empirical analysis is composed of Korean commercial banks during 2000-2008. For this sample period, financial information variables such as total asset size, capital-to-asset ratio, loan-to-asset ratio, fixed asset ratio as well as the three measures of bank profitability; return on asset (ROA), return on equity (ROE), net interest margin (NIM) is collected for each bank.
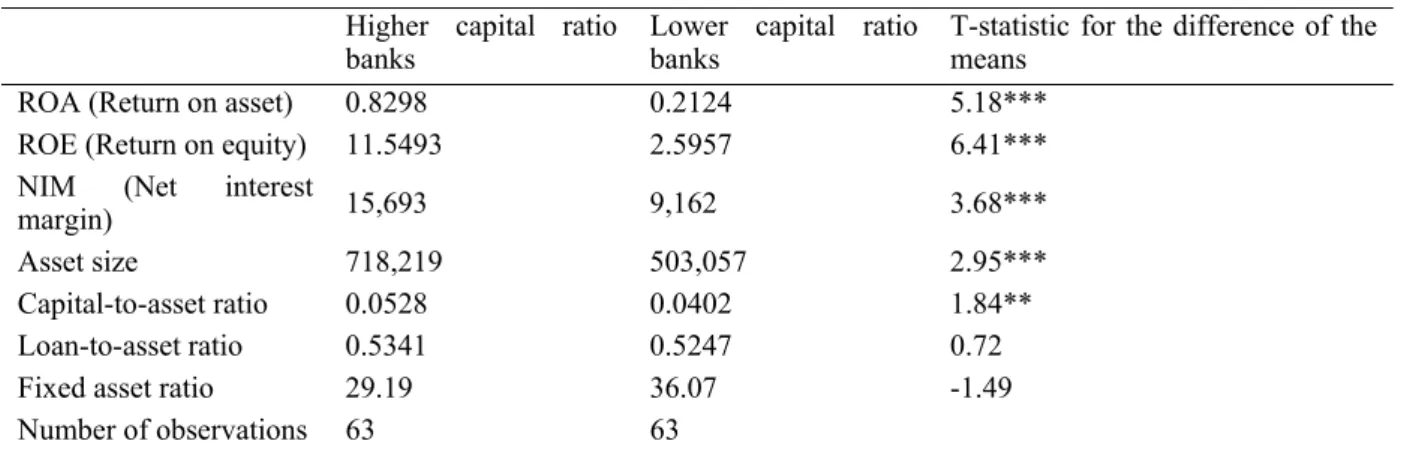
Table 1 provides t-test result for the difference of the mean value of the variables used in the study between higher capital-ratio and lower capital-ratio banks. Every year each bank is categorized into either higher capital-ratio or lower capital-ratio banks based on its capital-to-asset ratio. It is shown in the table that the two main measures of the bank profitability (ROA and ROE) are significantly higher for the higher capital-ratio banks. Another profitability measure, NIM, is also higher for the higher capital-ratio banks. Regarding the main explanatory variables for the bank profitability, Table 1 shows that higher capital-ratio banks have significantly greater asset size and capital ratio than the lower capital-ratio banks. Loan ratio is greater for the higher capital ratio banks; too, however, the difference between the two groups is not significant. Thus, these results may suggest that the larger asset size and higher capital ratio would be associated with higher bank profit. Fixed asset ratio is significantly greater for the lower capital ratio banks. The implications of these results are explained in detail in the next section, in regression analysis after controlling for the effect of the other variables except for each explanatory variable.
Table 1. T-tests for the difference of the mean value Higher capital ratio
banks Lower capital ratio banks T-statistic for the difference of the means
ROA (Return on asset) 0.8298 0.2124 5.18***
ROE (Return on equity) 11.5493 2.5957 6.41***
NIM (Net interest
margin) 15,693 9,162 3.68***
Asset size 718,219 503,057 2.95***
Capital-to-asset ratio 0.0528 0.0402 1.84**
Loan-to-asset ratio 0.5341 0.5247 0.72
Fixed asset ratio 29.19 36.07 -1.49
Number of observations 63 63
*, **, *** indicate statistical significance at the 10, 5, or 1% significance level, respectively.
To examine whether bank financial and operating characteristic variables differently affects bank profitability between higher capital-ratio and lower capital-ratio banks, we estimate the following multivariate panel regression equation for the sample of Korean commercial banks over the period 2000-2008. To examine the
difference in the profit generating mechanism between the two group banks, the regression equation is estimated for each group separately.
it
it
it it t i t i t i t i CPI NAREDUMMY FIXED LOAN CAPITAL LNASSET PROFIT , , 5 , 5 , 4 , 3 , 2 , 1 0 , (1) Following the implications of the finance literature, this paper employs three different measures for bank profitability which is the dependent variable of the regression equation. They are the return on asset (ROA), return on equity (ROE), and net interest margin (NIM) of the bank. ROA measures the return on the bank total asset, while ROE measures the return on the shareholders’ equity. NIM measures the bank average interest incomes minus average interest costs.Independent variables determining bank profit include bank asset size (LNASSET), capital-to-asset ratio (CAPITAL), loan-to-asset ratio (LOAN) and fixed asset-to-asset ratio (FIXED). Consumer price index (CPI) is included as a control for the influence of inflation rate on bank profit. A dummy variable (NAREDUMMY) as to whether a bank is regional one or nationwide one is included. NAREDUMMY takes the value of 1 if the bank is a regional bank and 0 if it is a nationwide bank.
The expected sign of the regression coefficient between the explanatory variables and bank profit is summarized below.
The expected sign on the coefficient of bank asset size with respect to profit is two-way. A positive relation between asset size and bank profit results from the effect of economies of scale. Economies of scale would be associated with lower production and management costs, and this will result in higher profit. On the other hand, generally larger asset size is associated with higher degree of bank asset diversification, which would result in lower overall risk, and therefore, lower profit. The net effect of asset size on bank profit depends on which effect is greater.
The relationship between bank capital ratio and profit is also two-way. Higher capital ratio could be effective in increasing bank profit because investors’ required return on the bank with higher capital ratio would be lower due to lower possibility of bankruptcy, which would result in lower cost of capital. On the other hand, if a lower capital ratio or higher debt ratio induces the bank managers to have moral hazard pursuing a risky strategy, a negative association between capital ratio and bank profit is possible if the higher risk taking is successful. Loan ratio is included to measure the overall bank management ability on the bank asset portfolios. This is based on the fact that loans are the largest category and one of the main sources of bank earnings. Fixed asset ratio is used as the measure of bank ability to manage its operational leverage. If the bank operational leverage is well managed, a positive relation between the fixed asset ratio and profit is expected.
3. Empirical Results
3.1 Estimation Results for ROA, ROE and NIM
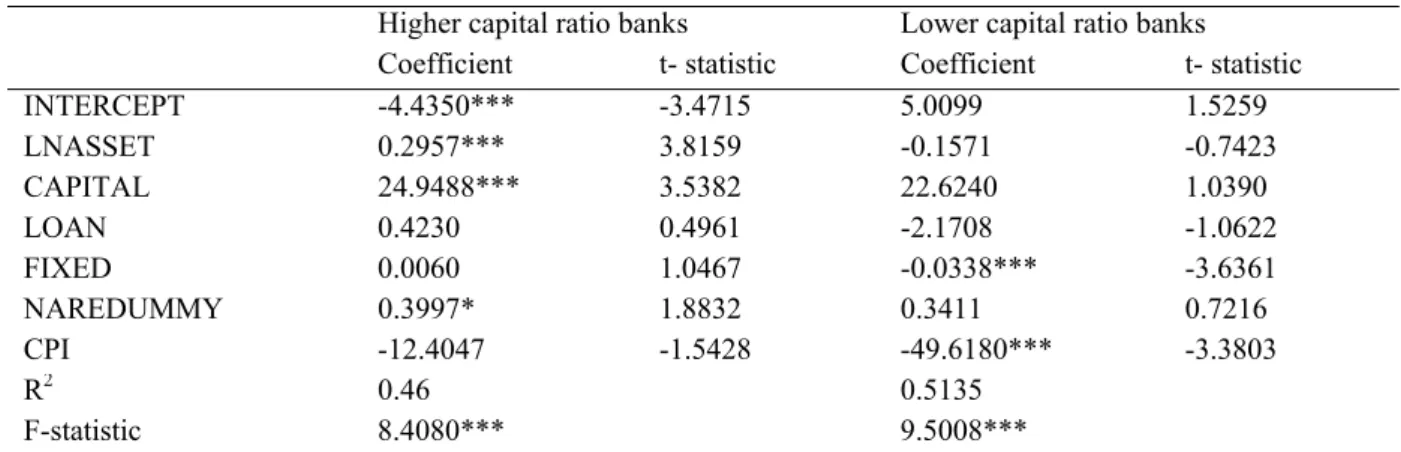
Table 2 shows the estimation result regarding the dependent variable, ROA, for the two different groups, higher capital-ratio and lower capital-ratio banks. Higher and lower capital ratios are partitioned at the median value of capital-to-asset ratio each year for all the sample banks. The same estimation is conducted with respect to ROE in Table 3.
It is presented from both tables that bank asset size is significantly positively related to both ROA and ROE for the group of higher capital-ratio banks. It is not significant for the lower capital-ratio banks. This result may indicate there is a positive effect of large asset size on achieving economies of scale and cost reduction only for higher capital-ratio banks.
Capital ratio has also a significantly positive relation with ROA only in the group of higher capital-ratio banks. It is positive with respect to ROE at the significance level of 13% for higher capital-ratio banks. But it is insignificant for both ROA and ROE in the group of lower capital-ratio banks. Thus, the positive effect of higher capital ratio on increasing bank profit through the effect of decreasing cost of capital and bankruptcy cost is observed only for higher capital-ratio banks.
Regarding the loan ratio, the coefficient is positive for both ROA and ROE for the higher capital-ratio banks, but is not significant. For the lower capital-ratio banks, it is negative. This result presents some weak evidence that higher capital-ratio banks tend to manage loan portfolios better than the lower capital-ratio banks. But it is not significant to generate higher profit.
Regarding the fixed asset ratio, the coefficient is positive for both ROA and ROE for higher capital-ratio banks. The coefficient on ROE is significant. However, it is negative for both ROA and ROE for the lower capital-ratio banks. This result implies that management of operational leverage using fixed asset to generate higher profit is better for the higher capital-ratio banks.
Table 4 shows the estimation results for the case where NIM is used as the dependent variable. It is shown that effect of larger asset size on increasing NIM is positive and significant only for higher capital-ratio banks. The other variables do not present any significant differences between the two groups with different capital ratios. Table 2. Regression results for the full sample (Bank profitability measure: ROA)
Higher capital ratio banks Lower capital ratio banks
Coefficient t- statistic Coefficient t- statistic
INTERCEPT -4.4350*** -3.4715 5.0099 1.5259 LNASSET 0.2957*** 3.8159 -0.1571 -0.7423 CAPITAL 24.9488*** 3.5382 22.6240 1.0390 LOAN 0.4230 0.4961 -2.1708 -1.0622 FIXED 0.0060 1.0467 -0.0338*** -3.6361 NAREDUMMY 0.3997* 1.8832 0.3411 0.7216 CPI -12.4047 -1.5428 -49.6180*** -3.3803 R2 0.46 0.5135 F-statistic 8.4080*** 9.5008***
*, **, *** indicate statistical significance at the 10, 5, or 1% significance level, respectively. Table 3. Regression results for the full sample (Bank profitability measure: ROE)
Higher capital ratio banks Lower capital ratio banks
Coefficient t- statistic Coefficient t- statistic
INTERCEPT -212.2028*** -3.8574 203.9824*** 2.1941 LNASSET 14.3054*** 4.1696 -7.6070 -1.2695 CAPITAL 478.1689 1.5315 285.2036 0.4626 LOAN 34.4923 0.9135 -58.8600 -1.0172 FIXED 0.4298* 1.6999 -1.1705*** -4.4518 NAREDUMMY 26.0177*** 2.7685 0.2519 0.0188 CPI -618.4984* -1.7372 -1433.26*** -3.4485 R2 0.3198 0.5181 F-statistic 4.6232** 9.6770***
*, **, *** indicate statistical significance at the 10, 5, or 1% significance level, respectively. Table 4. Regression results for the full sample (Bank profitability measure: NIM)
Higher capital ratio banks Lower capital ratio banks
Coefficient t- statistic Coefficient t- statistic
INTERCEPT -0.0360*** -3.4267 -0.0043 -0.3816 LNASSET 0.0021*** 3.3487 0.0000 0.0161 CAPITAL 0.2836*** 4.8925 0.2113*** 2.8599 LOAN 0.0228*** 3.2463 0.0240*** 3.4655 FIXED 0.0001** 1.9235 0.0001* 1.9446 NAREDUMMY 0.0100*** 5.7497 0.0039** 2.4403 CPI -0.0914 -1.3829 -0.0389 -0.7818 R2 0.6506 0.6948 F-statistic 18.3063*** 20.4852***
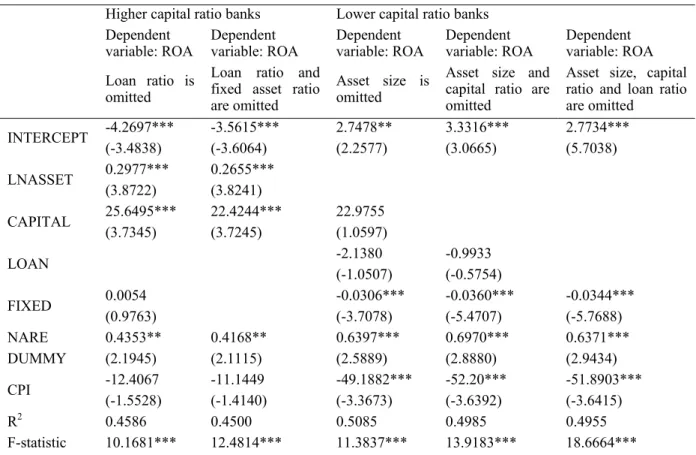
3.2 Step-wise Regression Results
Table 5 shows the estimation results for the step-wise regressions after omitting the insignificant independent variables one by one from the above regression results, and examine whether the results maintain consistency. For the sample of higher capital-ratio banks, loan ratio is omitted first, and both loan ratio and fixed asset ratio are omitted second. For the group of lower capital-ratio banks, asset size is omitted first, and then both asset size and capital ratio are omitted, finally all the three variables; asset size, capital ratio, loan ratio are omitted. It is found from the table that the regression results for the independent variables that are significant in the results of Table 3 maintain consistency. We report the results for only ROA in this table. The results for the other profitability measures are available from the authors upon request. One interesting result in Table 5 is that in all the three regressions for lower capital-ratio banks with asset size being omitted, the coefficient on NAREDUMMY turns out to be significantly positive unlike the results in Table 2. We conjecture that this results from a high correlation between asset size and NAREDUMMY for the group of lower capital-ratio banks. It is -0.45. In Table 2, we concluded that this correlation is not high to such an extent as to cause a multicollinearity problem. We checked on the estimation results for all the regressions by omitting the NAREDUMMY from the equation because it is not one of our main independent variables in this study, and we found that the regression results are nearly the same as what we reported above in Tables 2-4. These results are available from the authors upon request.
Table 5. Step-wise regression results for the full sample (Bank profitability measure: ROA) Higher capital ratio banks Lower capital ratio banks
Dependent
variable: ROA Dependent variable: ROA Dependent variable: ROA Dependent variable: ROA Dependent variable: ROA Loan ratio is
omitted
Loan ratio and fixed asset ratio are omitted
Asset size is omitted
Asset size and capital ratio are omitted
Asset size, capital ratio and loan ratio are omitted INTERCEPT -4.2697*** (-3.4838) -3.5615*** (-3.6064) 2.7478** (2.2577) 3.3316*** (3.0665) 2.7734*** (5.7038) LNASSET 0.2977*** (3.8722) 0.2655*** (3.8241) CAPITAL 25.6495*** (3.7345) 22.4244*** (3.7245) 22.9755 (1.0597) LOAN -2.1380 (-1.0507) -0.9933 (-0.5754) FIXED 0.0054 (0.9763) -0.0306*** (-3.7078) -0.0360*** (-5.4707) -0.0344*** (-5.7688) NARE DUMMY 0.4353** (2.1945) 0.4168** (2.1115) 0.6397*** (2.5889) 0.6970*** (2.8880) 0.6371*** (2.9434) CPI -12.4067 (-1.5528) -11.1449 (-1.4140) -49.1882*** (-3.3673) -52.20*** (-3.6392) -51.8903*** (-3.6415) R2 0.4586 0.4500 0.5085 0.4985 0.4955 F-statistic 10.1681*** 12.4814*** 11.3837*** 13.9183*** 18.6664*** The numbers inside parenthesis represent the T-statistic for the regression coefficient.
*, **, *** indicate statistical significance at the 10, 5, or 1% significance level, respectively. 4. Concluding Comments
The objective of this study is to examine the relation between capital strength and profitability of Korean banks. Employing a panel regression analysis for Korean banks during 2000-2008, this study finds that higher capital-ratio banks tend to manage the better factors of determining bank profitability. That is, the association between major explanatory variables and bank profitability is more significant and consistent with the general predictions of finance literature in the higher capital-ratio banks: Higher capital-ratio banks tend to relate larger
asset size, higher capital ratio, and higher operating leverage to higher profits more significantly than lower capital-ratio banks. We find a similar result with respect to loan ratio, too. This indicates that higher capital-ratio banks may transform their advantageous position in capital strength more effectively and successfully into generating higher profits than lower capital-ratio banks. This result may be attributed to the various advantages higher capital-ratio banks have such as lower cost of capital, lower bankruptcy and financial distress costs, and less regulatory interference from bank regulator, etc. The policy implication that we can derive from the empirical results of this study may be the following. To improve bank profitability for banking sector’s soundness and safety, bank regulator needs to implement a discriminative regulatory policy between higher and lower capital ratio banks. That is, ignoring the degree of bank capital strength and imposing uniformed regulatory policy may not be effective in improving bank profitability.
References
Berger, A. N. (1995). The Relationship between Capital and Earnings in Banking. Journal of Money, Credit and
Banking, 27, 432-456. http://dx.doi.org/10.2307/2077877
Hirtle, B. J., & Stiroh, K. J. (2007). The Return to Retail and the Performance of Commercial Banks. Journal of
Banking and Finance, 31, 1101-1133. http://dx.doi.org/10.1016/j.jbankfin.2006.10.004
Naceur, S. B., & Goaied, M. (2008). The Determinants of Commercial Bank Interest Margin and Profitability: Evidence from Tunisia. Frontiers in Finance and Economics, 5, 106-130.
Samadi, M. T. (2012). An Empirical Study on the Impact of Operating Risk on Structure Capital and Profitability in Iranian Banking Sector. Management Science Letters. http://dx.doi.org/10.5267/j. msl.2012.04.020 Sufian, F., & Habibullah, M. S. (2009). Bank Specific and Macroeconomic Determinants of Bank Profitability:
Empirical Evidence from China Banking Sector. Frontiers of Economics in China, 4, 274-291. http://dx.doi.org/10.1007/s11459-009-0016-1
Williams, B. (2003). Domestic and International Determinants of Bank Profits: Foreign Banks in Australia.
Journal of Banking and Finance, 27, 1185-1210. http://dx.doi.org/10.1016/S0378-4266(02)00251-0
Copyrights
Copyright for this article is retained by the author(s), with first publication rights granted to the journal.
This is an open-access article distributed under the terms and conditions of the Creative Commons Attribution license (http://creativecommons.org/licenses/by/3.0/).