저작자표시-비영리-변경금지 2.0 대한민국 이용자는 아래의 조건을 따르는 경우에 한하여 자유롭게 l 이 저작물을 복제, 배포, 전송, 전시, 공연 및 방송할 수 있습니다. 다음과 같은 조건을 따라야 합니다: l 귀하는, 이 저작물의 재이용이나 배포의 경우, 이 저작물에 적용된 이용허락조건 을 명확하게 나타내어야 합니다. l 저작권자로부터 별도의 허가를 받으면 이러한 조건들은 적용되지 않습니다. 저작권법에 따른 이용자의 권리는 위의 내용에 의하여 영향을 받지 않습니다. 이것은 이용허락규약(Legal Code)을 이해하기 쉽게 요약한 것입니다. Disclaimer 저작자표시. 귀하는 원저작자를 표시하여야 합니다. 비영리. 귀하는 이 저작물을 영리 목적으로 이용할 수 없습니다. 변경금지. 귀하는 이 저작물을 개작, 변형 또는 가공할 수 없습니다.
Doctoral Thesis in Science
A comparison of
value-related neural activity
in hippocampal CA3 and CA1 regions
Ajou University Graduate School
Neuroscience Major
A comparison of
value-related neural activity
in hippocampal CA3 and CA1 regions
Min Whan Jung, Byung Gon Kim, Advisor
I submit this thesis as the
Doctoral thesis in Neuroscience
February, 2018
Ajou University Graduate School
Neuroscience Major
The Doctoral thesis of Sung Hyun Lee in Neuroscience
is hereby approved.
Thesis Defense Committee president
Eun Joo Baik
Min Whan Jung
Byung Gon Kim
Eun Young Kim
In Ah Lee
Ajou University Graduate School
December, 22nd, 2017
본 연구의 종착점인 이 논문이 나오기까지 수많은 시간 동안 힘을 주시고 함께 하신 하나님께 먼저 감사와 영광을 돌립니다. 7년을 수일같이 여기지는 못 했지만, 어려운 가운데서도 언제 어디서나 용기를 주시니 무사히 잘 마쳤습니다. 본 연구를 위해 애쓰신 저희 사부님과 아주대 김병곤 지도교수님, 지도위원장이신 백은주 교수님, 김은영 교수님, 서울대 이인아 선생님께도 감사의 말씀을 전합니다. 저희 실험실원들, 특히 이 논문을 위해 정말 많은 수고를 해 주신 허남정, 이종원 박사님께 감사드립니다. 두 분이 아니었으면 이 논문은 못 나왔어요. 그리고 2D를 1D 로 쉽게 바꿔주신 김정욱 박사님, 내 옆자리 친구 같은 동생 박종찬, 정희정, 이준엽, 윤영주, 신정환, 윤미루, 곽신애 박사님, 장윤실, 윤인재, 임동현, 안소연, 허수희 박사 님, 신은주, 정영석, 김지은 박사님, Baburam, 강유정, 조은재, 배정원, 배찬미, 저희를 살찌게 하는 전민옥, 신주용 선생님까지... 모두 감사드립니다. 또한 저희 가족들 고마워요… 못난 남편 만나 고생하는 사랑하는 보령이, 당신이 있 기에 힘들어도 웃을 수 있어요 ^^ 씩씩하게 잘 커주는 울 아들 영환이, 영환이 보느라 고생하시는 어머니, 멀리서 일하시느라 힘드신 아버지, 자주 보지는 못 하지만 선진이, 제수씨, 민혁이 모두 사랑하고 감사합니다. 저를 위해 항상 기도해주시고 물심양면 지원해주시는 목사님, 사모님 감사드립니다. 그리고 사랑하는 울 동생들, 찌와 쭌 언제나 고마워 ^^. 함께 기도하는 동역자들인 하 늘의 별 식구들과 런던임마누엘 모든 성도님들께도 감사의 마음을 드립니다. 일일히 다 말로 표현할 수 없지만 많은 분들의 사랑과 관심과 기도를 통해 이 논문 이 무사히 나왔습니다. 모두 감사드리고 사랑합니다.
i
A comparison of value-related neural activity
in hippocampal CA3 and CA1 regions
To investigate whether and how the hippocampus contributes to value-based decision making, we compared value-related neural activity in CA3 vs. CA1 regions of the hippocampus in rats performing a dynamic foraging task in a modified T-maze. Neural signals necessary to update the value of chosen action, namely chosen value and choice outcome signals, converged in both CA3 and CA1 when a trial outcome was revealed at the reward sites. However, choice outcome signals were stronger in CA1 than CA3. Also, whereas chosen value signals subsided rapidly in CA3, they persisted in CA1 while the animal stayed at the reward sites. Moreover, reward prediction error and updated chosen value signals were stronger in CA1 than CA3. Together with our previous finding that CA1 conveys stronger value signals than the subiculum, these results raise the possibility that CA1 may play a particularly important role among hippocampal subregions in evaluating values of experienced events. It remains to be determined whether and how these value-related signals contribute to hippocampal neural processes underlying evaluation of experienced events.
ii
iii
ABSTRACT ……… i
TABLE OF CONTENTS ……… iii
LIST OF FIGURES ……… vi
ABBREVIATION ………vii
I. INTRODUCTION ……… 1
A. Episodic memory in Hippocampus ……… 1
B. Reinforcement learning model ……… 2
C. Valuation in Hippocampus ……… 3
D. Aims of the thesis and summary ……… 5
II. MATERIALS AND METHODS ……… 6
A. Subject ……… 6
B. Behavior task ……… 6
C. Unit recording ……… 12
D. Logistic regression analysis of behavior data ……… 15
E. Matching law……… 15
iv
1) Unit classification ……… 17
2) Multiple regression analysis ……… 18
3) Coefficient for partial determination (CPD) ……… 20
4) Onset time of upcoming choice signals ……… 21
5) Analysis of LFP ……… 22
6) Statistical analysis ……… 22
III. RESULTS ……… 24
A. Rat’s choice behavior ……… 24
B. Neuronal database ……… 25
C. Neural activity related to the rat’s choice and its outcome … 26 D. Neural activity related to the rat’s upcoming choice ……… 30
E. Neural activity related to chosen value ……… 31
F. LFP analysis ……… 35
G. Neural activity related to reward prediction error and updated chosen value ……… 37
v
REFERENCES ……… 44
vi
Figure 1. Behavioral performance.
Figure 2. Recording locations and unit classification in rats.
Figure 3. Neural activity related to choice and reward at reward sites.
Figure 4. Neural activity related to upcoming and previous choices on central stem.
Figure 5. Neural activity related to chosen value.
Figure 6. Results of LFP analysis.
vii
AIC: Akaike information criterion
BIC: Bayesian information criterion
CPD: coefficient for partial determination
CS: conditioned stimulus
DAWH: dual assignment with hold
LFP: local field potentials
RL: reinforcement learning
RPE: reward prediction error
SP: stack probability
SWR: sharp wave ripple
Ⅰ. INTRODUCTION
A. Episodic memory in Hippocampus
Hippocampus has a crucial role in encoding episodic memory. This concept was come from the result of surgical removal of the temporal lobe of human patient called H.M. who had an epilepsy. After the surgical removal of temporal lobe with hippocampus, he could not make a new episodic memory. Therefore, many researchers focused on the function of episodic memory in hippocampus. According to Tulving, episodic memory is an event in particular times, places and about what happened when and where (Tulving, 2002). It means that hippocampus should be related to these three components of episodic memory. Spatial information in hippocampus was found by O’keefe and Dostrovsky. (O’keefe and Dostrovsky, 1971). Some neurons fire in the specific place. These neurons are called “place cell”. Therefore, many researchers were focused on the spatial information with place cell and John O’keefe got the Nobel Prize in Physiology or Medicine in 2014. However, hippocampal place cells have not only spatial information but also non-spatial information. Hippocampal place cells modulate an information of locations, different environment or contexts, task demands and trajectories. (O'Keefe and Nadal, 1978; Muller and Kubie, 1987; Markus et al., 1995; Wood et al., 2000; Moita et al., 2004; Leutgeb et al., 2005; Song et al., 2005; Lee et al., 2006; Smith and Mizumori, 2006; Fenton et al., 2010).
B. Reinforcement learning model
Reinforcement learning (RL) is an area of machine learning. A method inspired by behavioral psychology, in which an agent defined in an environment recognizes the current state and selects a behavior or sequence of actions that maximizes reward among the choice behaviors (Sutton and Barto, 1998). Many neuro-economist used this model to explain human and animal’s decision making for maximizing value and reward (O'Doherty et al., 2003; Barraclough et al., 2004; Lee et al., 2004a; Samejima et al., 2005; Daw et al., 2006; Ito and Doya, 2011).
In the reinforcement learning, the agent chooses an action (At) in
the environment and then, take the reward (Rt) from the environment.
C. Valuation in hippocampus
The hippocampus was not a prevalent region for investigating the neural basis of value-based decision making as a structure known to play an crucial role in encoding episodic memories. However, we usually remember not only episodic event, but also its emotional factor – positive or negative - as well, when we remember a previous episode. Indeed, a brain imaging study in humans has shown that remembering previously experienced stimuli activates not only the hippocampus, but also those brain structures commonly activated by value (ventromedial prefrontal cortex and ventral striatum) (Kuhl et al., 2010). We can think of two different neural processes for linking event and value information together. The hippocampus might encode only factual information and event-value conjunction takes place elsewhere in the brain. Alternatively, information based on facts and values can be jointly encoded in the hippocampus. Supporting the latter possibility, significant value-based information have been reported in human (Tanaka et al., 2004; Bornstein and Daw, 2013) and rat (Lee et al., 2012a) hippocampus. What would be an advantage of coding value information together with factual information in the hippocampus? When fact and value information is encoded in combination, the relevant value information automatically appears when the fact information is remembered. This will be useful for future choices when you are in a situation similar to what you have experienced before. Consistent with this possibility, a study in
humans has shown that the hippocampus enables the spread of value across memories (Wimmer and Shohamy, 2012). Coding facts and value information at the same time is useful for evaluating their value and simulating hypothetical results. It is now well established that the hippocampus is important for memory as well as for imagination of new events (Buckner, 2010; Schacter et al., 2012; Mullally and Maguire, 2013; Gaesser et al., 2013). Value information of the hippocampus might play a role in rewarding scenarios for maximizing value and simulating most possible.
Currently, value-based hippocampal neural processes are unclear. We have shown previously that the CA1 in rats conveys strong and robust value signals, but weak in the subiculum, output of hippocampal information (Lee et al., 2012a). We then investigated whether and how the other hippocampal subregions process value-related information. To examine whether process the value signals in the hippocampal subregions, we focused on the CA3 subregion, which provides the heaviest afferent projections to CA1 (Amaral et al., 1990). This question is closely related to the issue of the functional role of CA1 in hippocampal mnemonic processing. Currently, there is no generally agreed theory on the role of CA1 in hippocampal mnemonic processing, even though CA3 is widely believed to be a critical structure for storing auto-associative memory (Marr, 1971; McNaughton and Morris, 1987; Rolls and
Treves, 1998). One major hurdle in formulating CA1 role has been the paucity of physiological findings on the difference in the nature of processed information between CA1 and CA3. The majority of previous studies on this issue have dealt with quantitative differences in the domain of spatial processing (Barnes et al., 1990; Lee et al., 2004b; Vazdarjanova and Guzowski., 2004; Leutgeb et al., 2004; Lu et al., 2015; Mizuseki et al., 2012).
D. Aims of the thesis and summary
In the present study, to obtain insights on this matter, we compared value-related neural activity of CA3 vs. CA1 in animals performing a dynamic foraging task. We found that CA1 carries stronger neural signals necessary to update value of the chosen target than CA3. This result raises the possibility that CA1 plays a particularly important role in value processing among hippocampal subregions.
Ⅱ. MATERIALS AND METHODS
A. Subjects
Four young (9 weeks old, 300-350 g) male Sprague-Dawley rats were used for physiological recording. The animals were housed in separate colony rooms. The animals were individually housed in their home cages and initially allowed free access to food and water with extensive handling for at least one week. They were then gradually water deprived so that their body weights were maintained at 80~85% ad libitum throughout the experiments. The experiments were performed in the dark phase of a 12-h light/dark cycle. The experimental protocol was approved by the Ethics Review Committee for Animal Experimentation of Ajou University and Korea Advanced Institute of Science and Technology.
B. Behavior task
The rats were trained in the dynamic foraging task. The animals (n=4) were trained in a modified T-maze (6560 cm, width of track: 8 cm, 3-cm high walls along the entire track except for the central bridge; elevated 30 cm from the floor; Fig. 1A) that contained three photobeam sensors. The animals were required to navigate from the central stem to either goal site to obtain
water reward and come back to the central stem via the lateral alley in each trial. A 2-s delay was imposed at the beginning of each trial by raising the distal portion of the central stem. A fixed amount of water reward (40 ㎕) was delivered according to a concurrent variable-ratio/variable-ratio reinforcement schedule so that each choice contributed to the ratio requirement of both goals. If water was delivered at the unvisited goal, it remained available in the subsequent trials without additional water delivery until the animal visited there [‘dual assignment with hold’ (DAWH) task] (Lau and Glimcher, 2005; Huh et al., 2009). The animal’s arrival at a goal was detected by a photobeam sensor (placed 6 cm ahead of the water delivery nozzle) and triggered an auditory tone [conditioned stimulus (CS); 9 and 1 kHz for rewarded and unrewarded trials] for 1 s, which marked the onset of the outcome period. Water was delivered at the CS offset in rewarded trials. The animals performed four blocks of trials in each recording session. The number of trials in each block was 35 plus a random number drawn from a geometric mean of 5 with the maximum of 45 (41.7±1.4 trials per block and 167.0±1.4 trials per session; mean±SD). Reward probability of a goal was constant within a block of trials, but changed across blocks without any sensory cues, so that changes in the probabilities of reward could be discovered only by trial and error. The following four combinations of reward probabilities were used in each session:
0.72:0.12, 0.63:0.21, 0.21:0.63 and 0.12:0.72. The sequence was determined randomly with the constraint that the richer alternative always changed its location at the beginning of a new block.
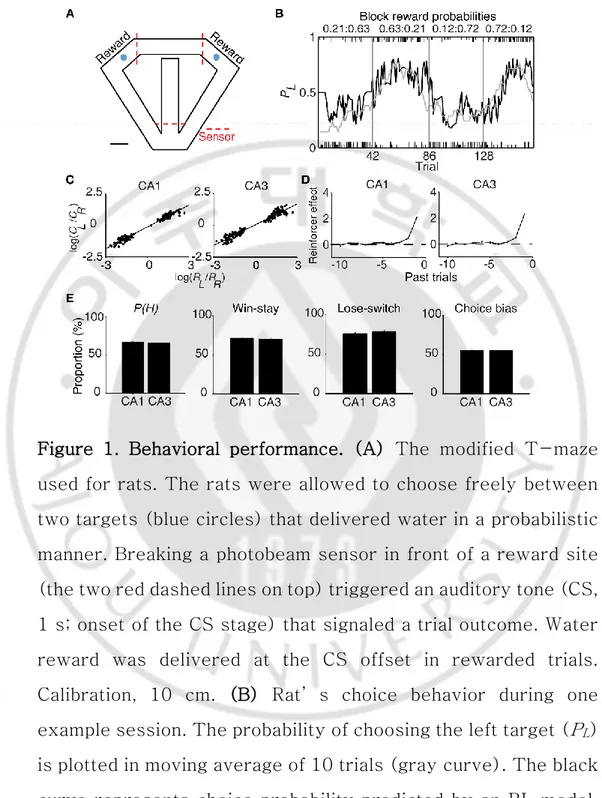
Figure 1. Behavioral performance. (A) The modified T-maze used for rats. The rats were allowed to choose freely between two targets (blue circles) that delivered water in a probabilistic manner. Breaking a photobeam sensor in front of a reward site (the two red dashed lines on top) triggered an auditory tone (CS, 1 s; onset of the CS stage) that signaled a trial outcome. Water reward was delivered at the CS offset in rewarded trials. Calibration, 10 cm. (B) Rat’s choice behavior during one example session. The probability of choosing the left target (PL)
is plotted in moving average of 10 trials (gray curve). The black curve represents choice probability predicted by an RL model. Tick marks denote trial-by-trial choices of the rat (upper, left
choice; lower, right choice; long, rewarded trial; short, unrewarded trial). Each session consisted of four blocks of trials with different combinations of reward probabilities. Vertical lines denote block transitions and numbers on top indicate reward probabilities used in this example session. (C to D) Comparison of choice behavior during CA1 and CA3 recording sessions. (C) The relationship between log choice ratio (ordinate) and log reinforcement ratio (abscissa) is shown separately for CA1 and CA3 recording sessions. Each data point was obtained by analyzing steady-state behavioral data (trials after the proportion of higher-reward-probability target choices reaching > 90% of the maximum value in each block in 7-trial moving average) during one block of trials. (D) Effects of past rewards on the rat’s choice are shown separately for CA1 and CA3 recording sessions. The influence of past rewards on the rat’s choice was estimated using a logistic regression model. Shown are regression coefficients averaged across four rats (mean±SEM). Positive coefficients indicate the animal’s tendency to make the same choice that was rewarded in recent trials. (E) The proportion of higher-reward-probability target choices [P(H)] in each block, the proportion of win-stay (repeating the rewarded choice) in each session, the proportion of lose-switch (switching from unrewarded choice) in each session, and choice bias (the proportion of choosing one target over the other in each session) were compared between CA1
and CA3 recording sessions. No significant difference was found in any of these measures (t-test, p-values > 0.1).
C. Unit recording
An array of 12, 15 or 24 (rat #1:12, #2,3:24, # 4:15) microdrives each controlling one tetrode was chronically implanted above the right hippocampus (3.6 mm posterior and 2.2 mm lateral to bregma; 1.5 mm ventral to brain surface) of well-trained (20-30 days of training in the dynamic foraging task before surgery) rats under isoflurane (1.5-2.0% [vol/vol] in 100% oxygen) anesthesia. Following 7 days of recovery from surgery, the rats were further trained in the task for 7-10 days while tetrodes were gradually advanced toward the CA1 cell body layer. Unit signals were recorded first in the CA1 cell body layer (12-16 sessions) and then in the CA3 cell body layer (9-15 sessions), with 12-(9-15 days of tetrode advancements between two bouts of unit recordings (Fig. 2A). Some tetrodes passed through the dentate granule cell layer instead of CA3 pyramidal cell layer. Units recorded from the dentate gyrus were not analyzed because the number of total recorded units was relatively small (n=107).
Unit signals were amplified with the gain of 10,000, filtered between 0.6-6 KHz, digitized at 32 KHz and stored on a personal computer using a Cheetah data acquisition system (Neuralynx; Bozemann, MT, USA). Local field potentials (LFP)
were also recorded from each tetrode (gain, 1000; band-pass filtering, 0.1-1000 Hz; digitization, 2 KHz). The head position of the animals was recorded at 30 Hz by tracking an array of light-emitting diodes mounted on the headstage. When the unit signal recordings were completed, small marking lesions were made by passing an electrolytic current (30 μA, 20 s, cathodal) through one channel of each tetrode and electrode tracks and marking lesions were verified histologically according to a standard procedure (Baeg et al., 2001; Fig. 2A). Recoding locations were determined based on the history of electrode advancements and histologically confirmed lesion sites and electrode tracks.
Figure 2. Recording locations and unit classification in rats. (A) Single units were recorded first from CA1 and then CA3 regions of the rat dorsal hippocampus. Red dots indicate the final recording locations of all tetrodes. Modified with permission from Elsevier (Paxinos and Watson, 1998). (B) Unit classification. The recorded units were classified into putative pyramidal cells and putative interneurons based on mean discharge rates and the distribution of inter-spike intervals. Those units with mean discharge rates < 5 Hz and the burst index (the percentage of inter-spike intervals shorter than one-fourth of each neuron’s mean inter-spike interval) > 45% were classified as putative pyramidal cells and the rest were classified as putative interneurons.
D. Logistic regression analysis of behavior data
Effects of previous choices and their outcomes on animal’s goal choice were estimated using the following logistic regression model:
0 10 1 10 1 ) ( ) ( ) ( ) ( ) ( ) ( log
j R L c j j R L r j R L R i j R i j C i j C i j i p i p , (eq. 1)where pL(i) [or pR(i)] is the probability of selecting the left
(or right) goal in the i-th trial. The variables RL(i)(or RR(i))
and CL(i)(or CR(i)) are reward delivery at the left (or right)
goal (0 or 1) and the left (or right) goal choice (0 or 1) in the i-th trial, respectively. The coefficients r
j
and c j
denote the effect of past rewards and choices, respectively, and 0 is a bias term.
E. Matching law
Steady-state behavioural data (trials after the proportion of higher-reward-probability target choices reaching > 90% of the maximum value in each block in 7-trial moving average) was analysed to test their conformity to the generalized matching law (Baum, 1974), as follows:
a R L R L R R b C C ) ( , (eq. 2)
where CL (or CR) and RL (or RR) are choice frequency and
reinforcement frequency for the left (or right) goal, respectively. The coefficients 𝑎 and 𝑏 are the sensitivity to the reinforcement ratio and a bias term, respectively.
F. Reinforcement learning model
We used the ‘stack probability’ (SP) model (Huh et al., 2009) to analyze choice behavior of rats. In the SP model, values were computed considering that reward probability of the unchosen target increases as a function of the number of consecutive alternative choices. Details of the SP model are described in our previous study (Huh et al., 2009). We have shown previously that the SP model explained rat’s choice behavior in the dual assignment with hold task better than a simple Q-learning model in terms of AIC and BIC (Huh et al., 2009), which was confirmed in the present study (simple Q-learning model, AIC per trial, 1.211±0.009; BIC per trial, 1.213±0.009; SP model, AIC per trial, 1.181±0.012; BIC per trial, 1.183±0.012).
For SP models, actions were chosen according to the softmax action selection rule, in which choice probability varied as a
graded function of the difference in action values (𝑄𝐿(𝑡) − 𝑄𝑅(𝑡)), as the following: ))) ( ) ( ( exp( 1 1 ) ( t Q t Q t p R L L
, (eq. 3)where 𝑃𝐿(𝑡) is the probability to choose the left goal, 𝛽 is the inverse temperature that defines the degree of exploration in action selection. The parameters and 𝛽 were estimated separately for each rat using all session data using a maximum likelihood procedure (Sul et al., 2010).
G. Analysis of neural data
1) Unit classification
Putative single units were isolated by manual cluster cutting of various spike waveform parameters using the MClust software (A. D. Redish). Only those clusters with L-ratio < 0.15 (0.0400.001, n=535), and isolation distance > 15 (52.53.1) (Schmitzer-Torbert et al., 2005) were included in the analysis. Units recorded from rat CA1 and CA3 were classified into
putative pyramidal cells (complex spike cells) and putative inhibitory interneurons (theta cells) based on mean discharge rate and a burst index (the percentage of inter-spike intervals shorter than one-fourth of each neuron’s mean inter-spike interval). Those units with mean discharge < 5 Hz and the burst index > 45% were classified as putative pyramidal cells, that were included in the analysis, and the rest were classified as putative interneurons (Fig. 2B). The majority of classified units in rats were putative pyramidal cells (CA1, 262 of 283, 92.6%; CA3, 231 of 252, 91.7%). Their mean discharge rates and burst index were 0.50±0.49 Hz and 73.3±8.3%, respectively, in CA1 and 0.38±0.34 Hz and 72.3±10.4%, respectively, in CA3.
2) Multiple regression analysis
Neural activity related to the animal’s choice and its outcome was examined using the following regression model:
S(t) = 𝑎0 + ∑2𝑛=0[𝑎3𝑛+1𝐶(𝑡 − 𝑛) + 𝑎3𝑛+2𝑅(𝑡 − 𝑛) + 𝑎3𝑛+3𝑋(𝑡 − 𝑛)] +
𝑎10𝐿(𝑡) + 𝑎11𝑌(𝑡) + 𝑎12𝑀(𝑡) + 𝐴(𝑡) + 𝜀(𝑡)
(eq. 4)
where, 𝐶(𝑡), 𝑅(𝑡) and 𝑋(𝑡) indicate the animal’s choice, its outcome, and their interaction in trial t, 𝐿(𝑡) is the animal’s lateral position (lateral deviation from the midline of the maze),
𝑌(𝑡) is the Y-position of the animal, 𝑀(𝑡) is the animal’s movement speed, 𝐴(𝑡) is a set of autocorrelation terms (spike
discharge rates during the same analysis time window in the previous five trials as the following: 𝐴(𝑡) = ∑5𝑛=1(𝑎𝑛+12𝑆(𝑡 − 𝑛)); each multiplied by its regression coefficient), 𝜀(𝑡) is the error term, and 𝑎0~𝑎17 are the regression coefficients.
Value-related neural activity was examined using the following regression model:
S(t) = 𝑎0+ 𝑎1𝐶(𝑡) + 𝑎2𝑅(𝑡) + 𝑎3𝑋(𝑡) + 𝑎4𝑄𝐿(𝑡) + 𝑎5𝑄𝑅(𝑡) + 𝑎6𝑄𝑐(𝑡) +
𝑎7𝐿(𝑡) + 𝑎8𝑌(𝑡) + 𝑎9𝑀(𝑡) + 𝐴(𝑡) + 𝜀(𝑡)
(eq. 5)
where 𝑄𝐿(𝑡) and 𝑄𝑅(𝑡) indicate the action values for the leftward and rightward goal choices in trial t, respectively, that were estimated with the SP model, and 𝑄𝑐(𝑡) denotes the chosen value (value of the chosen target in each trial).
Neural activity related to RPE and updated chosen value (upQc)
was examined using the following regression models:
S(t) = 𝑎0+ 𝑎1𝐶(𝑡) + 𝑎2𝑄𝐿(𝑡) + 𝑎3𝑄𝑅(𝑡) + 𝑎4𝑅𝑃𝐸 + 𝑎5𝐿(𝑡) + 𝑎6𝑌(𝑡)
+ 𝑎7𝑀(𝑡) + 𝐴(𝑡) + 𝜀(𝑡)
(eq. 6)
S(t) = 𝑎0+ 𝑎1𝐶(𝑡) + 𝑎2𝑄𝐿(𝑡) + 𝑎3𝑄𝑅(𝑡) + 𝑎4𝑢𝑝𝑄𝑐+ 𝑎5𝐿(𝑡) + 𝑎6𝑌(𝑡)
(eq. 7) where 𝑅𝑃𝐸 = 𝑅(𝑡) − 𝑄𝑐(𝑡) and 𝑢𝑝𝑄𝑐(𝑡) = 𝑄𝑐(𝑡) + 𝛼𝑅𝑃𝐸.
The following regression model was used to analyse RPE- and updated chosen value-related neural activity at each reward site separately: S(t) = 𝑎0+ 𝑎1𝑄𝐿(𝑡) + 𝑎2𝑄𝑅(𝑡) + 𝑎3𝑅𝑃𝐸 + 𝑎4𝐿(𝑡) + 𝑎5𝑌(𝑡) + 𝑎6𝑀(𝑡) + 𝐴(𝑡) + 𝜀(𝑡) (eq. 8) S(t) = 𝑎0+ 𝑎1𝑄𝐿(𝑡) + 𝑎2𝑄𝑅(𝑡) + 𝑎3𝑢𝑝𝑄𝑐+ 𝑎4𝐿(𝑡) + 𝑎5𝑌(𝑡) + 𝑎6𝑀(𝑡) + 𝐴(𝑡) + 𝜀(𝑡) (eq. 9)
For this analysis, those neurons that have significant coefficients for RPE (or upQc) at either reward site (p < 0.025; alpha=0.05 was corrected for multiple comparisons) were determined to be RPE- (or upQc-) responsive neurons.
3) Coefficient for partial determination (CPD)
CPD for RPE and updated chosen value was calculated as the following (Neter et al., 1996; Kim et al., 2009):
CPD(X2) = [SSE(X1) - SSE(X1, X2)]/SSE(X1), (eq. 10)
where SSE(Xi) is the sum of squared errors of a regression model containing a set of independent variables Xi, X1 included C(t), QL(t), and QR(t) along with behavioral variables (L(t), Y(t) and M(t)), and X2 was either RPE or updated chosen value. Thus, CPD is the fraction of variance in neuronal activity that is additionally explained by RPE or updated chosen value.
4) Onset time of upcoming choice signals
To determine the time of choice onset (first behavioral manifestation of the animal’s choice), we first estimated the Y-position in which the animal’s X-position begins to diverge (near the upper T-junction in Fig. 1A) for each session based on visual inspection. We then aligned the animal’s X-position data relative to the time when the animal reached this Y-position, and choice onset was defined as the time when the animal’s X-positions during the left-choice and right-choice trials became significantly different (t-test, p < 0.05; Fig. 4A). Thus, choice onset was determined separately for each behavioral session. We then plotted temporal profiles of choice signals (fractions of
neurons significantly responsive to the animal ’ s upcoming choice) relative to choice onset (Fig. 4B). The onset time of upcoming choice signals was when choice signals became significant for the first time and remained that way up to 1 s following choice onset.
5) Analysis of LFP
LFPs were recorded through one channel of each tetrode. For SWR detection, LFPs were filtered between 100-250 Hz. The amplitude for each LFP trace was determined by Hilbert transform, averaged across tetrodes and then smoothed with a Gaussian kernel (σ=4ms). SWR events were defined as the time periods if the smoothed envelop exceeded a threshold of the mean plus 2.5 standard deviations for at least 20 ms. (Jackson et al., 2006) Twenty ms were added to the beginning and end of each SWR event. SWR events were analyzed only when animal’s head speed was < 4cm/s.
6) Statistical analysis
Statistical significance of a regression coefficient was tested based on a t-test, and significance of the fraction of neurons for a given variable was tested with a binomial test. Strengths of
neural signals (fractions of neurons coding a given variable) between CA3 and CA1 were compared with a 𝜒2-test. All
statistical tests were based on two-tailed tests. A p value < 0.05 was used as the criterion for a significant statistical difference. Data are expressed as meanSEM unless noted otherwise.
Ⅲ. RESULTS
A. Rat’s choice behavior
All rats showed biased choices towards the higher reward probability target in a given block within ~10 trial lags after a block transition (Fig. 1B), so that the rat’s choice behavior during the steady state (trials after the proportion of higher-reward-probability target choices reaching > 90% of the maximum value in each block in 7-trial moving average) was consistent with the generalized matching law (Baum, 1974) (Fig. 1C). Logistic regression analysis showed that animal’s choice was affected by previous choice outcomes, and more recent choice outcomes have a stronger effects (Fig. 1D). These results show that the animal was able to track changes in the relative outcome probability depending on past choices and outcomes and adjusted the choices accordingly. As shown previously (Huh et al., 2009; Lee et al., 2012a), the animal’s choice behavior in the current task was well captured by the SP model (Fig. 1B). The animal’s choice behavior was similar during CA3 and CA1 unit-recording sessions. There is no significant difference between CA3 and CA1 unit-recording sessions in the proportions of choosing the higher reward probability target (t-test, p=0.178), win-stay (repeating the rewarded choice; p=0.659), and lose-switch (switching from the unrewarded choice; p=0.154). There was no significant difference
in the animal’s choice bias (the proportion of choosing the preferential target in a given session; p=0.479; Fig. 1E), either.
B. Neuronal database
We recorded 252 CA3 and 283 CA1 single units from the four rats while performing the task (Fig. 2A). The recorded units were classified into putative pyramidal cells (complex spike cells; CA3, n=231; CA1, n=262) and putative interneurons (theta cells; CA3, n= 21; CA1, n= 21; Ranck, 1973) based on mean discharge rates and a burst index (Fig. 2B). Their mean discharge rates were 0.50±0.49 Hz and 0.38±0.34 Hz, and burst index were 73.3±8.3% and 72.3±10.4% (mean±SD), respectively, in CA1 and CA3.
In the present study, in order to examine CA3 and CA1 neural activity related to the evaluation of experienced events, we analyzed neural activity at the reward sites. Specifically, we analyzed neural spike data recorded during the reward stage (onset, rat’s breaking the photobeam sensor placed 6-cm in front of the water delivery nozzle; offset, rat’s head position passing the line 6-cm below the water delivery nozzle; Fig. 1A). Neural spike data in the left and right goal sites were merged and analyzed together so that neural activity related to chosen value (the value of chosen goal in each trial) and action value (the value of the left
or right goal) could be dissociated.
C. Neural activity related to the rat’s choice and its outcome
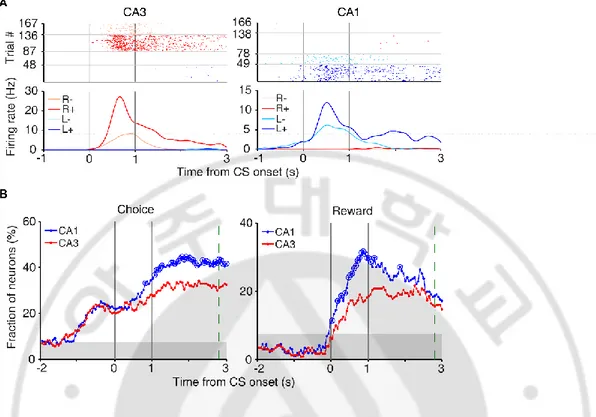
We examined neuronal activity related to the rat’s choice (C), its outcome (reward; R) using a multiple linear regression analysis (eq. 4). Note that side specificity (spatial selectivity) of neural activity is captured by the activity related to the rat’s goal “choice” in the regression model. Both CA1 and CA3 conveyed strong neural signals for the animal’s choice and its outcome when choice outcome was revealed at the reward sites (Fig. 3A). Temporal profiles of choice and outcome signals (in terms of the fraction of neurons responsive to each variable; eq. 4) are shown in Fig. 3B. In our task, the arrival of the rat at either reward sites (breaking the photobeam sensor 6-cm in front of the water delivery nozzle) triggered an auditory tone signaling the availability of reward for 1 s before the actual reward was delivered. Choice signals were strong before CS onset, which is expected because the rat revealed its goal choice behaviorally well before CS onset, and reward signals began to arise as soon as the outcome of a choice was revealed (CS onset) in both CA3 and CA1. Both choice and reward signals was stronger in CA1 than CA3 (Fig. 3B).
Figure 3. Neural activity related to choice and reward at reward sites. (A) Examples of choice- and reward-coding neurons at reward sites. Spike raster plots and spike density functions (σ = 100 ms) are shown for two example neurons that were responsive to both choice [left (L) vs. right (R) reward sites] and reward [reward (+) vs. no reward (−)]. Trials were grouped according to the animal’s choice and reward. (B) Temporal profiles of choice and reward signals at reward sites, measured as the fraction of neurons that are significantly responsive to each variable (1 s moving window, 50 ms time steps). Large circles, significant differences between CA1 and CA3 (𝜒2-test, p < 0.05). Shading, chance level (binomial test). The
green dashed line indicates the averaged time of reward stage offset in unrewarded trials.
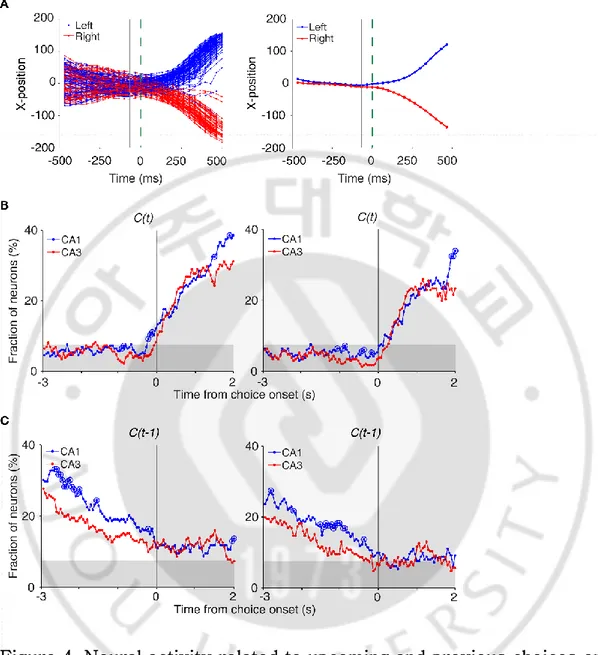
Figure 4. Neural activity related to upcoming and previous choices on central stem. (A) Determination of the time of choice onset. Choice onset was when the difference in the animal’s horizontal coordinate (X-position) of the left- and right-choice trials first became statistically significant. Shown are the time course of the
(Figure 1A) during an example session (left, individual trials; right, mean). Blue and red indicate trials associated with the left and right goal choices, respectively. The dashed line (0 ms) indicates the time of clear separation in the animal’s X-positions according to its
choice upon visual inspection, and the solid line corresponds to the time when the difference in the X-positions for the left- and right-choice trials first became statistically significant (i.e., right-choice onset; t-test, p < 0.05) within ±0.5 s window from time 0. (B) Choice signals around choice onset examined with 1 s (left) and 0.5 s (right) moving windows (50 ms time steps). (C) Previous choice signals examined with 1 s (left) and 0.5 s (right) moving windows (50 ms time steps). The same format as in Figure 3B.
D. Neural activity related to the rat’s upcoming choice
To examine whether CA1 or CA3 neurons conveyed upcoming choice signal, we aligned neural activity to the onset of choice behavior (the first time point for behavioral manifestation of the rat’ s upcoming target choice; Fig. 4A) that was determined based on the animal ’ s movement trajectories in each behavioral session as previously described (Kim et al., 2009, 2013; Sul et al., 2010, 2011). A sliding window analysis (1-s window advanced in 50-ms steps) showed that both CA3 and CA1 had a weak choice signals before the behavioral manifestation of the rat ’s goal choice (Fig. 4B). For comparisons with choice signals in other brain structures, we determined the onset of choice signals in the same manner as applied to the neural data obtained from frontal cortical regions and striatum (Kim et al., 2009, 2013; Sul et al., 2010, 2011). Briefly, the fraction of neurons responsive to the animal’s choice was calculated using a higher temporal resolution (500-ms window advanced in 50-ms steps). In both CA1 and CA3, significant choice signals appeared only
after behavioral manifestation of the rat’s goal choice at higher temporal resolution (Fig. 4B). The current task allows separate examinations of neural activities associated with previous and future
choices, because they were only modestly correlated (r = 0.037 ± 0.154; mean ± SD across sessions). Relatively strong previous choice signals delivered on the central stem of the maze in both CA3
and CA1 (eq 4; Figure 4C), which is consistent with our previous finding (Lee et al., 2012a). Therefore, both CA3 and CA1 showed strong retrospective choice signals in the central stem of the maze, but a weak prospective choice signals.
E. Neural activity related to chosen value
As shown in our previous study (Lee et al., 2012a), chosen value signals began to increase ~1 s before CS onset in CA1, indicating that expected reward signals at CA1 has come out before the choice outcome was revealed. CA3 chosen value signals showed a similar temporal profile; they began to increase ~1 s before the CS onset and then subsided gradually (for ~2 s since CS onset; Fig. 5B). However, CA3 chosen value signals rose above chance level more slowly compared to CA1 (500 and 100 ms before outcome onset for CA1 and CA3, respectively; Fig. 5B), and were significantly weaker
(CA3, 8.2%; CA1, 14.1%; χ2-test, p = 0.040) when analyzed using
a relatively large analysis time window (between −0.5 and +1 s relative to outcome onset). Moreover, a difference was found between CA1 and CA3 chosen value signals in the later phase of the reward period (2~3 s since CS onset). CA1 chosen value signals were elevated again (at ~2 s since CS onset) and stayed above chance level until the animal exited the reward site (Fig. 5B). By contrast, CA3 chosen value signals largely stayed below chance level
during the late phase of the reward period (Fig. 5B).
For confirmation, we performed additional analyses. we examined the relationship between chosen value signals and mean firing rates separately for the early-phase (during 1 s from CS onset) and late-phase (the time period between 2 and 3 s following CS onset) chosen value signals. For this, we aligned CA3/CA1 neurons according to their mean discharge rates during the analysis time window, and computed the fractions of chosen value-coding neurons using a moving window of 150 neurons that was advanced in steps of 10 neurons (starting from the low-firing neurons). As shown in Fig. 5C, chosen value signals were consistently stronger in CA1 than CA3 during the early phase and the late phase of the reward period. These results indicate that different chosen signals between CA3 and CA1 are not because of different spatial firing or mean firing rates between CA3 and CA1 neurons.
Figure 5. Neural activity related to chosen value. (A) Two examples of chosen value-coding neurons. Trials were grouped according to chosen value (in quartiles). (B) Temporal profiles of chosen value signals. The same format as in Figure 3B. (C) Chosen-value signals as a function of firing rate (mean of 150 neurons, steps of 10 neurons). CA3 and CA1 units were aligned according to their mean
discharge rates, and chosen value signals around CS onset (2 s
window centered on CS onset) and during 2–3 s since CS onset were examined using a moving window of 150 neurons that was advanced in steps of 10 neurons (starting from the low-firing side).
F. LFP analysis
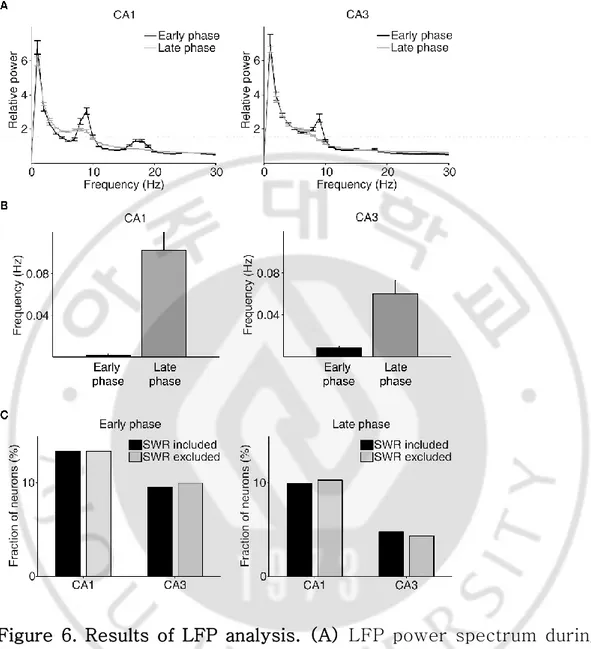
To investigate whether different value-related neural activity between CA3 and CA1 is associated with a particular LFP pattern, we examined LFP during the reward period. Because SWR-associated CA3/CA1 replays have been shown to be modulated by reward (Singer and Frank, 2009; Pfeiffer and Foster, 2013; Olafsdottir et al., 2015; Ambrose et al., 2016), we examined the contribution of SWR-associated hippocampal replays to value-dependent neural activity in the present behavioral task. The occurrence of SWR was overall rare during the reward period (Fig. 6B). As can be expected from the low occurrence of SWRs, similar results were obtained when we repeated the same analyses after deleting all neural spikes associated with SWRs (Fig. 6C). These results indicate value-related neural activity found in the present study is different from reward-dependent replays of hippocampal neurons during SWR (Singer and Frank, 2009; Pfeiffer and Foster, 2013; Olafsdottir et al., 2015; Ambrose et al., 2016).
Figure 6. Results of LFP analysis. (A) LFP power spectrum during the early (between -1 and 1 s since CS onset) and late (between 2 s since CS onset and exit from the reward site) phases of the outcome period. (B) The frequency of SWRs during the early and late phases of the outcome period. (C) Chosen value signals, that were estimated with and without excluding the neural data associated with SWRs, were compared.
G. Neural activity related to reward prediction error and updated chosen value
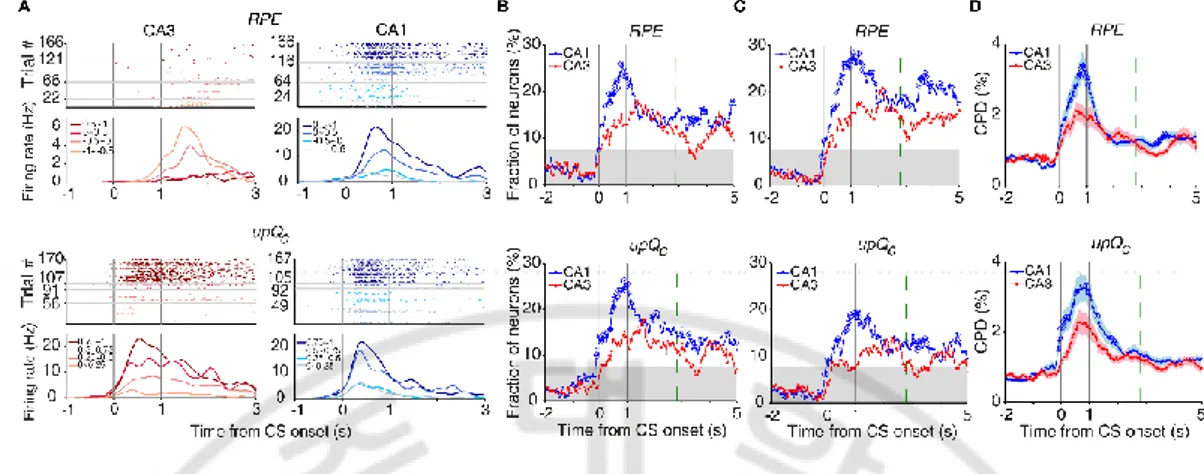
Outcome signals and chosen value can be combined to compute reward prediction error (RPE) and update chosen value (upQc; Kim 2009; Sul 2010, 2011; Lee, 2012a). Both RPE and upQc signals were stronger in CA1 than CA3 (Fig. 7B) by using multiple regression models (eq. 8 and 9). A separate analysis of neural activity at each goal site showed similar results (Fig. 7C).Analyzes of the effect size of all neurons, rather than the fraction of significant neurons, using CPD (eq. 10) also yielded similar results (Fig. 7D).
Figure 7. Neural activity related to RPE and updated chosen value. (A) Example neurons coding RPE (top) or updated chosen value (upQc; bottom). Trials were grouped according to RPE or updated chosen value (in quartiles). (B) Temporal profiles of RPE and updated chosen value signals. (C) Neural activity at each goal site was analyzed separately. (D) CPD for RPE and updated chosen value. Shading indicates SEM.
Ⅳ. DISCUSSION
We compared the activities of CA3 and CA1 in dynamic foraging situations to gain insight into the hippocampal processes that underlie value-based decision making. We found that reward prediction error and updated chosen value neural signals were significantly stronger in CA1 compared to CA3 in rats. Collectively, this result indicates a more important role of CA1 than CA3 in keeping track of values of potential choices based on the history of past choices and their outcomes.
In rats, reward prediction error and updated chosen value signals were significantly stronger in CA1 than CA3 when the animal’s choice outcome was revealed. However, advanced choice signals were found in neither brain structure. This result suggests that CA1 is not directly involved in action selection process per se or controlling exploitation vs. exploration trade-off (randomness in action selection), but likely to influence action selection indirectly via its role in updating values associated with different options. Our results consistently indicate a selective role of CA1 in value learning, but not in action selection.
Several lines of evidence indicate that different types of memory are served in parallel by distinct neural systems. The hippocampus is known to play a crucial role in declarative memory—remembering facts and events—but not in gradual stimulus-response or response-outcome association, in which the striatum is known to play an important role (McDonald and White, 1993; Packard and Knowlton, 2002; Squire, 2004). From the standpoint of Reinforcement Learning theory, the dorsolateral striatum has been proposed to mediate model-free reinforcement learning (or incremental value learning based on actual outcomes), whereas the hippocampus has been proposed to contribute to model-based Reinforcement Learning (or knowledge-based value learning) based on its role in remembering facts and events and simulating hypothetical episodes (Lee et al., 2012b; Doll et al., 2012). These theories often assume that the striatum is in charge of gradual associative learning based on actual experiences, whereas the hippocampus is involved in ‘cognitive’ learning of facts and events (such as one-trial learning, vicarious learning, and forming cognitive maps). However, our results indicate that the hippocampus, especially CA1, may also contribute to incremental value learning in a dynamic foraging situation.
What is the neural basis of a value signal that is stronger CA1 than CA3? One possibility is the different projection of dopamine and its
effects on CA3 and CA1. Dopaminergic projections from the ventral tegmental area (VTA) are different between CA3 and CA1. And dopamine receptor subtype distributions are also different (Gasbarri et al., 1997; Shohamy and Adcock, 2010). Dopamine is known as carrier of RPE signals (Schultz et al., 1997; Roesch et al., 2007; Cohen et al., 2012) and regulates synaptic plasticity and transmission in CA1 (e.g., Frey et al., 1990; Otmakhova and Lisman, 1996; Li et al., 2003; O’Carroll and Morris, 2004; Zhang et al., 2009; Brzosko et al., 2015; Rosen et al., 2015; see also Hansen and Manahan-Vaughan, 2014 for review). Dopamine might be different effects to CA3 vs. CA1 neurons through these mechanisms, so CA1 neuronal activity is independently regulated to values compare to CA3. This possibility is supported by previous study that inactivation of the ventral tegmental area changes spatial firing of CA1 place cells, but not CA3 (Martig and Mizumori 2011). Moreover, other afferent projections to CA1, such as CA2 projections (Tamamaki et al., 1988; Shinohara et al., 2012; Kohara et al., 2014), direct layer III entorhinal cortical projections (Witter, 1986, 1993; Amaral, 1993), thalamic projections (Herkenham, 1978; Wouterlood et al., 1990) and prefrontal cortical projections (Rajasethupathy et al., 2015), may contribute to value-related neural activity of CA1 neurons. Future studies that combine manipulation of specific afferent predictions and monitoring of CA1 neuronal activity may help clarify the role of dopaminergic and other afferent projections in CA1 value processing.
Recent research indicates that hippocampus has an important role which is imagining future episodes (Buckner, 2010; Schacter et al., 2012; Gaesser et al., 2013; Mullally and Maguire, 2014). In rats, hippocampal place cells go through sequential neural activity (replays) during sleep and immobile awakening during task that reflect not only experienced but also unexperienced trajectories (e.g., Louie and Wilson, 2001; Lee and Wilson, 2002; Foster and Wilson, 2006; Diba and Buzsaki, 2007; Carr et al., 2011; Johnson and Redish, 2007; Gupta et al., 2010; Dragoi and Tonegawa, 2011; Pfeiffer and Foster, 2013). Our results increase the possibility that value signal represented in CA1 may contribute to replay of place cells. Consistent with this possibility, trajectories reconstructed from replays of CA1 place cells are preferentially directed to not only previously visited but also unvisited (but observed) reward locations in rats (Foster and Wilson, 2006; Pfeiffer and Foster, 2013; Olafsdottir et al., 2015). Value-related CA1 neurons involved in replay may be a way of evaluating expected values of replayed place cell sequences, which would be useful for event sequences (or rewarding trajectories) for maximizing value and simulating the most probable.
Ⅴ. CONCLUSIONS
The hippocampus is known to play a crucial role in declarative memory (remembering facts and events), but not in gradual stimulus-response or response-outcome association in which striatum is known to play an important role (McDonald and White, 1993; Packard and Knowlton, 2002). From the standpoint of RL theory, the dorsolateral striatum has been proposed to mediate model-free RL (or incremental value learning based on actual outcomes), whereas the hippocampus has been proposed to contribute to model-based RL (or knowledge-based value learning) based on its role in remembering facts and events and simulating hypothetical episodes (Lee et al., 2012b; Doll et al., 2012). However, our results indicate that the hippocampus, especially CA1, contributes to incremental value learning in a dynamic foraging situation. The modality of information to be remembered might be a factor that determines the involvement of the hippocampus in incremental learning.
REFERENCES
1. Amaral DG. Emerging principles of intrinsic hippocampal organization. Curr. Opin. Neurobiol. 1993; 3: 225–229.
2. Amaral DG., Ishizuka N, Claiborne B. Neurons, numbers and the hippocampal network. Prog Brain Res. 1990; 83: 1-11.
3. Ambrose RE., Pfeiffer BE., Foster DJ. Reverse Replay of Hippocampal Place Cells Is Uniquely Modulated by Changing Reward. Neuron. 2016 Sep 7; 91(5): 1124-36.
4. Baeg EH, Kim YB, Jang JH, Kim HT, Mook-Jung IH, Jung MW. Fast spiking and regular spiking neural correlates of fear conditioning in the medial prefrontal cortex of the rat. Cereb Cortex. 2001 May; 11(5): 441-51.
5. Barnes CA, McNaughton BL, Mizumori SJ, Leonard BW, Lin LH. Comparison of spatial and temporal characteristics of neuronal activity in sequential stages of hippocampal processing. Prog Brain Res. 1990; 83: 287-300.
6. Barraclough DJ, Conroy ML, Lee D. Prefrontal cortex and decision making in a mixed-strategy game. Nat Neurosci 2004; 7: 404-410.
7. Baum WM. On two types of deviation from the matching law: bias and undermatching. J Exp Anal Behav. 1974 Jul; 22(1): 231-42. 8. Bornstein AM, Daw ND. Cortical and hippocampal correlates of
deliberation during model-based decisions for rewards in humans. PLoS Comput Biol. 2013; 9(12).
9. Brzosko Z, Schultz W, Paulsen O. Retroactive modulation of spike timing-dependent plasticity by dopamine. Elife. 2015 Oct 30; 4.
10. Buckner RL. The role of the hippocampus in prediction and imagination. Annu Rev Psychol. 2010; 61: 27–48.
11. Carr MF, Jadhav SP, and Frank LM. Hippocampal replay in the awake state: a potential substrate for memory consolidation and retrieval. Nat. Neurosci. 2011; 14: 147–153.
12. Cohen JY, Haesler S, Vong L, Lowell BB, Uchida N. Neuron-type-specific signals for reward and punishment in the ventral tegmental area. Nature. 2012 Jan 18; 482(7383): 85-8.
13. Daw ND, O'Doherty JP, Dayan P, Seymour B, Dolan RJ. Cortical substrates for exploratory decisions in humans. Nature. 2006; 441: 876-879.
14. Diba K., and Buzsáki G. Forward and reverse hippocampal place-cell sequences during ripples. Nat. Neurosci. 2007; 10: 1241–1242. 15. Doll BB, Simon DA, Daw, ND. The ubiquity of model-based reinforcement learning. Curr. Opin. Neurobiol. 2012 Dec; 22(6): 1075-1081.
16. Dragoi G., and Tonegawa S. Preplay of future place cell sequences by hippocampal cellular assemblies. Nature. 2011; 469: 397–401.
17. Fenton AA, Lytton WW, Barry JM, Lenck-Santini PP, Zinyuk LE, Kubik S, Bures J, Poucet B, Muller RU, Olypher AV: Attention-like modulation of hippocampus place cell discharge. J Neurosci 2010; 30: 4613-4625.
18. Foster DJ, and Wilson MA. Reverse replay of behavioural sequences in hippocampal place cells during the awake state. Nature. 2006; 440: 680–683.
prevent long-term maintenance of posttetanic LTP in the CA1 region of rat hippocampal slices. Brain Res. 1990 Jul 2; 522(1): 69-75.
20. Gaesser B, Spreng RN, McLelland VC, Addis DR, Schacter DL. Imagining the future: evidence for a hippocampal contribution to constructive processing. Hippocampus. 2013 Dec; 23(12): 1150-61.
21. Gasbarri A, Sulli A, Packard MG. The dopaminergic mesencephalic projections to the hippocampal formation in the rat. Prog Neuropsychopharmacol Biol Psychiatry. 1997 Jan; 21(1): 1-22.
22. Gupta AS, van der Meer MA, Touretzky DS, and Redish AD. Hippocampal replay is not a simple function of experience. Neuron. 2010; 65: 695–705.
23. Hansen N, Manahan-Vaughan D. Dopamine D1/D5 receptors mediate informational saliency that promotes persistent hippocampal long-term plasticity. Cereb Cortex. 2014 Apr; 24(4): 845-58.
24. Herkenham,M. The connections of the nucleus reuniens thalami: evidence for a direct thalamo-hippocampal pathway in the rat. J. Comp. Neurol. 1978; 177: 589–609.
25. Huh N, Jo S, Kim H, Sul JH, Jung MW. Model-based reinforcement learning under concurrent schedules of reinforcement in rodents. Learn Mem. 2009 Apr 29;16(5):315-23. 26. Ito M, Doya K. Multiple representations and algorithms for reinforcement learning in the cortico-basal ganglia circuit. Curr Opin Neurobiol. 2011; 21: 368-373.
27. Jackson JC, Johnson A, Redish AD. Hippocampal sharp waves and reactivation during awake states depend on repeated sequential experience. J Neurosci. 2006 Nov 29; 26(48): 12415-26.
28. Johnson A, and Redish AD. Neural ensembles in CA3 transiently encode paths forward of the animal at a decision point. J. Neurosci. 2007; 27: 12176–12189.
29. Kim H, Sul JH, Huh N, Lee D, Jung MW. Role of striatum in updating values of chosen actions. J Neurosci. 2009 Nov 25; 29(47): 14701-12.
30. Kim H, Lee D, Jung MW. Signals for previous goal choice persist in the dorsomedial, but not dorsolateral striatum of rats. J Neurosci. 2013 Jan 2; 33(1): 52-63.
31. Kohara K, Pignatelli M, Rivest AJ, Jung HY, Kitamura T, Suh J. Cell type-specific genetic and optogenetic tools reveal hippocampal CA2 circuits. Nat. Neurosci. 2014; 17: 269–279. 32. Kuhl BA, Shah AT, DuBrow S, Wagner AD. Resistance to
forgetting associated with hippocampus-mediated reactivation during new learning. Nat Neurosci. 2010 Apr; 13(4): 501-6. 33. Lau B, Glimcher PW. Dynamic response-by-response models of
matching behavior in rhesus monkeys. J Exp Anal Behav. 2005 Nov; 84(3): 555-79.
34. Lee AK, and Wilson MA. Memory of sequential experience in the hippocampus during slow wave sleep. Neuron. 2002; 36: 1183– 1194.
35. Lee D, Conroy ML, McGreevy BP, Barraclough DJ. Reinforcement learning and decision making in monkeys during a competitive game. Brain Res Cogn Brain Res. 2004a; 22: 45-58.
36. Lee H, Ghim JW, Kim H, Lee D, Jung MW. Hippocampal neural correlates for values of experienced events. J Neurosci. 2012a, Oct 24; 32(43): 15053-65.
37. Lee D, Seo H, Jung MW. Neural basis of reinforcement learning and decision making. Annu Rev Neurosci. 2012b; 35: 287-308. 38. Lee I, Griffin AL, Zilli EA, Eichenbaum H, Hasselmo ME. Gradual
translocation of spatial correlates of neuronal firing in the hippocampus toward prospective reward locations. Neuron. 2006; 51: 639-650.
39. Lee I, Yoganarasimha D, Rao G, Knierim JJ. Comparison of population coherence of place cells in hippocampal subfields CA1 and CA3. Nature. 2004b, July; 430(6998): 456-459.
40. Leutgeb JK, Leutgeb S, Treves A, Meyer R, Barnes CA, McNaughton BL, Moser MB, Moser EI. Progressive transformation of hippocampal neuronal representations in "morphed" environments. Neuron. 2005; 48: 345-358.
41. Leutgeb S, Leutgeb JK, Treves A, Moser MB, Moser EI. Distinct ensemble codes in hippocampal areas CA 3 and CA1. Science. 2004 Aug 27; 305(5688): 1295-8.
42. Li S, Cullen WK, Anwyl R, Rowan MJ. Dopamine-dependent facilitation of LTP induction in hippocampal CA1 by exposure to spatial novelty. Nat Neurosci. 2003 May; 6(5): 526-31.
43. Louie K, and Wilson MA. Temporally structured replay of awake hippocampal ensemble activity during rapid eye movement sleep. Neuron. 2001; 29: 145–156.
of place maps along the CA3-to-CA2 axis of the hippocampus. Neuron. 2015; 87: 1078-1092.
45. Markus EJ, Qin YL, Leonard B, Skaggs WE, McNaughton BL, Barnes CA. Interactions between location and task affect the spatial and directional firing of hippocampal neurons. J Neurosci. 1995; 15: 7079-7094.
46. Marr D. Simple memory: a theory for archicortex. Philos Trans R Soc Lond B Biol Sci. 1971; 262: 23-81.
47. Martig AK, Mizumori SJ. Ventral tegmental area disruption selectively affects CA1/CA2 but not CA3 place fields during a differential reward working memory task. Hippocampus. 2011 Feb; 21(2): 172-84.
48. McDonald RJ, White NM. A triple dissociation of memory systems: hippocampus, amygdala, and dorsal striatum. Behav Neurosci. 1993; 107(1): 3-22.
49. McNaughton BL, and Morris RG. Hippocampal synaptic enhancement and information storage within a distributed memory system. Trends Neurosci. 1987; 10, 408-415.
50. Mizuseki K, Royer S, Diba K, Buzsaki G. Activity dynamics and behavioral correlates of CA3 and CA1 hippocampal pyramidal neurons. Hippocampus. 2012 Aug; 22(8): 1659-80.
51. Moita MA, Rosis S, Zhou Y, LeDoux JE, Blair HT. Putting fear in its place: remapping of hippocampal place cells during fear conditioning. J Neurosci. 2004; 24: 7015-7023.
52. Mullally SL, Maguire EA. Memory, Imagination, and Predicting the Future: A Common Brain Mechanism? Neuroscientist. 2013 Jul 11; 20(3): 220-234.
53. Muller RU, Kubie JL. The effects of changes in the environment on the spatial firing of hippocampal complex-spike cells. J Neurosci. 1987; 7: 1951-1968.
54. Neter J, Kutner MH, Nachtsheim CJ, and Wasserman W. Applied Linear Statistical Models, Vol. 4. Chicago, IL: Irwin; 1996, p. 318. 55. O'Carroll CM, Morris RG. Heterosynaptic co-activation of
glutamatergic and dopaminergic afferents is required to induce persistent long-term potentiation. Neuropharmacology. 2004 Sep; 47(3): 324-32.
56. O'Doherty JP, Dayan P, Friston K, Critchley H, Dolan RJ. Temporal difference models and reward-related learning in the human brain. Neuron. 2003; 38: 329-337.
57. Olafsdottir HF, Barry C, Saleem AB, Hassabis D, Spiers HJ. Hippocampal place cells construct reward related sequences through unexplored space. Elife. 2015; 4.
58. O'Keefe J, Nadal L. The hippocampus as a cognitive map. Oxford, Clarendn Press; 1978
59. O'Keefe J, Dostrovsky J. The hippocampus as a spatial map. Preliminary evidence from unit activity in the freely-moving rat. Brain Res. 1971; 34: 171-175.
60. Otmakhova NA, Lisman JE. D1/D5 dopamine receptor activation increases the magnitude of early long-term potentiation at CA1 hippocampal synapses. J Neurosci. 1996 Dec 1; 16(23): 7478-86. 61. Packard MG, Knowlton BJ. Learning and memory functions of the
basal ganglia. Annu Rev Neurosci. 2002; 25(1): 563-593.
62. Pfeiffer BE, Foster DJ. Hippocampal place-cell sequences depict future paths to remembered goals. Nature. 2013; 497: 74-79.
63. Rajasethupathy P, Sankaran S, Marshel JH, Kim CK, Ferenczi E, Lee SY. Projections from neocortex mediate top-down control of memory retrieval. Nature. 2015; 526: 653–659.
64. Ranck JB Jr. Studies on single neurons in dorsal hippocampal formation and septum in unrestrained rats. I. Behavioral correlates and firing repertoires. Exp Neurol. 1973 Nov; 41(2): 461-531. 65. Roesch MR, Calu DJ, Schoenbaum G. Dopamine neurons encode
the better option in rats deciding between differently delayed or sized rewards. Nat Neurosci. 2007 Dec; 10(12): 1615-24.
66. Rolls ET, and Treves A. Neural networks and brain function, Vol 572. Oxford university press Oxford; 1998.
67. Rosen ZB, Cheung S, Siegelbaum SA. Midbrain dopamine neurons bidirectionally regulate CA3-CA1 synaptic drive. Nat Neurosci. 2015 Dec; 18(12): 1763-71.
68. Samejima K, Ueda Y, Doya K, Kimura M. Representation of action-specific reward values in the striatum. Science. 2005; 310: 1337-1340.
69. Schacter DL, Addis DR, Hassabis D, Martin VC, Spreng RN, Szpunar KK. The future of memory: remembering, imagining, and the brain. Neuron. 2012 Nov 21; 76(4): 677-94.
70. Schmitzer-Torbert N, Jackson J, Henze D, Harris K, Redish AD. Quantitative measures of cluster quality for use in extracellular recordings. Neuroscience. 2005; 131: 1-11.
71. Schultz W, Dayan P, Montague PR. A neural substrate of prediction and reward. Science. 1997 Mar 14; 275(5306): 1593-9.
Cogn Sci. 2010 Oct; 14(10): 464-72.
73. Singer AC, Frank LM. Rewarded outcomes enhance reactivation of experience in the hippocampus. Neuron. 2009 Dec 24; 64(6): 910-21.
74. Shinohara Y, Hosoya A, Yahagi K, Ferecskó AS, Yaguchi K, Sík A. Hippocampal CA3 and CA2 have distinct bilateral innervation patterns to CA1 in rodents. Eur. J. Neurosci. 2012; 35: 702–710. 75. Smith DM, Mizumori SJ. Hippocampal place cells, context, and
episodic memory. Hippocampus. 2006; 16: 716-729.
76. Song EY, Kim YB, Kim YH, Jung MW. Role of active movement in place-specific firing of hippocampal neurons. Hippocampus. 2005; 15: 8-17.
77. Squire LR. Meory system of the brain : a brief history and current perpective. Neurobiol Learn Mem. 2004 Nov; 82(3): 171-7.
78. Sul JH, Kim H, Huh N, Lee D, Jung MW. Distinct roles of rodent orbitofrontal and medial prefrontal cortex in decision making. Neuron. 2010 May 13; 66(3): 449-60.
79. Sul JH, Jo S, Lee D, Jung MW. Role of rodent secondary motor cortex in value-based action selection. Nat Neurosci. 2011 Aug 14; 14(9): 1202-8.
80. Sutton RS, Barto AG. Reinforcement Learning. Cambridge MA, MIT Press; 1998.
81. Tamamaki N, Abe K, and Nojyo Y. Three-dimensional analysis of the whole axonal arbors originating from single CA2 pyramidal neurons in the rat hippocampus with the aid of a computer graphic technique. Brain Res. 1988; 452: 255–272.
82. Tanaka SC, Doya K, Okada G, Ueda K, Okamoto Y, Yamawaki S. Prediction of immediate and future rewards differentially recruits cortico-basal ganglia loops. Nat Neurosci. 2004; 7: 887– 893. 83. Tulving E: Episodic memory: from mind to brain. Annu Rev
Psychol. 2002; 53: 1-25.
84. Vazdarjanova A, Guzowski JF. Differences in hippocampal neuronal population responses to modifications of an environmental context: evidence for distinct, yet complementary, functions of CA3 and CA1 ensembles. J Neurosci. 2004 Dec; 24(29): 6489-6496. 85. Wimmer GE, Shohamy D. Preference by association: How memory mechanisms in the hippocampus bias decisions. Science. 2012; 338: 270–273.
86. Witter MP. A survey of the anatomy of the hippocampal formation, with emphasis on the septotemporal organization of its intrinsic and extrinsic connections. Adv. Exp. Med. Biol. 1986; 203: 67–82. 87. Witter MP. Organization of the entorhinal-hippocampal system: a
review of current anatomical data. Hippocampus. 1993; 3: 33–44. 88. Wood ER, Dudchenko PA, Robitsek RJ, Eichenbaum H:
Hippocampal neurons encode information about different types of memory episodes occurring in the same location. Neuron. 2000; 27: 623-633.
89. Wouterlood FG, Saldana E, and Witter MP. Projection from the nucleus reuniens thalami to the hippocampal region: light and electron microscopic tracing study in the rat with the anterograde tracer Phaseolus vulgaris-leucoagglutinin. J. Comp. Neurol. 1990; 296: 179–203.
contrast of STDP by dopaminergic modulation at hippocampal synapses. Proc Natl Acad Sci USA. 2009 Aug 4; 106(31): 13028-33.
-국문요약-