Atmos. Meas. Tech., 6, 445–455, 2013 www.atmos-meas-tech.net/6/445/2013/ doi:10.5194/amt-6-445-2013
© Author(s) 2013. CC Attribution 3.0 License.
EGU Journal Logos (RGB)
Advances in
Geosciences
Open Access
Natural Hazards
and Earth System
Sciences
Open AccessAnnales
Geophysicae
Open AccessNonlinear Processes
in Geophysics
Open AccessAtmospheric
Chemistry
and Physics
Open AccessAtmospheric
Chemistry
and Physics
Open Access DiscussionsAtmospheric
Measurement
Techniques
Open AccessAtmospheric
Measurement
Techniques
Open Access DiscussionsBiogeosciences
Open Access Open Access
Biogeosciences
Discussions
Climate
of the Past
Open Access Open Access
Climate
of the Past
Discussions
Earth System
Dynamics
Open Access Open Access
Earth System
Dynamics
DiscussionsGeoscientific
Instrumentation
Methods and
Data Systems
Open Access
Geoscientific
Instrumentation
Methods and
Data Systems
Open Access DiscussionsGeoscientific
Model Development
Open Access Open Access
Geoscientific
Model Development
DiscussionsHydrology and
Earth System
Sciences
Open AccessHydrology and
Earth System
Sciences
Open Access DiscussionsOcean Science
Open Access Open Access
Ocean Science
Discussions
Solid Earth
Open Access Open Access
Solid Earth
DiscussionsThe Cryosphere
Open Access Open Access
The Cryosphere
DiscussionsNatural Hazards
and Earth System
Sciences
Open Access
Discussions
Comparison between MODIS and AIRS/AMSU
satellite-derived surface skin temperatures
Y.-R. Lee1,2, J.-M.Yoo1, M.-J. Jeong3, Y.-I. Won4, T. Hearty4, and D.-B. Shin2
1Dept. of Science Education, Ewha Womans University, Seoul, Republic of Korea 2Dept. of Atmospheric Sciences, Yonsei University, Seoul, Republic of Korea
3Dept. of Atmospheric and Environmental Sciences, Gangneung-Wonju National University, Gangneung, Republic of Korea 4Wyle ST&E, NASA/GSFC, Maryland, USA
Correspondence to: J.-M. Yoo (yjm@ewha.ac.kr)
Received: 18 August 2012 – Published in Atmos. Meas. Tech. Discuss.: 9 October 2012 Revised: 15 January 2013 – Accepted: 1 February 2013 – Published: 20 February 2013
Abstract. Surface skin temperatures of the Level 3
prod-ucts of MODIS Collection 5 (C5) and AIRS/AMSU version 5 (V5) have been compared in terms of monthly anomaly trends and climatologies over the globe during the period from September 2002 to August 2011. The MODIS temper-atures in the 50◦N–50◦S region tend to systematically be ∼1.7 K colder over land and ∼ 0.5 K warmer over ocean than the AIRS/AMSU temperatures. Over high latitude ocean the MODIS sea surface temperature (SST) values are ∼ 5.5 K warmer than the AIRS/AMSU. The discrepancies between the annual averages of the two sensors are as much as ∼12 K in the sea ice regions. Meanwhile, the MODIS ice surface temperature product (MYD29E1D) over the ocean is in better agreement with AIRS/AMSU temperatures, show-ing a root mean square error of 3.7–3.9 K. The disagree-ment between the two sensors results mainly from the dif-ferences in ice/snow emissivity between MODIS infrared and AMSU microwave, and also in their observational local times. Both MODIS and AIRS/AMSU show cooling rates from −0.05 ± 0.06 to −0.14 ± 0.07 K 9 yr−1over the globe, but warming rates (0.02 ± 0.12 –0.15 ± 0.19 K 9 yr−1) in the high latitude regions.
1 Introduction
The surface skin temperature is a key variable for climate change and surface energy balance studies and is impor-tant for our understanding of the biological and environ-mental processes in association with the ecosystem and soil
characteristics (Jin et al., 1997). Therefore, systematic ob-servations with good temporal and spatial coverage from satellites are crucial for the analysis of the temperatures as well as for their trends for understanding the interaction between the atmospheric environment and climate change (e.g. Susskind and Molnar, 2008). The MODerate resolution Imaging Spectroradiometer (MODIS) and the Atmospheric Infrared Sounder (AIRS)/the Advanced Microwave Sound-ing Unit-A (AMSU-A; hereafter named AMSU) instruments onboard the Earth Observing System (EOS) Aqua satellite, launched in 2002, provide an array of atmospheric and sur-face measurements with an unprecedented accuracy over the globe including the surface skin temperature (Wan et al., 2004; Susskind et al., 2011). MODIS has better spatial reso-lution than AIRS/AMSU, while the latter has more spectral information by taking advantage of hyperspectral IR mea-surements combined with microwave observations (Schreier et al., 2010). However, since the satellite-derived data include uncertainties, they need to be validated with the independent ground-based or satellite observations (e.g. Knuteson et al., 2006; Schreier et al., 2010; Armstrong et al., 2012). Further-more it is appropriate to compare MODIS and AIRS/AMSU, loaded on the same satellite, because they match well in the observational time and space (Tobin et al., 2006).
Yoo et al. (2003) showed that the dependence of emissiv-ity on certain surface features (e.g. sea ice and water) could lead to different surface skin temperatures and trends. Sur-face emissivity uncertainties of ∼ 1 % can result in temper-ature errors of 1–2 K, based on the radiative transfer calcu-lation for Microwave Sounding Unit (MSU) channel 1 at
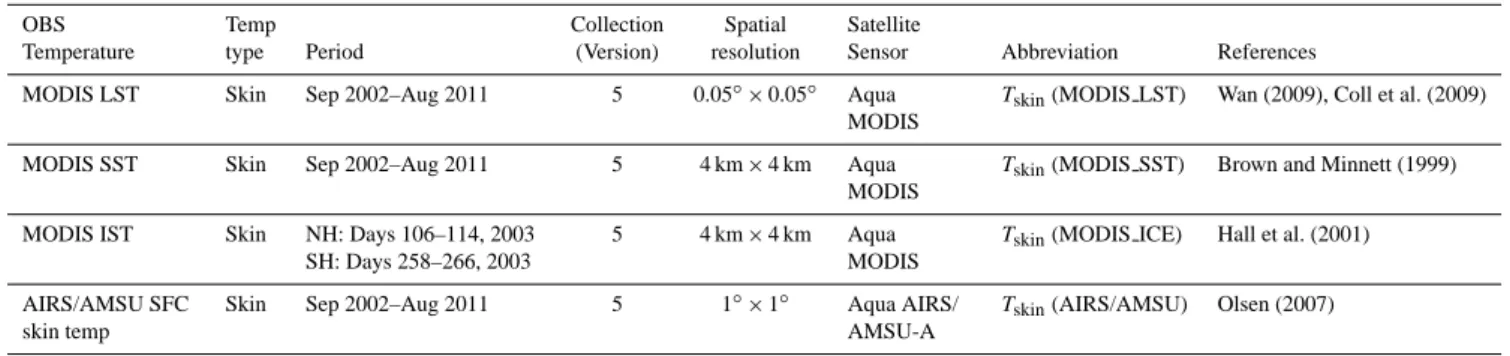
Table 1. The satellite data information during the period from September 2002 to August 2011 used in this study. Here the abbreviations are as follows; LST (land surface-skin temperature), temp (temperature), SST (sea surface-skin temperature), IST (ice surface skin temperature), NH (Northern Hemisphere), and SH (Southern Hemisphere).
OBS Temp Collection Spatial Satellite
Temperature type Period (Version) resolution Sensor Abbreviation References
MODIS LST Skin Sep 2002–Aug 2011 5 0.05◦×0.05◦ Aqua
MODIS
Tskin(MODIS LST) Wan (2009), Coll et al. (2009)
MODIS SST Skin Sep 2002–Aug 2011 5 4 km × 4 km Aqua
MODIS
Tskin(MODIS SST) Brown and Minnett (1999)
MODIS IST Skin NH: Days 106–114, 2003
SH: Days 258–266, 2003
5 4 km × 4 km Aqua
MODIS
Tskin(MODIS ICE) Hall et al. (2001)
AIRS/AMSU SFC skin temp
Skin Sep 2002–Aug 2011 5 1◦×1◦ Aqua AIRS/
AMSU-A
Tskin(AIRS/AMSU) Olsen (2007)
50.3 GHz (Prabhakara et al., 1995). An emissivity error of 1.5 % at 8.6 µm also causes a land surface skin tempera-ture (LST) error of ∼ 1 K at a temperatempera-ture of 300 K (Hul-ley et al., 2009). Furthermore, calibration/validation stud-ies show that the MODIS temperature over the ocean can be considered as the bulk sea surface temperature rather than the skin temperature (Yuan, 2009; Barton, 2011). The MODIS bulk temperatures tend to be ∼ 0.2 K warmer than the Marine-Atmospheric Emitted Radiance Interferometer (M-AERI) skin temperatures for well-mixed layers at night (Donlon et al., 2002). The air–sea heat exchange can cool the sea surface skin layer producing the near-surface temperature gradient (Minnett et al., 2001; Donlon et al., 2002).
Schreier et al. (2010) compared brightness temperatures over the globe between MODIS and AIRS using spectrally and spatially collocated radiances for one day. The mean difference in Level 1b brightness temperatures of IR win-dow channels between the MODIS and AIRS over the globe was within 0.1 K, based on two days of observations (Tobin et al., 2006). However, the maximum differences in the re-gional averages of the Level 3 (L3) LST products between MODIS version 4 (V4) and AIRS version 3 (V3) over the United States were reported to be over 2 K depending on the season (Knuteson et al., 2006). Thus, critical assessment is needed of these products via extensive intercomparisons be-tween the satellite datasets, because each product from the retrieval algorithm has its own pros and cons (e.g. Knute-son et al., 2006; Schreier et al., 2010). So far, the compariKnute-son between MODIS and AIRS/AMSU L3 surface skin tempera-tures has not been carried out with respect to different global environments (e.g. mixed condition of seasonally varying sea ice and open water) despite their importance in environmen-tal and climatic change studies. The primary purpose of this study is to investigate the characteristics of the differences between MODIS and AIRS/AMSU surface skin tempera-tures in terms of their trends and climatology over the globe during the recent 9-yr period.
2 Data and method
The L3 gridded monthly surface skin temperature data have been obtained from MODIS C5 and AIRS/AMSU V5 on-board the Aqua satellite during the period from Septem-ber 2002 to August 2011 (Table 1). The AIRS/AMSU L3 monthly mean products are available for the climate change analysis (e.g. trend) over a decade with low systematic errors (Harris, 2007). The satellite has the local equatorial crossing time (LECT) of 01:30 (descending) and 13:30 (ascending). The AIRS/AMSU retrieval process is discussed in detail by Susskind et al. (2011). The AIRS/AMSU monthly temper-ature data (AIRXSTM), which have 1◦×1◦ spatial resolu-tion over the globe, were used in this study. The AIRS has a 1650-km-wide swath and 2378 channels in the 3.7–15.4 µm wavelength range. The AIRS on-orbit radiometric and spec-tral calibration is consistent with preflight estimates, and the instrument is stable (Pagano et al., 2002, 2006). AIRS is co-located with AMSU, which has microwave channels that are less affected by clouds (Susskind et al., 2003). AMSU has 15 microwave channels at 23–89 GHz; moreover, it consists of 12 oxygen bands (50–60 GHz) in order to retrieve the tem-perature profiles. Mo (2010) showed that AMSU-A opera-tional calibration algorithms work well and meet prelaunch measured values. The AIRS/AMSU suite is used to derive cloud-cleared radiance in up to 90 % cloud cover (Susskind et al., 2006, 2011). On the other hand, the MODIS data have been retrieved only under clear sky conditions by the cloud detection method (Ackerman et al., 1998).
The MODIS has 36 visible and infrared channels in the range of 0.4–14.4 µm with a swath of 2330 km, and the sur-face information is obtained using its atmospheric window channels (Wan and Dozier, 1996). The MODIS surface skin temperature is composed of LST and SST (Table 1). The C5 L3 monthly MODIS LST data (MYD11C3.5) and the standard mapped image of SST C5 data were used in this study. Compared to the C5 day/night algorithm, which has been used to derive LST, the C4 algorithm tended to over-estimate LST and underover-estimate emissivity when compared
with ground-based observations. A refined day/night algo-rithm was implemented for C5, but C4 was still better over the desert (http://modis-land.gsfc.nasa.gov/temp.html). The MODIS C5 has more spatial coverage than C4 particularly at high altitude regions (Wan, 2012). The MODIS LST was retrieved from the day/night algorithm (Wan and Li, 1997), whereas MODIS SST was retrieved by the brightness tem-perature difference between 11 µm and 12 µm channels (Min-nett et al., 2004). The accuracy of the MODIS LST retrieved from the day/night algorithm was reported to be better than 1 K for the clear sky in the temperature range of −10◦C to 50◦C (Wan et al., 2004). The MODIS SST showed dis-crepancies of −0.03 to 0.01◦C over the daily data com-pared to buoy measurements (Haines et al., 2007). Xiong et al. (2011) reported that MODIS could provide high quality data through on-orbit calibration. The MODIS data in this study were re-binned to a 1◦×1◦grid in order to avoid the effect of the difference in the spatial resolution when com-pared to AIRS/AMSU, although the original spatial resolu-tions of LST and SST are 5 km × 5 km and 4 km × 4 km, re-spectively.
In addition, the Collection 5 MODIS ice surface tem-perature (IST; MYD29E1D) and AIRS/AMSU surface skin temperature over the ocean have been compared using 9-day composite datasets (Table 1). The MODIS sea ice al-gorithm detects ice utilizing the reflectance in visible and near-infrared bands and retrieves temperature based on a split window technique using the 11–12 µm atmospheric window bands (Hall et al., 2004). The root mean square error (RMSE) of the MODIS IST is 1.2–1.3 K under clear sky conditions, and the cutoff temperature between open water and sea ice is reported at ∼ 271.5 K (Hall et al., 2004). The time span of the data used in this comparison is 16–24 April 2003 for the Northern Hemisphere and 15–23 September 2003 for the Southern Hemisphere (http://modis-snow-ice.gsfc.nasa.gov/ ?c=MOD29E1D).
The MODIS data have been converted from the original spatial resolution (∼ 4 × 4 km) to a 1◦×1◦grid and are used only when the number of pixels exceeds ∼ 50 % of the possi-ble observations in a 1◦×1◦grid box (Fig. A1). In 5 degree latitudinal belts, uncertainties due to the grid conversion are within ± 1 K, except the two belts from 75 to 85◦S region near the coast of Antarctica (not shown). The difference of the average temperature for both hemispheres between orig-inal (∼ 4 × 4 km) and converted resolution (1◦×1◦) is less than ± 0.07 K. Here, area weighting is applied to calculate average values for both hemispheres.
We calculated the climatology and anomaly values from the monthly mean temperatures in a 1◦×1◦grid during the recent 9 yr in order to estimate temperature anomaly trends. Since these trends are likely dominated by interannual and/or decadal variations, we use the trends for convenience to de-scribe the time rate of change for the years of MODIS and AIRS/AMSU observations. The climatology was obtained only when both MODIS and AIRS/AMSU data were
avail-20 a) Tskin(MODIS) b) Tskin(AIRS/AMSU)
c) Tskin(MODIS) minus Tskin(AIRS/AMSU)
(K)
d) Tskin(MODIS) minus Tskin(AIRS/AMSU)
(K)
1
(K)
1 2
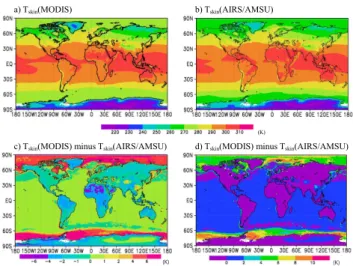
Figure 1. Climatological annual surface skin temperatures (K) during the period from 3
September 2002 to August 2011. a) Tskin(MODIS), b) Tskin(AIRS/AMSU), c) and d) the 4
difference between Tskin(MODIS) and Tskin(AIRS/AMSU). Note that color bars in Figs. 1c-d 5
have the different scales. 6
7
Fig. 1. Climatological annual surface skin temperatures (K) dur-ing the period from September 2002 to August 2011. (a) Tskin
(MODIS), (b) Tskin(AIRS/AMSU), (c) and (d) the difference
be-tween Tskin (MODIS) and Tskin (AIRS/AMSU). Note that color
bars in Fig. 1c–d have different scales.
able. The trends were derived only when the number of monthly data was at least 107 out of 108 whole months at each grid point. Linear interpolation was used to produce continuous time series. Area weighting is applied to the trend analysis over the globe.
The bootstrap method (Wilks, 1995) was used in the anal-ysis to calculate the 95 % confidence interval. Briefly 10 000 linear temperature trends have been generated by random sampling of 10 000 monthly anomaly temperature datasets. The sampling was carried out by choosing data out of the time series of temperature anomalies, allowing repetition. Next we estimate the 95 % confidence interval of 10 000 tem-perature trends.
3 Intercomparison of surface skin temperatures from MODIS and AIRS/AMSU
The climatological annual-mean surface skin temperatures from MODIS and AIRS/AMSU during the period of Septem-ber 2002 to August 2011 were investigated over the globe (Fig. 1a–b). The temperature differences between the two sensors are shown in Fig. 1c: the differences over land are significant in barren areas (e.g. desert and plateau). Wan (2011) suggested that there might be large errors in the MODIS LST in the desert regions due to large uncertainties in surface emission, and further the LSTs tend to be underes-timated in the bare soil areas. The MODIS temperatures over high latitude oceans are more than 4 K higher than those of AIRS/AMSU (Fig. 1c–d).
In the 50◦N–50◦S region, MODIS temperatures are lower by ∼ 1.7 K over land than those of AIRS/AMSU, but higher by ∼ 0.5 K over the ocean (Fig. 1c–d; see also bias values
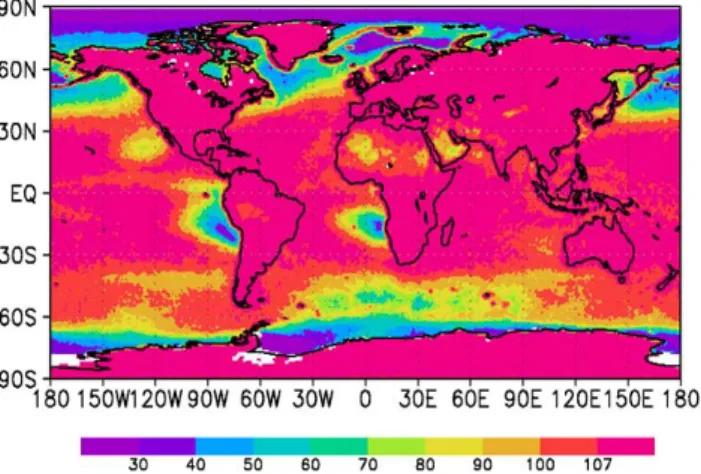
Fig. 2. The number of observations of both Tskin (MODIS) and
Tskin (AIRS/AMSU) data commonly available during the period
from September 2002 to August 2011.
in Table 2). Overall, the MODIS values are systematically lower than those from the AIRS/AMSU over the land, but they are higher over the ocean (Fig. 1d). This MODIS ten-dency over land in this study is consistent with that of Wan (2011). On the other hand, Hulley et al. (2009) reported that the error in the AIRS/AMSU temperature over an arid region of the Namib Desert was ∼ 1.5 K due to uncertainties of land surface emissivity (LSE). The error is within the dif-ference from −2 K to −1 K of our study between MODIS and AIRS/AMSU (Fig. 1c).
There are some exceptional areas to the oceanic tendency (e.g. warm ocean current extensions of Kuroshio and Gulf, Antarctic circumpolar current) (Fig. 1d). Since the number of observations in these areas is much less than 108 whole monthly values (Fig. 2), the tendency is caused by sampling issues that are related to the cloud detection/clearing pro-cesses of the sensor measurements (Ackerman et al., 1998; Susskind et al., 2003).
The relationship between MODIS and AIRS/AMSU on the climatological annual-mean surface skin temperatures is presented in the scatter diagrams (Fig. 3). In order to ana-lyze the effect of sea ice/snow on the high latitude tempera-tures from the two sensor measurements, the scatter patterns of the above relationship are examined over the globe and the 50◦N–50◦S region, respectively. The MODIS-observed values less than 271 K are not shown over the global ocean (Fig. 3a). However, the AIRS/AMSU temperatures, which correspond to the MODIS values around 271–272 K range from 259 K to 271 K, illustrate a curved pattern.
The correlations (r = 0.990–0.999) over the two regions between MODIS and AIRS/AMSU are almost the same. However, the bias value (1.84 K) over the global ocean is much larger than that (0.51 K) over the 50◦N–50◦S ocean (Fig. 3a–b; Table 2). The curved shape does not appear over the 50◦N–50◦S ocean (Fig. 3b). This indicates that the discrepancies between the two sensors mostly occur over
Fig. 3. Scatter diagrams in climatological annual average tempera-ture (K) of Tskin(MODIS) versus Tskin(AIRS/AMSU) during the
period from September 2002 to August 2011 over the regions of (a) global ocean, (b) the 50◦N–50◦S ocean, (c) global land, and (d) the 50◦N–50◦S land. The values of AIRS/AMSU and MODIS have been compared with each other in a grid box of 1◦×1◦.
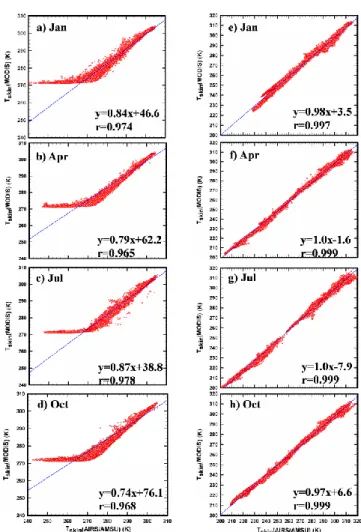
the high latitude oceans due to the sea ice/snow, particu-larly in the Arctic region rather than in the Antarctic re-gion (Fig. 4). Thus, the discrepancies vary seasonally show-ing the maximum in boreal winter (January) over the ocean (Fig. 5). These discrepancies may result from the facts that (1) the monthly MODIS SST could be biased toward warmer temperatures due to preset values of its algorithm for ob-vious icy sea surface skin conditions; (2) incapability of MODIS bands to detect ice/snow surfaces under very low (or no) illumination conditions in the polar regions; (3) the AIRS/AMSU IR/microwave channels are more sensitive to the surface emission (i.e. surface classification) over the sea ice/snow, compared to the MODIS visible and IR bands; and (4) AIRS/AMSU channels have a much larger footprint so that ice/snow and water can be mixed within a footprint. As mentioned earlier, since MODIS oceanic products can also be regarded as bulk sea surface temperatures rather than skin-layer ones (Yuan, 2009; Barton, 2011), their values are expected to be higher than ∼ 271 K.
The global skin temperature variations (213–314 K) over land are about twice as large as those (259–304 K) over the ocean (Fig. 3a and c). In these figures the linear relation-ship over the global land is clearly shown without the curved pattern as seen in the global ocean. The temperature val-ues of MODIS and AIRS/AMSU over the globe are in good agreement (r ≥ 0.99; Fig. 3 and Table 2).
Table 2. Comparison of MODIS vs. AIRS/AMSU surface skin temperatures for their climatological annual average and monthly anomaly trends over the regions of ocean, land, and globe, respectively. Bias: MODIS minus AIRS/AMSU, r: correlation coefficient, RMSE: root mean square error. The values in parentheses indicate 50◦N–50◦S regions of the ocean and the land, respectively.
MODIS vs. AIRS/AMSU Climatology Trend
Bias (K) r RMSE (K) Bias (K yr−1) r RMSE (K yr−1)
Ocean 1.841 0.990 3.133 2.85 × 10⁻⁵ 0.898 3.27 × 10⁻² (0.513) (0.998) (0.656) (−1.49 × 10⁻⁴) (0.934) (2.44 × 10⁻²) Land −1.517 0.999 1.991 1.33 × 10⁻² 0.898 6.24 × 10⁻² (−1.726) (0.991) (2.233) (4.72 × 10⁻²) (0.882) (7.98 × 10⁻²) Globe 0.710 0.992 2.801 6.51 × 10⁻³ 0.896 4.95 × 10⁻² 23 1 2
Figure 4. Same as in Fig. 3, except for the oceans at a) 60-90 N and b) 60-90 S. 3
4
Fig. 4. Same as in Fig. 3, except for the oceans at (a) 60–90◦N and (b) 60–90◦S.
4 Intercomparison of surface skin temperature trends from MODIS and AIRS/AMSU
The monthly surface skin temperature anomaly trends from MODIS and AIRS/AMSU, and their differences over the globe in a grid box of 1◦×1◦ are shown in Fig. 6. There are large numbers of missing observations over the ocean compared to those over land (see also Fig. 2). Warm-ing trends in the polar regions are detected by both in-struments, particularly in the Arctic (0.1 to 0.4 K yr−1) (Fig. 6a–b). Based on the spatial average temperature over a given area, warming (0.021–0.146 K 9 yr−1) is observed by both measurements in polar regions (60–90◦N, 60– 90◦S), while cooling (−0.019 to −0.401 K 9 yr−1) is ob-served in most lower latitude regions (Table 3). In the ta-ble, the average difference (MODIS minus AIRS/AMSU) over the whole globe is 0.086 K 9 yr−1. This indicates that MODIS has a warming tendency compared to AIRS/AMSU, showing a positive bias of 0.059 K 9 yr−1, which is
glob-ally averaged from each grid value (Table 2 and Fig. 6c). The difference is the largest (0.261 K 9 yr−1) in the south-ern hemispheric mid-latitude region (Table 3 and Fig. 6c). Here, MODIS shows a warming rate (0.013 K 9 yr−1), while AIRS/AMSU demonstrates a statistically significant cool-ing trend (−0.248 K 9 yr−1). Also MODIS globally presents more warming rate than AIRS/AMSU, except for the high latitude region in the Northern Hemisphere. Compared to
Fig. 5. Scatter diagrams in climatological monthly mean values (K) of Tskin(MODIS) versus Tskin(AIRS/AMSU) over the global
ocean in (a) January, (b) April, (c) July, and (d) October. Figure 5e– h are the same as Fig. 5a–d, but for global land. The values of AIRS/AMSU and MODIS have been examined in a grid box of 1◦×1◦during the period from September 2002 to August 2011.
25
1
2
Figure 6. Satellite-derived monthly temperature anomaly trends (K yr
-1) in a grid box of 1°×1°
3
over the globe during the period from September 2002 to August 2011 for the a)
4
T
skin(MODIS) and b) T
skin(AIRS/AMSU), and c) the difference in thermal trend between the
5
two temperatures (i.e., T
skin(MODIS) minus T
skin(AIRS/AMSU)).
6
7
Fig. 6. Satellite-derived monthly temperature anomaly trends (K yr−1)in a grid box of 1◦×1◦over the globe during the period from September 2002 to August 2011 for the (a) Tskin (MODIS)
and (b) Tskin (AIRS/AMSU), and (c) the difference in thermal
trend between the two temperatures (i.e. Tskin(MODIS) minus Tskin
(AIRS/AMSU)).
the AIRS/AMSU trends, the MODIS values reveal substan-tial warming (0.1–0.4 K yr−1), particularly in the barren ar-eas (e.g. desert and plateau) (Fig. 6c). In these arar-eas, the MODIS LST values are likely to have large uncertainties be-cause of the problem in the classification-based emissivity
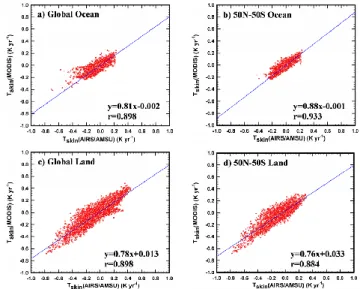
Fig. 7. Scatter diagrams in the monthly temperature anomaly trends (K yr−1)of Tskin(MODIS) versus Tskin(AIRS/AMSU) over the
re-gions of (a) global ocean, (b) the 50◦N–50◦S ocean, (c) global land, and (d) the 50◦N–50◦S Land. The values of AIRS/AMSU and MODIS have been compared with each other in a grid box of 1◦×1◦.
(Wan, 2011). The trend estimates from the two sensor mea-surements are generally in agreement within ± 0.1 K yr−1.
In order to compare the surface skin temperature trends measured from the MODIS and AIRS/AMSU, their scat-ter plots are shown over the globe and the 50◦N–50◦S re-gion, respectively (Fig. 7). The correlations between the two sensor measurements over the ocean and land regions range from 0.88 to 0.93. The correlation (r = 0.93) over the 50◦N– 50◦S ocean is somewhat higher than that (r = 0.90) over the global ocean (Fig. 7a–b). Thus, the disagreement between the two sensor measurements results from the estimates over the high latitude oceans.
The surface skin temperature trends from MODIS at the grid of 1◦×1◦ reveal more warming values than those from AIRS/AMSU over the high latitude oceans where sea ice/snow exists (Fig. 7a–b). The trend varia-tions (−0.77–0.48 K yr−1) over land are larger than those (−0.71–0.25 K yr−1) over the ocean (Fig. 7a and c). A kink is found in the scatter diagram over the global land at AIRS/AMSU (0.20–0.33 K yr−1) and MODIS (0.00– 0.05 K yr−1) (Fig. 7c). This does not occur over the 50◦N– 50◦S land, implying that the disagreement of the trends be-tween the two sensor measurements mainly appears over the high latitude snow/ice areas (Fig. 7d). The disagreement therefore may be attributed in part to the fact that the AMSU microwave data are more sensitive to ice/snow than the IR data from MODIS. Microwave emissivity values for sea ice can depend on the following factors: snow/ice types, compo-sition, edge, age, thickness, surface characteristics, incidence angle, frequency, polarization, ocean currents, weather, etc
Table 3. The rate of the surface skin temperature change (K yr−1)of MODIS and AIRS/AMSU over the nine global areas during the period from September 2002 to August 2011. The ± values define the 95 % confidence intervals for the trends. The values in parentheses indicate the rates of temperature change (K 9 yr−1)for the whole period. Note that the rates are subject to large uncertainty due to the short periods of the satellite-based temperature records.
Tskin Tskin MODIS minus
Area (MODIS) (AIRS/AMSU) AIRS/AMSU
60–90◦N 0.013 ± 0.018 (0.113 ± 0.162) 0.016 ± 0.021 (0.146 ± 0.191) −0.004 (−0.033) 30–60◦N −0.002 ± 0.023 (−0.019 ± 0.209) −0.011 ± 0.028 (−0.101 ± 0.252) 0.009 (0.082) 0–30◦N −0.008 ± 0.007 (−0.068 ± 0.067) −0.019 ± 0.009 (−0.168 ± 0.077) 0.011 (0.101) 0–30◦S −0.026 ± 0.012 (−0.234 ± 0.104) −0.045 ± 0.012 (−0.401 ± 0.110) 0.019 (0.167) 30–60◦S 0.001 ± 0.007 (0.013 ± 0.063) −0.028 ± 0.008 (−0.248 ± 0.0716) 0.029 (0.261) 60–90◦S 0.003 ± 0.014 (0.025 ± 0.129) 0.002 ± 0.014 (0.021 ± 0.124) 0.001 (0.005) Globe −0.006 ± 0.007 (−0.050 ± 0.059) −0.015 ± 0.008 (−0.135 ± 0.072) 0.010 (0.086)
(e.g. Weeks, 1981; Kidder and Vonder Harr, 1995; Isaacs et al., 1989; Grenfell, 1992).
The MODIS surface skin temperature is retrieved from a clear sky condition, whereas the AIRS/AMSU surface skin temperature can be retrieved under a partially cloudy con-dition (Susskind et al., 2003). The cloud effect may influ-ence the temperature differinflu-ence between the two sensor mea-surements, because the monthly mean products are calcu-lated from the daily averages, which are affected by clouds. Yuan (2009) reported that MODIS might have more cloud contamination problems than AIRS/AMSU over the ocean. Thus, the effect of different observational channels (e.g. IR and microwave) can lead to a temperature difference. In or-der to estimate the cloud-cleared radiances, MODIS utilizes only the infrared channels, whereas the AIRS/AMSU uses both the IR and microwave channels.
The MODIS surface skin temperature over the ocean is similar to the bulk sea surface temperature, because MODIS oceanic products have been calibrated by in situ measurements (Yuan, 2009; Barton, 2011). On the other hand, the AIRS/AMSU surface skin temperature over the ocean corresponds to a skin-layer temperature of 10–100 µm depth (Yuan, 2009). Since the skin temperature is typi-cally lower than the bulk temperature (Donlon et al., 2002), AIRS/AMSU is expected to be lower by ∼ 0.2 K than MODIS.
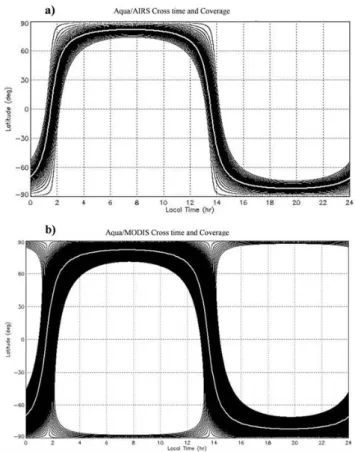
In order to investigate the effect of the satellite local cross-ing time (LCT) on the surface skin temperature, the tracks for MODIS and AIRS/AMSU on 1 January 2009 are displayed as a function of LCT and latitude (Fig. 8). The LCTs of MODIS and AIRS/AMSU onboard the same Aqua satellite are almost the same over the 60◦N–60◦S region. However, since the different scan angles from the two instruments view a different range of areas, there are substantial LCT differ-ences between them in the high latitude regions. The MODIS LCT variations are greater than those of the AIRS/AMSU, because the MODIS swath (2330 km) is wider than that of the AIRS/AMSU (1650 km). The differences are within two
Fig. 8. The latitude vs. local time plots of cross time tracks and data coverage from (a) AIRS/AMSU and (b) MODIS on 1 January 2009. The MODIS footprints cover a slightly wider area than those of AIRS/AMSU. Here, the nadir tracks are shown in white solid lines.
hours in the low latitude regions but can be up to several hours in high latitude regions. This LCT effect has been men-tioned for MODIS/Terra (Jin and Dickinson, 2010). Thus, the disagreement in surface skin temperatures between MODIS and AIRS/AMSU may be partially due to the LCT differ-ence.
5 Discussions and conclusions
The satellite-derived surface skin temperatures of the L3 products of MODIS C5 and AIRS/AMSU V5 have been compared in terms of monthly anomaly trends and climatol-ogy over the globe during the period from September 2002 to August 2011. The MODIS temperatures in the 50◦N–50◦S region tend to be systematically lower than the AIRS/AMSU values by ∼ 1.7 K over land, but are larger by ∼ 0.5 K over the ocean. MODIS oceanic products are greater by ∼ 5.5 K over high latitude oceans than the AIRS/AMSU skin esti-mates. This is mainly due to the differences in ice/snow emis-sivity between MODIS infrared and AMSU microwave, and between the surface skin and bulk sea surface temperatures. The MODIS annual averages in the sea ice regions for the pe-riod can be up to ∼ 12 K larger than the AIRS/AMSU values. The MODIS and AIRS/AMSU values indicate warming rates (0.02 ± 0.12 to 0.15 ± 0.19 K 9 yr−1), particularly in
the high latitude regions of both hemispheres (Note that the trends are subject to large uncertainty due to the short pe-riods of the satellite-based temperature records.). However, cooling rates of −0.05 ± 0.06 and −0.14 ± 0.07 K 9 yr−1 over the globe have been derived from both MODIS and AIRS/AMSU, respectively. Uncertainties in temperatures due to the LCT difference between the two sensors are large in high latitude regions.
The 9-day composite data from the MODIS ISTs and AIRS/AMSU surface skin temperatures have been com-pared over the northern and southern hemispheric oceans, respectively (Figs. A1c–d and A2a–b). The difference be-tween Tskin(MODIS ICE) and Tskin(AIRS/AMSU) is shown
in Fig. A2c–d. The comparison shows a bias by 0.180 K (MODIS minus AIRS/AMSU) over the region northward of 35◦N, and by 0.027 K over the region southward of 35◦S (Table A1). The positive bias over both hemispheres indi-cates that MODIS IST is warmer than the AIRS/AMSU surface skin temperature. This tendency appears more dis-tinctly over the latitudinal belts of 50–80◦N and 55– 70◦S (Fig. A2c–d). The RMSE is in the range of 3.7– 3.9 K (Table A1).
The scatter diagrams show the relationships between Tskin(MODIS ICE) and Tskin(AIRS/AMSU) over the
hemi-spheric regions poleward either from 35◦N or 35◦S, re-spectively (Fig. A3). The correlations over these regions are 0.94–0.95 (see also Table A1). The curved shape of Tskin
(MODIS), which is shown in Fig. 3a, does not appear in Tskin(MODIS ICE), but the discrepancies still exist over the
high latitude regions. Note that there are larger discrepancies between MODIS and AIRS/AMSU near the freezing tem-perature and below (e.g. Figs. 5 and A3). Overall, although the difference between MODIS IST and AIRS/AMSU sur-face skin temperature is smaller than the difference between MODIS SST and AIRS/AMSU surface skin temperature, discrepancies still occur at 60–65◦N and 75–80◦S of high latitude regions (Fig. A2c–d).
The MODIS sea ice algorithm uses reflectance in the visi-ble and near infrared. The polar night may affect the accuracy of sea ice detection, because the MODIS visible channel can-not be available during night (Hall et al., 2001; Ciappa et al., 2012). Another source of differences between the MODIS IST and AIRS/AMSU surface skin temperature may come from clouds. Because the MODIS IST is retrieved from clear sky conditions, the MODIS IST accuracy depends on the cloud mask algorithm, but it is often difficult to identify clouds over sea ice using visible, near infrared and infrared channels, especially during conditions of thin fog or clouds (Hall et al., 2004, 2012).
While the accuracy of the sensors may influence the re-sults, its assessment is beyond the scope of this study. Since monthly L3 products of MODIS and AIRS/AMSU have been derived from a different number of daily observations, some intrinsic uncertainties exist in the comparison between the two instrument products. However, the difference between them over the sea ice is so large and systematic that the daily observation issue is unlikely to be important. We fo-cused on the characteristics of IR and microwave channels in remote sensing, which influence the uncertainties of sur-face skin temperatures. The cloud detection/clearing prob-lems of MODIS and AIRS/AMSU can have some influence on the temperatures and their trends (Ackerman et al., 1998; Susskind et al., 2003). The C5 LST errors of MODIS C5 and AIRS/AMSU V5 have been mentioned in previous studies of Wan (2011) and Hulley et al. (2009), respectively, and thus improvements for their future algorithms are currently under development.
In our study, we addressed the uncertainties of surface skin temperatures over the high-latitude sea ice/snow re-gions, with emphasis on the benefit of microwave channels. Even combined infrared and microwave (AIRS/AMSU) sur-face skin retrieval cannot be successful under complete over-cast conditions (Susskind et al., 2011). The V5 AIRS-Only (AO) algorithm was developed for the event of a failure of the AMSU-A instrument, and the algorithm without using microwave channels could provide useful SST information over non-frozen ocean (Susskind et al., 2011), but not in the high-latitude sea ice region unless the information for sur-face classification is given. The MODIS without originally utilizing microwave channels has the same problem as likely would be experienced by the AIRS-Only algorithm over the sea ice region. Compared to microwave, the visible and in-frared channel remote sensing fundamentally has limitations over the sea ice/snow regions during night.
Since AMSU channels 4 and 5 have degraded (Fetzer and Manning, 2012), another microwave instrument (e.g. Ad-vanced Technology Microwave Sounder; ATMS) could be used for the sea-ice detection from AIRS. Algorithm de-velopers need to analyze the systematic difference be-tween the two instruments’ temperature over ocean and land from 50◦N–50◦S, and furthermore the large discrepancies over the sea-ice regions between AIRS/AMSU surface skin
Appendix A
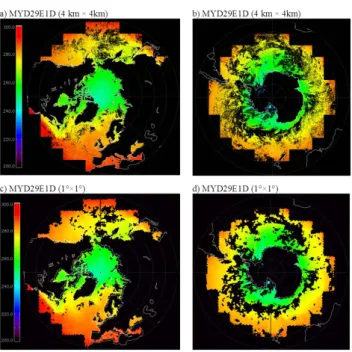
Fig. A1. 9-day composite surface skin temperatures (K) of MODIS/Aqua data (MYD29E1D; Tskin(MODIS ICE)) over the
(a) Northern Hemisphere during the days 106–114, 2003, and (b) Southern Hemisphere during the days 258–266, 2003
(http://modis-snow-ice.gsfc.nasa.gov/?c=MOD29E1D). The temperature is called ice surface temperature (IST) in the reference. The MYD29E1D data at ∼ 4 km × 4 km spatial resolution have been reconstructed to 1◦×1◦bin for the
comparison with AIRS/AMSU data. (c) Same as Fig. A1a and (d) same as Fig. A1b, except for the spatial resolution of 1◦×1◦.
Table A1. Comparison of 9-day composite Tskin(MODIS ICE) and Tskin(AIRS/AMSU). Bias: MODIS minus AIRS/AMSU,
r: correlation coefficient, RMSE: root mean square error. MODIS vs. AIRS/AMSU Bias (K) r RMSE (K) Northern Hemisphere (northward of 35◦N) 0.180 0.953 3.690 Southern Hemisphere (southward of 35◦S) 0.027 0.939 3.851
temperature and MODIS bulk sea surface temperature. It will be very useful, if the algorithm developers for the two in-struments provide their users with both skin sea surface tem-perature and bulk sea surface temtem-perature. Over the sea-ice regions, however, the attempt may still be possible for the AIRS/AMSU algorithm, but it would be more challenging for the MODIS algorithm, considering its current difficulty in detecting sea ice. Climatologists have to carefully use the sur-face skin temperature data from the two instruments, based
Fig. A2. 9-day composite surface skin temperatures (K) of AIRS/AMSU over the (a) Northern Hemisphere during the days 106–114, 2003, and (b) Southern Hemisphere during the days 258–266, 2003, (c) and (d) the difference between Tskin
(MODIS ICE) and Tskin(AIRS/AMSU).
Fig. A3. Scatter diagrams for the 9-day composite of Tskin
(MODIS ICE) versus Tskin(AIRS/AMSU) over the (a) Northern
Hemisphere during the days 106–114, 2003, and (b) Southern Hemisphere during the days 258–266, 2003. The values of AIRS/AMSU and MODIS have been compared to each other in a 1◦×1◦grid box.
on a good understanding about the difference between the two datasets. This study can be valuable to understand the characteristics of satellite infrared and microwave data for surface skin temperature remote sensing, as well as for the climate research associated with the temperature trends.
Acknowledgements. This work was supported by the National
Research Foundation of Korea (NRF) grant funded by Korea government (MEST) (No. 20120000858) and the GEMS program of the Korean Ministry of Environment and the Eco Innovation Program of KEITI (ARQ201204015). We thank Goddard Earth Sciences Data Information and Services Center for AIRS/AMSU data, and NASA Land Process Distributed Active Archive Center for MODIS LST data and the MODIS Snow and Sea Ice Global Mapping Project for MODIS IST data. We also thank Bob Iacov-azzi and an anonymous reviewer for their constructive comments. Edited by: H. Worden
References
Ackerman, S. A., Strabala, K. I., Menzel, W. P., Frey, R. A., Moeller, C. C., and Gumley, L. E.: Discriminating clear sky from clouds with MODIS, J. Geophys. Res., 103, 32141–32157, 1998. Armstrong, E. M., Wagner, G., Vazquez-Cuervo, J., and
Chin, T. M.: Comparisons of regional satellite sea sur-face temperature gradients derived from MODIS and AVHRR sensors, Int. J. Remote Sens., 33, 6639–6651, doi:10.1080/01431161.2012.692832, 2012.
Barton, I. J.: Improving satellite-derived sea surface temperature ac-curacies using water vapor profile data, J. Atmos. Ocean. Tech., 28, 85–93, doi:10.1175/2010jtecha1502.1, 2011.
Brown, O. B. and Minnett, P. J.: MODIS infrared sea surface temperature algorithm, Algorithm Theoretical Basis Document (ATBD) Version 2.0, available at: http://oceancolor.gsfc.nasa. gov/DOCS/atbd mod25.pdf (last acess: 11 January 2013), 1999. Ciappa, A., Pietranera, L., and Budillon, G.: Observations of the Terra Nova Bay (Antarctica) polynya by MODIS ice surface tem-perature imagery from 2005 to 2010, Remote Sens. Environ., 119, 158–172, 2012.
Coll, C., Wan, Z., and Glave, J. M.: Temperature-based and radiance-based validations of the V5 MODIS land sur-face temperature product, J. Geophys. Res., 114, D20102, doi:10.1029/2009JD012038, 2009.
Donlon, C. J., Minnett, P. J., Gentemann, C., Nightingale, T. J., Bar-ton, I. J., Ward, B., and Murray, M. J.: Toward improved valida-tion of satellite sea surface skin temperature measurements for climate research, J. Climate, 15, 353–369, 2002.
Fetzer, E. J. and Manning, E.: Failure of AMSU-A channel 4 and degradation of AMSU-A channel 5 NeDT affecting AIRS retrieval performance, available at: http://disc.sci.gsfc.nasa.gov/ AIRS/documentation/AMSU-A NeDT Update 2012-06-28.pdf (last access: 26 September 2012), 2012.
Grenfell, T. C.: Surface-based passive microwave studies of multi-year sea ice, J. Geophys. Res., 97, 3485–3501, 1992.
Haines, S. L., Jedlovec, G. J., and Lazarus, S. M.: A MODIS sea surface temperature, composite for regional applications, IEEE T. Geosci. Remote, 45, 2919–2927, doi:10.1109/Tgrs.2007.898274, 2007.
Hall, D. K., Riggs, G. A., and Salomonson, V. V.: Algorithm theoretical basis document (ATBD) forthe MODIS snow and sea ice-mapping algorithms, available at: http://modis-snow-ice. gsfc.nasa.gov/?c=atbd\&t=atbd (last access: 10 January 2013), 2001.
Hall, D. K., Key, J. R., Casey, K. A., Riggs, G. A., and Cavalieri, D. J.: Sea ice surface temperature product from MODIS, IEEE T. Geosci. Remote, 42, 1076–1087, 2004.
Hall, D. K., Comiso, J. C., DiGirolamo, N. E., Shuman, C. A., Key, J. R., and Koenig, L. S.: A satellite-derived climate-quality data record of the clear-sky surface temperature of the Greenland ice sheet, J. Climate, 25, 4785–4798, 2012.
Harris, A.: AIRS Version 5.0 Released Files Description, JPL D-38429, available at: http://disc.sci.gsfc.nasa.gov/ AIRS/documentation/v5 docs/AIRS V5 Release User Docs/ V5 Released ProcFileDesc.pdf (last access: 19 February 2013), 2007.
Hulley, G. C., Hook, S. J., Manning, E., Lee, S.-Y., and Fetzer, E.: Validation of the Atmospheric Infrared Sounder (AIRS) version 5 land surface emissivity product over the Namib and Kalahari deserts, J. Geophys. Res., 114, D19104, doi:10.1029/2009jd012351, 2009.
Isaacs, R. G., Jin, Y.-Q., Worsham, R. D., Deblonde, G., and Fal-cone Jr., V. J.: The RADTRAN microwave surface emission models, IEEE T. Geosci. Remote, 27, 433–440, 1989.
Jin, M. and Dickinson, R. E.: Land surface skin temperature climatology: benefitting from the strengths of satellite ob-servations, Environ. Res. Lett., 5, 04404, doi:10.1088/1748-9326/5/4/044004, 2010.
Jin, M., Dickinson, R. E., and Vogelmann, A. M.: A comparison of CCM2-BAT skin temperature and surface-air temperature with satellite and surface observations, J. Climate, 10, 1505–1524, 1997.
Kidder, S. Q. and Vonder Harr, T. H.: Satellite Meteorology: an In-troduction, Academic Press, 1995.
Knuteson, R., Cychosz, J., Lee, S. C., Revercomb, H., Tobin, D., and Vinson, K.: Comparison of LST from AIRS and MODIS from the EOS Aqua platform, 10th symposium on Integrated Ob-serving and Assimilation Systems for the Atmosphere, Oceans, and Land Surface (IOASAOLS), the 86th AMS annual meeting, 2006.
Minnett, P. J., Knuteson, R. O., Best, F. A., Osborne, B. J., Hanafin, J. A., and Brown, O. B.: The marine-atmospheric emitted radi-ance interferometer: a high-accuracy, seagoing infrared spectro-radiometer, J. Atmos. Ocean. Tech., 18, 994–1013, 2001. Minnett, P. J., Brown, O. B., Evans, R. H., Key, E. L., Kearns, E.
J., Kilpatrick, K., Kumar, A., Maillet, K. A., and Szczodrak, G.: Sea-surface temperature measurements from the MODerate reso-lution Imaging Spectroradiometer (MODIS) on Aqua and Terra, in: Proceedings of IGARSS, 7, 4576–4579, 2004.
Mo, T.: Postlaunch calibration of the NOAA-19 advanced mi-crowave sounding unit-A, J. Geophys. Res., 115, D08111, doi:10.1029/2009JD013177, 2010.
Olsen, E.: AIRS/AMSU/HSB Version 5 level 3 quick start, avail-able at: http://disc.sci.gsfc.nasa.gov/AIRS/documentation/v5 docs/AIRS V5 Release User Docs/V5 L3 QuickStart.pdf (last access: 19 February 2013), 2007.
Pagano, T. S., Aumann, H. H., Broberg, S. E., Gaiser, S. L., Hagan, D. E., Hearty, T. J., Hofstadter, M. D., Overoye, K., and Weiler, M.: On-board calibration techniques and test results for the At-mospheric Infrared Sounder (AIRS), in: Proceeding of SPIE on Earth Observing Systems VII, 7 July 2002, Seattle, USA, 2002. Pagano, T. S., Chahine, M. T., Aumann, H. H., Tian, B., Lee,
S.-Y., Olsen, E., Lambrigtsen, B., Fetzer, E., Irion, F. W., Mcmillan,
W., Strow, L., Fu, X., Barnet, C., Goldberg, M., Susskind, J., and Blaisdell, J.: Remote sensing of atmospheric climate param-eters from the Atmospheric Infrared Sounder, in: Proceeding of IGARSS, Denver, 2386–2389, 2006.
Prabhakara, C., Nucciarone, J. J., and Yoo, J.-M.: Examination of “Global atmospheric temperature monitoring with satellite mi-crowave measurements”: 1) theoretical considerations, Climatic Change, 30, 349–366, 1995.
Schreier, M. M., Kahn, B. H., Eldering, A., Elliott, D. A., Fish-bein, E., Irion, F. W., and Pagano, T. S.: Radiance comparisons of MODIS and AIRS using spatial response information, J. Atmos. Ocean. Tech., 27, 1331–1342, doi:10.1175/2010jtecha1424.1, 2010.
Susskind, J. and Molnar, G.: Spatial and temporal inter-relationships between anomalies of temperature, moisture, cloud cover, and OLR as observed by AIRS/AMSU on Aqua, in: Pro-ceedings of IGARSS, 5, v1–5, 2008.
Susskind, J., Barnet, C. D., and Blaisdell, J. M.: Retrieval of atmo-spheric and surface parameters from AIRS/AMSU/HSB data in the presence of clouds, IEEE T. Geosci. Remote, 41, 390–409, doi:10.1109/Tgrs.2002.808236, 2003.
Susskind, J., Barnet, C., Blaisdell, J., Iredell, L., Keita, F., Kou-varis, L., Molnar, G., and Chahine, M.: Accuracy of geophysical parameters derived from atmospheric infrared sounder/advanced microwave sounding unit as a function of fractional cloud cover, J. Geophys. Res., 111, D09S17, doi:10.1029/2005JD006272, 2006.
Susskind, J., Blaisdell, J. M., Iredell, L., and Keita, F.: Im-proved temperature sounding and quality control methodol-ogy using AIRS/AMSU data: the AIRS science team version 5 retrieval algorithm, IEEE T. Geosci. Remote, 49, 883–907, doi:10.1109/Tgrs.2010.2070508, 2011.
Tobin, D. C., Revercomb, H. E., Moeller, C. C., and Pagano, T. S.: Use of atmospheric infrared sounder high-spectral resolution spectra to assess the calibration of moderate resolution imag-ing spectroradiometer on EOS Aqua, J. Geophys. Res., 111, D09S05, doi:10.1029/2005JD006095, 2006.
Wan, Z.: Collection-5 MODIS land surface temperature prod-ucts user’s guide, available at: http://datamirror.csdb.cn/modis/ resource/doc/MOD11 UserGuide.pdf (last access: 19 Febru-ary 2013), 2009.
Wan, Z.: Validation and refinement of the MODIS land-surface temperature product, available at: http://modis.gsfc.nasa.gov/ sci team/meetings/201105/presentations/land/wan.pdf (last ac-cess: 17 August 2012), 2011.
Wan, Z.: Collection 5 Changes in the V5 PGE16, available at: http://datamirror.csdb.cn/modis/resource/doc/MOD11 C005 Change.pdf (last access: 19 February 2013), 2012.
Wan, Z. and Dozier, J.: A generalized split-window algorithm for retrieving land-surface temperature from space, IEEE T. Geosci. Remote, 34, 892–905, 1996.
Wan, Z. and Li, Z.-L.: A physics-based algorithm for retrieving land-surface emissivity and temperature from EOS/MODIS data, IEEE T. Geosci. Remote, 35, 980–996, 1997.
Wan, Z., Zhang, Y., Zhang, Q., and Li, Z.-L.: Quality as-sessment and validation of the MODIS global land sur-face temperature, Int. J. Remote Sens., 25, 261–274, doi:10.1080/0143116031000116417, 2004.
Weeks, W. F.: The potential remote sensing, Oceanus, 24, 39–48, 1981.
Wilks, D. S.: Statistical Methods in the Atmospheric Sciences, Aca-demic Press, 1995.
Xiong, X., Wenny, B. N., Angal, A., Barnes, W., and Salomonson, V.: Summary of Terra and Aqua MODIS long-term performance, in: Proceedings of IGARSS, 4006–4009, 2011.
Yoo, J.-M., Prabhakara, C., and Iacovazzi Jr., R.: Surface emissivity and hydrometeors derived from microwave satellite observations and model reanalyses, J. Meteor. Soc. Jpn., 81, 1087–1109, 2003. Yuan, D.: Science focus: sea surface temperature measure-ments of the MODIS and AIRS instrumeasure-ments onboard of Aqua satellite, available at: http://disc.sci.gsfc.nasa.gov/oceans/ science-focus/modis/MODIS and AIRS SST comp.shtml (last access: 19 February 2013), 2009.