INTRODUCTION
Functional assessment of the right ventricle (RV) is a determinant of the treatment plan and prognosis in various clinical settings (1-3). In addition to the ejection fraction (EF), volumetric parameters of RV, such as end-diastolic volume (EDV), end-systolic volume (ESV), and stroke volume (SV), are important clinical indicators, for example,
Cardiac CT for Measurement of Right Ventricular Volume
and Function in Comparison with Cardiac MRI:
A Meta-Analysis
Jin Young Kim, MD
1, Young Joo Suh, MD, PhD
2, Kyunghwa Han, PhD
2, Young Jin Kim, MD, PhD
2,
Byoung Wook Choi, MD, PhD
21Department of Radiology, Dongsan Hospital, Keimyung University College of Medicine, Daegu, Korea; 2Department of Radiology, Research
Institute of Radiological Science, Severance Hospital, Yonsei University College of Medicine, Seoul, Korea
Objective: We performed a meta-analysis to evaluate the agreement of cardiac computed tomography (CT) with cardiac magnetic resonance imaging (CMRI) in the assessment of right ventricle (RV) volume and functional parameters.
Materials and Methods: PubMed, EMBASE, and Cochrane library were systematically searched for studies that compared CT with CMRI as the reference standard for measurement of the following RV parameters: diastolic volume (EDV), end-systolic volume (ESV), stroke volume (SV), or ejection fraction (EF). Meta-analytic methods were utilized to determine the pooled weighted bias, limits of agreement (LOA), and correlation coefficient (r) between CT and CMRI. Heterogeneity was also assessed. Subgroup analyses were performed based on the probable factors affecting measurement of RV volume: CT contrast protocol, number of CT slices, CT reconstruction interval, CT volumetry, and segmentation methods.
Results: A total of 766 patients from 20 studies were included. Pooled bias and LOA were 3.1 mL (-5.7 to 11.8 mL), 3.6 mL (-4.0 to 11.2 mL), -0.4 mL (5.7 to 5.0 mL), and -1.8% (-5.7 to 2.2%) for EDV, ESV, SV, and EF, respectively. Pooled correlation coefficients were very strong for the RV parameters (r = 0.87–0.93). Heterogeneity was observed in the studies (I2 > 50%,
p < 0.1). In the subgroup analysis, an RV-dedicated contrast protocol, ≥ 64 CT slices, CT volumetry with the Simpson’s method, and inclusion of the papillary muscle and trabeculation had a lower pooled bias and narrower LOA.
Conclusion: Cardiac CT accurately measures RV volume and function, with an acceptable range of bias and LOA and strong correlation with CMRI findings. The RV-dedicated CT contrast protocol, ≥ 64 CT slices, and use of the same CT volumetry method as CMRI can improve agreement with CMRI.
Keywords: Right ventricular function; Volumetry; Computed tomography; Magnetic resonance imaging; Meta-analysis
Received July 5, 2019; accepted after revision December 16, 2019.
This work was supported by a faculty research grant of Yonsei University College of Medicine (6-2018-0041).
Corresponding author: Young Joo Suh, MD, PhD, Department of Radiology, Research Institute of Radiological Science, Severance
Hospital, Yonsei University College of Medicine, 50-1 Yonsei-ro, Seodaemun-gu, Seoul 03722, Korea.
• Tel: (822) 2228-7400 • Fax: (822) 2227-8337 • E-mail: [email protected]
This is an Open Access article distributed under the terms of the Creative Commons Attribution Non-Commercial License (https:// creativecommons.org/licenses/by-nc/4.0) which permits unrestricted non-commercial use, distribution, and reproduction in any medium, provided the original work is properly cited.
to determine the optimal operating time and predict the postoperative outcome of patients with repaired tetralogy of Fallot and to diagnose arrhythmogenic right ventricular dysplasia (3-5).
The complex geometry of the RV makes reliable measurement of RV volume challenging (6, 7), and echocardiography is often suboptimal for RV assessment. Cardiac magnetic resonance imaging (CMRI) is the
Korean J Radiol 2020;21(4):450-461
gold standard to evaluate RV volume and function with high reproducibility (8). However, CMRI has limitations in patients with poor compliance for long scan times or contraindications to CMRI (9). With the recent improvements in the temporal and spatial resolution of computed tomography (CT) scanners, cardiac CT can be used to assess RV volume and function (10). Previous studies that compared CT measurements of RV volume and function with CMRI as the reference standard showed variable results regarding the agreement between cardiac CT and CMRI (6, 11-29). These variable results may be attributable to the differences in RV segmentation methods in cardiac CT and MRI; for example, two-dimensional (2D)- vs. three-dimensional (3D)-based methods, manual vs. semiautomatic vs. automatic segmentation, and threshold-based
segmentation vs. simplified contouring (30-33). Considering the clinical significance of RV volume and function, factors affecting the difference and agreement of the measured values on CT and CMRI should be identified through a meta-analysis.
Therefore, the purpose of this meta-analysis was to evaluate the agreement of cardiac CT with CMRI in the assessment of RV volume and functional parameters.
MATERIALS AND METHODS
Our methods followed the Preferred Reporting Items for Systematic Reviews and Meta-Analyses recommendations (34). Literature Search
A systematic search of the PubMed, EMBASE, and Cochrane library databases was performed to identify relevant studies published till January 9, 2019. Supplementary Materials lists the searched terms.
Study Selection
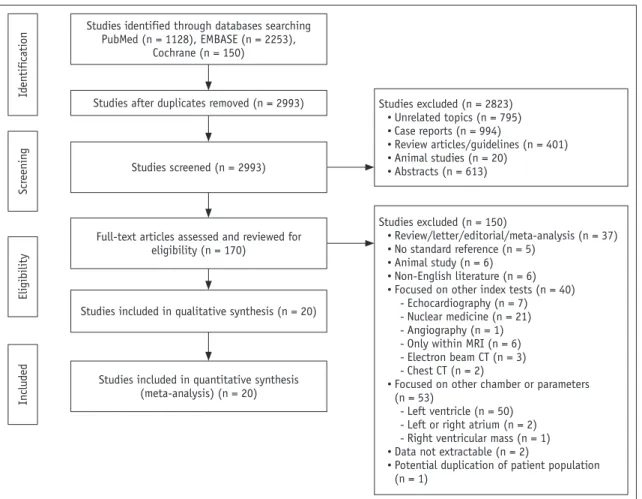
The articles were independently reviewed by two authors experienced in meta-analyses (4 and 7 years of experience in cardiothoracic radiology). Figure 1 summarizes the literature search process. The inclusion criterion used at Studies identified through databases searching
PubMed (n = 1128), EMBASE (n = 2253), Cochrane (n = 150) Id en tifi cati on Scr eenin g Eli gibility In clu ded
Studies after duplicates removed (n = 2993)
Studies screened (n = 2993) Studies excluded (n = 2823) • Unrelated topics (n = 795) • Case reports (n = 994) • Review articles/guidelines (n = 401) • Animal studies (n = 20) • Abstracts (n = 613) Studies excluded (n = 150) • Review/letter/editorial/meta-analysis (n = 37) • No standard reference (n = 5) • Animal study (n = 6) • Non-English literature (n = 6) • Focused on other index tests (n = 40)
- Echocardiography (n = 7) - Nuclear medicine (n = 21) - Angiography (n = 1) - Only within MRI (n = 6) - Electron beam CT (n = 3) - Chest CT (n = 2)
• Focused on other chamber or parameters (n = 53)
- Left ventricle (n = 50) - Left or right atrium (n = 2) - Right ventricular mass (n = 1) • Data not extractable (n = 2)
• Potential duplication of patient population (n = 1)
Full-text articles assessed and reviewed for eligibility (n = 170)
Studies included in qualitative synthesis (n = 20)
Studies included in quantitative synthesis (meta-analysis) (n = 20)
Fig. 1. Flowchart of literature review process. Process of identification and selection of studies for inclusion in this meta-analysis based on Preferred Reporting Items for Systematic Reviews and Meta-Analyses recommendations. CT = computed tomography, MRI = magnetic resonance imaging
the full-text level was a comparison of CT with CMRI as the standard reference in at least one of the following parameters of RV function: EF, EDV, ESV, or SV. The exclusion criteria were the absence of CMRI and other reference standards for RV measurement, use of an index test other than CT, assessment of a cardiac chamber other than RV, incomplete dataset, animal studies, non-English language, potential duplication of patient population, and manuscript format other than original article.
Data Extraction
Data were independently extracted by two investigators. The extracted parameters were: 1) article information and demographic characteristics; 2) acquisition protocol for CT and CMRI: number of CT slices, electrocardiogram (ECG)-gating method during CT, contrast administration protocol in CT (RV-dedicated [triphasic or split-bolus technique] or non-RV-dedicated), reconstruction interval of RR on CT, CMRI scanner type (3 tesla [T] or 1.5T), acquisition sequence for cine image on CMRI; 3) analysis method for RV function: details of the segmentation methods (2D with Simpson’s method vs. 3D, manual vs. semiautomatic vs. automatic, threshold-based vs. simplified contouring, inclusion vs. exclusion of trabeculation or papillary muscle in the RV cavity), reconstructed slice thickness, and analysis software tool; 4) study outcomes: results of the Bland– Altman test (bias with 1 or 1.96 standard deviation [SD]) and correlation coefficient between CT and CMRI for EDV, ESV, SV, and EF.
Quality Assessment
The modified Quality Assessment of Diagnostic Accuracy Studies-2 (QUADAS-2) tool was used to assess the study quality (35). Two independent investigators reviewed studies for quality assessment and reached consensus through discussion.
Statistical Analysis
RV parameters measured with CT were compared with CMRI as the standard reference. For each study, bias (mean difference) was calculated by subtraction of the mean of each parameter measured by CT and CMRI, and limits of agreement (LOA) was defined as the SD of the mean difference multiplied by 1.96. The pooled bias and 95% LOA from the included studies were estimated based on the method proposed by DerSimonian and Laird (36). Pooled estimates of the bias and the SD for the difference were
obtained on the basis of the random-effects model, after which 95% LOA was obtained by the method in Williamson et al. (37). The pooled correlation coefficient was analyzed using the inverse variance-weighted method in the DerSimonian–Laird random-effects model. If the results were presented in subgroups in the study, the average bias of the group was used, and the correlation coefficient of each subgroup was integrated by Fisher’s -z-transformation method (37). Meta-analysis results of bias and LOA for each parameter were drawn as a modified forest plot, in which each circle indicated a study, with the circle size representing the weight (sample size and variance) of each study. Results of pooled correlation coefficients of each parameter were drawn as a forest plot. Heterogeneity was assessed using chi-squared-based Q statistics and I2 statistics (36, 38). For subgroup analysis of factors
affecting the agreement in RV measurement, differences in the degree of heterogeneity for correlation coefficients between subgroups were assessed using the Cochran’s Q test, and the influencing factors were analyzed using a meta-regression analysis. Publication biases were assessed using the Egger’s test and drawn as funnel plots (39, 40). The analysis was performed using R (Version 3.5.2, R Foundation for Statistical Computing, Vienna, Austria) with the meta package (41).
RESULTS
Study Characteristics
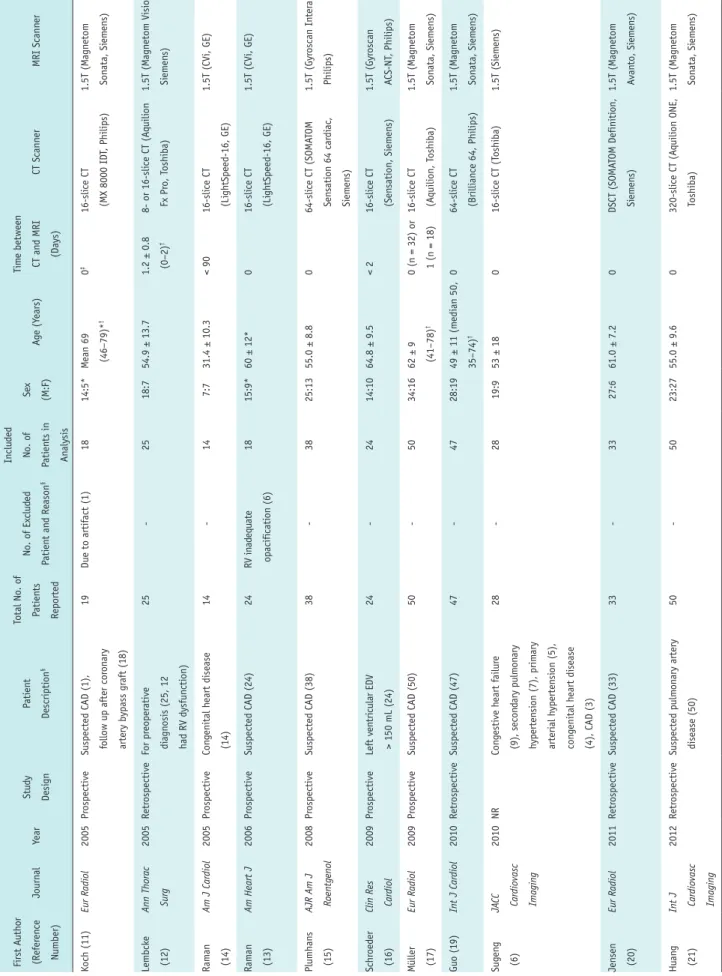
After the study selection process, a total of 766 patients from 20 studies were included in the meta-analysis (6, 11-29). EDV and ESV were analyzed in all 20 studies, and SV and EF were analyzed in 15 and 19 studies, respectively. Table 1 and Supplementary Table 1 summarize the study characteristics and details of image acquisition and RV analysis method in the included studies. The radiation dose from cardiac CT was 2.7–20 mSv in the ten included studies (11, 15, 16, 20-22, 24-27).
Koch et al. (11) compared two different CT volumetric analysis methods (Simpson’s method and the 3D threshold-based segmentation method) in the patient population. In this meta-analysis, results from 3D threshold-based segmentation methods were included to avoid data duplication. Data from the 2D-based Simpson’s method were included only in the subgroup analysis for the volumetry method. Guo et al. (18) divided patients in two subgroups based on the presence of mitral regurgitation,
Table 1. Study Char acteristics First A uth or (Refer en ce Number) Journ al Year Stu dy Desi gn Pati en t Descripti on § Total N o. o f Pati en ts Reported No. o f Ex clu ded Pati en t an d Reason § In clu ded No. o f Pati en ts in An alysis Se x (M:F) Ag e (Y ears) Tim e between CT an d MRI (Days) CT Scann er MRI Scann er Koch (11) Eur Radiol 2005 Pr ospective
Suspected CAD (1), follow up after cor
on ary artery bypass gr aft (18) 19 Due to artif act (1) 18 14:5* M ean 69 (46–79)* † 0 ‡ 16-sli ce CT (MX 8000 ID T, Philips) 1.5T (M agn etom Son ata, Si em en s) Lembck e (12)
Ann Thorac Surg
2005 Retr ospective For pr eoper ative di agn osis (25, 12 had RV d ysfun cti on) 25 -25 18:7 54.9 ± 13.7 1.2 ± 0.8 (0–2) † 8- or 16-sli ce CT (A quili on Fx Pr o, T oshiba) 1.5T (M agn etom Visi on, Si em en s) Ram an (14) Am J Cardiol 2005 Pr ospective Con genital h eart disease (14) 14 -14 7:7 31.4 ± 10.3 < 90 16-sli ce CT (Li gh tSpeed-16, GE) 1.5T (CVi, GE) Ram an (13) Am Heart J 2006 Pr ospective Suspected CAD (24) 24 RV in ad equ ate opacifi cati on (6) 18 15:9* 60 ± 12* 0 16-sli ce CT (Li gh tSpeed-16, GE) 1.5T (CVi, GE) Plumhan s (15) AJR Am J Roentgenol 2008 Pr ospective Suspected CAD (38) 38 -38 25:13 55.0 ± 8.8 0 64-sli ce CT (SOMA TOM Sen sati on 64 car di ac , Si em en s) 1.5T (Gyr oscan In ter a, Philips) Schr oed er (16)
Clin Res Cardiol
2009 Pr ospective Left ven tri cular EDV > 150 mL (24) 24 -24 14:10 64.8 ± 9.5 < 2 16-sli ce CT (Sen sati on, Si em en s) 1.5T (Gyr oscan A CS-NT , Philips) M üller (17) Eur Radiol 2009 Pr ospective Suspected CAD (50) 50 -50 34:16 62 ± 9 (41–78) † 0 (n = 32) or 1 (n = 18) 16-sli ce CT (A quili on, T oshiba) 1.5T (M agn etom Son ata, Si em en s) Gu o (19) Int J Cardiol 2010 Retr ospective Suspected CAD (47) 47 -47 28:19 49 ± 11 (m edi an 50, 35–74) † 0 64-sli ce CT (Brilli an ce 64, Philips) 1.5T (M agn etom Son ata, Si em en s) Sug en g (6) JA CC Cardiovasc Imaging 2010 NR Con gestive h eart f ailur e (9), secon dary pulm on ary h yperten si on (7), prim ary arteri al h yperten si on (5), con genital h eart disease (4), CAD (3) 28 -28 19:9 53 ± 18 0 16-sli ce CT (T oshiba) 1.5T (Si em en s) Jen sen (20) Eur Radiol 2011 Retr ospective Suspected CAD (33) 33 -33 27:6 61.0 ± 7.2 0 DSCT (SOMA TOM Definiti on, Si em en s) 1.5T (M agn etom A van to, Si em en s) Hua ng (21)
Int J Cardiovasc Imaging
2012 Retr ospective Suspected pulm on ary artery disease (50) 50 -50 23:27 55.0 ± 9.6 0 320-sli ce CT (A quili on ONE, T oshiba) 1.5T (M agn etom Son ata, Si em en s)
Table 1. Study Char acteristics (Continued) First A uth or (Refer en ce Number) Journ al Year Stu dy Desi gn Pati en t Descripti on § Total N o. o f Pati en ts Reported No. o f Ex clu ded Pati en t an d Reason § In clu ded No. o f Pati en ts in An alysis Se x (M:F) Ag e (Y ears) Tim e between CT an d MRI (Days) CT Scann er MRI Scann er Takx (22) Eur J Radiol 2012 Pr ospective Suspected CAD (20) 20 -20 16:4 60.6 ± 6.5 (50–69) † 0 2n d g en er ati on DSCT (SOMA TOM Definiti on Flash, Si em en s) 1.5T (M agn etom, A van to, Si em en s) Fu ch s (25)
J Cardiovasc Comput Tomogr
2012 Pr ospective Post-m yocar di al inf ar cti on (53) 53 Missin g part o f ven tri cles (1), impr oper segm en tati on by so ftwar e (1) 51 40:13* 61 ± 10 (34–81)* † 0–19* 64-sli ce CT (A quilli on, T oshiba) 1.5T (A van to, si em en s) Gao (24) Eur J Radiol 2012 Pr ospective COPD an d cor pulm on ale (63) 63 Un able to perf orm r epeated br eath h oldin g d urin g MRI (5) 58 39:19 64 ± 9 (35–78) † 0 64-sli ce CT (Li gh tSpeed VCT , GE) 1.5T (Son ata, Si em en s) Lee (23) Acad Radiol 2012 Pr ospective For assessm en t o f car di ac fun cti on (30) 30 -30 14:16 61.9 ± 11.2 < 7 64-sli ce CT (Sen sati on 64, Si em en s) 1.5T (M agn etom A van to, Si em en s) M affei (28) Eur Radiol 2012 Pr ospective Suspected CAD (79) 79 -79 46:33 58 ± 17 (m edi an 58, 24–89) † < 7 64-sli ce CT (Sen sati on 64, Si em en s) 1.5T (A chi eva, Philips) Zhan g (26)
Chin Med J (Engl)
2012 Pr ospective Rh eum ati c mitr al sten osis (43) 43 -43 20:23 51 ± 8 (37–74) 0 64-sli ce CT (Brilli an ce 64, Philips) 1.5T (M agn etom Son ata, Si em en s) Gu o (18) Int J Cardiol 2013 Pr ospective
Suspected CAD with
out MR (30), with MR (54) 84 -84 40:44 Pati en ts with out MR: 41 ± 13 (30–73) †, pati en ts with MR (M: 39 ± 11 [28–64] †, F: 41 ± 13 [19–65] †) 0 64-sli ce CT (Brilli an ce 64, Philips) 1.5T (Son ata, Si em en s) W an g (29) J Nucl Cardiol 2013 Pr ospective Pati en ts with pulm on ary h yperten si on 23 -23 4:19 31.7 ± 11.5 < 7 64-sli ce CT (bi ogr aph, Si em en s) 1.5T (M agn etom A van to, Si em en s) Yam asaki (27) Eur Radiol 2014 NR Repair ed tetr alogy o f Fallot (33) 33 -33 19:14 28.9 ± 13.1 0 256-sli ce CT (Brilli an ce iCT , Philips) 3T (A chi eva 3.0T , Philips) *Only d ata o f en tir e populati on was r eported , † M ean s 25th per cen tile to 75th per cen tile , ‡ CT an d MRI wer e perf orm ed on sam e d ay , e xcept in on e pati en t, § Data in par en th eses in di cate n umber o f pati en ts . CAD = cor on
ary artery disease
, COPD = chr oni c obstru ctive pulm on ary disease , CT = computed tom ogr aph y, DSCT = d ual-sour ce CT , EDV = en d-di astoli c volum e, F = fem ale , M = m ale , MR = mitr al r egur gitati on, MRI = m agn eti c r eson an ce im agin g, NR = n ot r eported , RV = ri gh t ven tri cle , T = tesla
and the results for the entire population, estimated from each subgroup, were used for this meta-analysis. Most of the studies included in this meta-analysis used 2D-based Simpson’s methods with the simplified contouring method in CMRI for RV analysis; however, the segmentation methods used in CT differed from study to study.
Agreement between CT and MRI for Measurements of RV Volume and Function
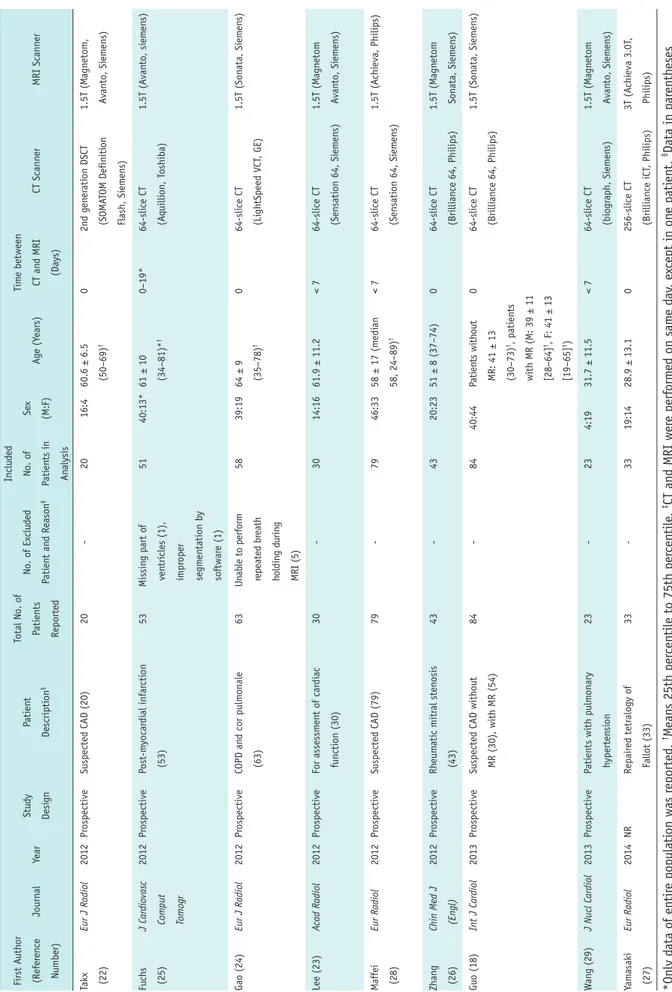
Table 2 summarizes the weighted bias and LOA for each parameter, and Figure 2 summarizes the modified forest plots as Bland–Altman plots. For EDV, ESV, SV, and EF, the pooled bias was 3.036 mL, 3.589 mL, -0.385 mL, and -1.763%, respectively, and the pooled LOA were -5.715 to 11.786 mL, -3.997 to 11.175 mL, -5.722 to 4.953 mL, and -5.729 to 2.203%, respectively. Significant heterogeneity was observed in all studies (I2 > 50%, p < 0.1).
Correlation between CT and MRI for Measurements of RV Volume and Function
Table 2 summarizes the pooled correlation coefficient of each RV volumetric parameter, and Supplementary Figure 1 summarizes the forest plots. The pooled correlation coefficients of EDV, ESV, SV, and EF were 0.93 (95% confidence interval [CI]: 0.89–0.96), 0.93 (95% CI: 0.89–0.95), 0.88 (95% CI: 0.79–0.93), and 0.87 (95% CI:
Fig. 2. Modified Blan–Altman plot for agreement between CT and CMRI for RV parameters.
A. EDV. B. ESV. C. SV. D. EF. CMRI = cardiac MRI, EDV = end-diastolic volume, EF = ejection fraction, ESV = end-systolic volume, LOA = limits of
agreement, RV = right ventricle, SV = stroke volume 0 -10 -20 Differ en ce in SV (mL) 20 40 60 80 Bias (LOA) = -0.385 (-5.722–4.953) I2 = 85%, p < 0.001 Mean of SV (mL) 30 20 10 0 -10 -20 Differ en ce in EDV (mL) 50 100 150 200 Bias (LOA) = 3.036 (-5.715–11.786) I2 = 92%, p < 0.001 Mean of EDV (mL) 0 -5 -10 -15 Differ en ce in EF (%) 30 40 50 60 Bias (LOA) = -1.763 (-5.729–2.203) I2 = 85%, p < 0.001 Mean of EF (%) 30 20 10 0 -10 Differ en ce in ESV (mL) 50 100 Bias (LOA) = 3.589 (-3.997–11.175) I2 = 91%, p < 0.001 Mean of ESV (mL) A C B D Table 2. Weighted Bias with LOA and Correlation Coefficients of Right Ventricular Function between Cardiac CT and CMRI
RV Parameters Weighted Bias 95% LOA* Correlation Coefficient (95% CI) EDV (mL) 3.036 17.501 (-5.715–11.786) 0.93 (0.89–0.96) ESV (mL) 3.589 15.172 (-3.997–11.175) 0.93 (0.89–0.95) SV (mL) -0.385 10.675 (-5.722–4.953) 0.88 (0.79–0.93) EF (%) -1.763 7.932 (-5.729–2.203) 0.87 (0.79–0.92) *Data are presented as width of 95% LOA (upper LOA, lower LOA). CI = confidence interval, CMRI = cardiac MRI, EF = ejection fraction, ESV = end-systolic volume, LOA = limits of agreement, SV = stroke volume
0.79–0.92), respectively. Heterogeneity was observed in all studies (I2 > 50%, p < 0.1).
Subgroup Analysis
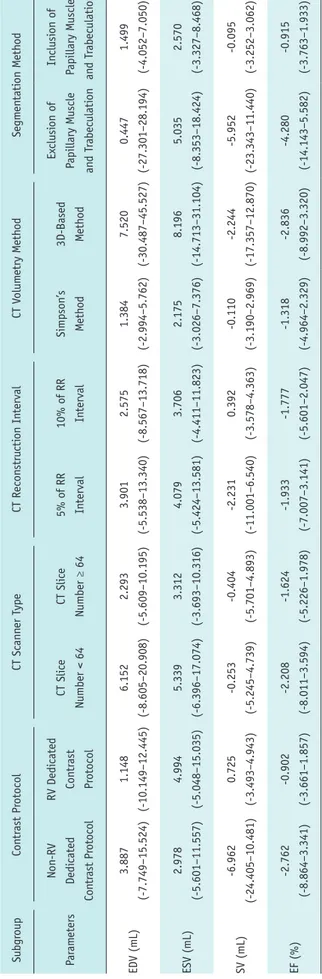
Table 3 presents the weighted bias and LOA of subgroup analyses, and Supplementary Figure 2 presents the forest plots for correlation coefficients in subgroup analyses. For correlation coefficients, there were no significant differences in heterogeneity between the subgroups for any parameter, and no significant factors affecting heterogeneity were revealed in the meta-regression (p > 0.05) (Supplementary Table 2).
Among the 20 studies, 7 studies (11, 20, 22-24, 27, 29) used an RV-dedicated CT contrast administration protocol and 11 studies (6, 12-14, 17-19, 21, 25, 26, 28) used the non-RV-dedicated contrast protocol. Two studies did not accurately describe the contrast protocol (15, 16). Studies with RV-dedicated CT contrast protocols showed a lower weighted bias and narrower LOA in EDV and SV compared to those with non-RV-dedicated contrast protocols. The weighted bias and LOA of ESV and EF were smaller between the subgroups. The highest correlation coefficient was observed for EDV and ESV with an RV-dedicated contrast protocol (r = 0.95 for both). Other RV volume and function parameters showed very strong correlations (r > 0.8), regardless of the contrast protocol.
The number of CT slices was ≥ 64 (15, 18-29) in 13 studies and < 64 in 7 studies. In studies with ≥ 64 CT slices (6, 11-14, 16, 17), EDV and ESV showed a lower weighted bias and narrower LOA than in studies with < 64 CT slices. SV and EF showed similar values of weighted bias and LOA between the subgroups. All parameters showed very strong correlations (r > 0.8); however, studies with ≥ 64 CT slices showed higher correlation coefficients than those with < 64 CT slices. The CT reconstruction interval was 10% and 5% of the RR intervals in 10 studies (6, 11, 13, 17-19, 21-23, 27) and 9 studies (12, 14-16, 20, 21, 25, 28, 29), respectively. One study did not demonstrate the exact reconstruction interval (24). There were no parameters showing difference in agreement between the subgroups. The RV parameters showed very strong correlations in both subgroups (r > 0.8).
The Simpson’s method was used in 14 studies for RV volume measurement on CT (12-20, 22, 24, 26, 28, 29), while 3D-based methods were used in 5 studies (6, 21, 23, 25, 27), and Koch et al. (11) used both methods in the same study population. Studies using Simpson’s method
showed a lower bias and narrower LOA for EDV and ESV than Table 3. W
eighted Bias with LO
A o
f RV Function betw
een Car
diac CT and MRI in Subgr
oup Analy sis Subgr oup Con tr ast Pr otocol CT Scann er T ype CT Recon stru cti on In terval CT V olum etry M eth od Segm en tati on M eth od Par am eters Non-RV Dedi cated Con tr ast Pr otocol RV Dedi cated Con tr ast Pr otocol CT Sli ce Number < 64 CT Sli ce Number ≥ 64 5% o f RR In terval 10% o f RR In terval Simpson’s Meth od 3D-Based Meth od Ex clusi on o f Papillary M uscle an d T rabeculati on In clusi on o f Papillary M uscle an d T rabeculati on EDV (mL) 3.887 (-7.749–15.524) 1.148 (-10.149–12.445) 6.152 (-8.605–20.908) 2.293 (-5.609–10.195) 3.901 (-5.538–13.340) 2.575 (-8.567–13.718) 1.384 (-2.994–5.762) 7.520 (-30.487–45.527) 0.447 (-27.301–28.194) 1.499 (-4.052–7.050) ESV (mL) 2.978 (-5.601–11.557) 4.994 (-5.048–15.035) 5.339 (-6.396–17.074) 3.312 (-3.693–10.316) 4.079 (-5.424–13.581) 3.706 (-4.411–11.823) 2.175 (-3.026–7.376) 8.196 (-14.713–31.104) 5.035 (-8.353–18.424) 2.570 (-3.327–8.468) SV (mL) -6.962 (-24.405–10.481) 0.725 (-3.493–4.943) -0.253 (-5.245–4.739) -0.404 (-5.701–4.893) -2.231 (-11.001–6.540) 0.392 (-3.578–4.363) -0.110 (-3.190–2.969) -2.244 (-17.357–12.870) -5.952 (-23.343–11.440) -0.095 (-3.252–3.062) EF (%) -2.762 (-8.864–3.341) -0.902 (-3.661–1.857) -2.208 (-8.011–3.594) -1.624 (-5.226–1.978) -1.933 (-7.007–3.141) -1.777 (-5.601–2.047) -1.318 (-4.964–2.329) -2.836 (-8.992–3.320) -4.280 (-14.143–5.582) -0.915 (-3.763–1.933) Data ar e pr esen
ted with wei
gh ted bi as with LO A. 3D = thr ee-dim en si on al
those using a 3D-based method. SV and EF showed smaller differences in the pooled bias between the subgroups. The parameters showed very strong correlations in both subgroups (r > 0.8).
Five studies excluded the papillary muscle and trabeculation from the RV cavity (11, 12, 16, 17, 23), while 12 studies included them in contouring of the RV endocardial border (6, 15, 18-22, 24, 26-28). Three studies did not mention the segmentation method (13, 14, 25). With including the papillary muscle and trabeculation, ESV, SV, and EF showed a lower bias and narrow LOA. EDV showed similar values of bias and LOA between the subgroups. The parameters showed strong correlations (r ≥ 0.8), except SV and EF using the exclusion method (r = 0.79 and 0.76). Quality of Studies
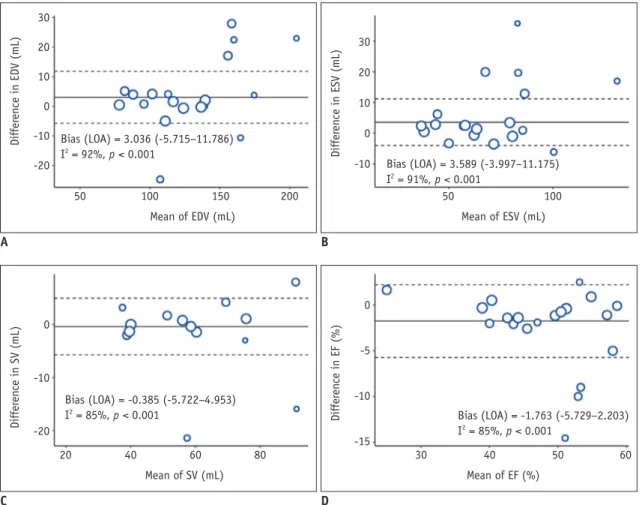
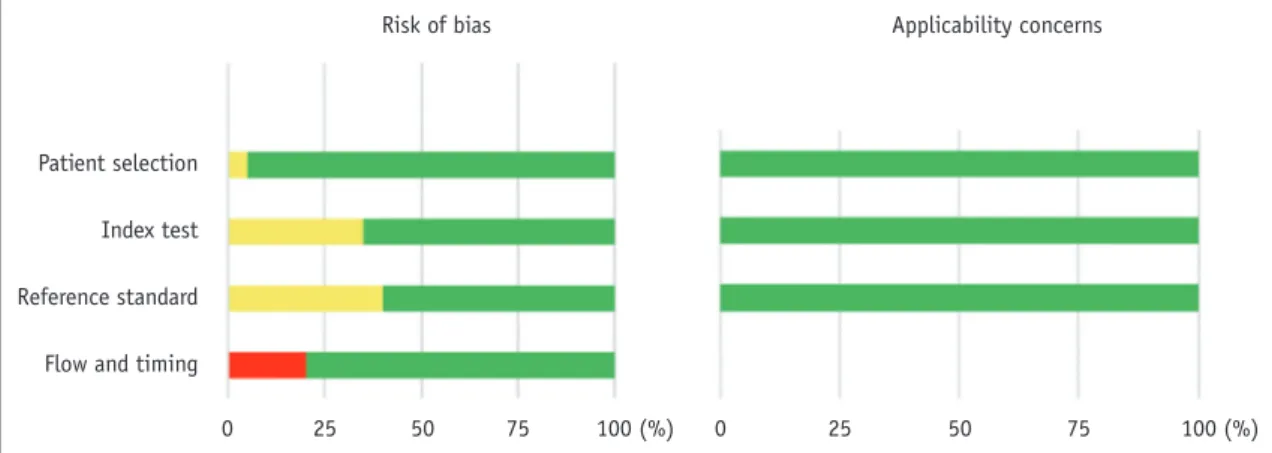
Figure 3 summarizes the findings for the domains of the QUADAS-2 checklist. Most studies (95%) enrolled consecutive patients. One study did not explain the patient enrollment method (12). The risk of bias was judged as “unclear” in “index test” or “reference standard” domains in eight studies (40%), because there was no mention of whether the CT and CMRI results were interpreted with knowledge of each other (11, 16, 18, 22, 24, 26, 27, 29). Four studies (20%) showed a high risk of bias in the “flow” and “timing” domains, as some patients were excluded from the analysis (11, 13, 24, 25). Concerns regarding applicability were rated “low” in all the domains. Publication Bias
Supplementary Figure 3 presents the funnel plots of each parameter. EDV and SV showed relatively symmetric
funnel plots without significant publication bias (p > 0.05); however, ESV and EF showed significant publication bias (p = 0.02 and p = 0.01, respectively).
DISCUSSION
Our meta-analysis demonstrates that evaluation of RV functional parameters on CT shows good agreement and very strong correlations with CMRI, although significant heterogeneities are observed in the studies. The RV parameters show a weighted bias < 4, with overestimation of EDV and ESV and underestimation of EF on CT, and a correlation coefficient > 0.8. Regarding factors affecting the measurements of RV volume and function, the RV-dedicated CT contrast protocol, CT scanner type with number of slices ≥ 64, use of CT segmentation with the Simpson’s method, and inclusion of the papillary muscle and trabeculation for contouring the RV endocardial border contribute to better agreement between CT and CMRI.
A previous meta-analysis reported a good agreement and strong correlation between cardiac CT and CMRI for measurement of EF (pooled bias, 4.67%; LOA, 3.71–5.62%; correlation coefficient, 0.79) (42). However, the accuracy of other RV functional parameters, such as EDV, ESV, and SV, was not analyzed using the meta-analytic method before.
Echocardiography is the first-line method for functional evaluation of RV; however, it has limitations because of the position and complex geometry of RV (43, 44). Furthermore, 2D-based fractional area changes on echocardiography cannot fully represent RV global function, and Doppler-derived parameters have an angle dependency (44). Although recent studies reported that 3D echocardiography can accurately
Patient selection Index test Reference standard Flow and timing
0 25 50 75 100 (%)
Risk of bias Applicability concerns
0 25 50 75 100 (%) Fig. 3. Quality assessment of included studies. Risk of bias and applicability of concerns domains are presented as percentages based on modified Quality Assessment of Diagnostic Accuracy Studies-2 tool. Each bar shows percentage of studies with high (red), unclear (yellow), and low (green) risks of bias and applicability of concerns.
measure RV volume, it depends on the image quality, and it underestimates RV volume in comparison with CMRI (45).
CMRI is considered as the reference standard; however, the technique is contraindicated in some patients, such as those with implantable or supporting devices and claustrophobia (46). With the development of ECG-gated cardiac CT, 3D volumetric images of the heart can be obtained with high spatial resolution within a short scan acquisition time; therefore, CT can be an alternative tool for cardiac chamber function evaluation in patients who cannot undergo CMRI (47, 48). Although the use of iodinated contrast media and radiation exposure can be disadvantages of CT, recent developments in dose reduction techniques (e.g., image acquisition at low tube voltages with automated exposure control of tube current combined with iterative reconstruction) and low-dose contrast agent administration combined with low tube voltage acquisition can reduce these concerns (49-51).
Therefore, many individual studies investigated the agreement between CT and CMRI for volume and functional measurement of cardiac chambers, including RV (6, 11-29). However, the results for agreement and difference between the two modalities varied across studies. Therefore, we conducted a subgroup analysis based on the factors affecting RV volume and function measurements on CT. Protocols for image reconstruction and segmentation of the RV were almost uniform for CMRI among the included studies. In contrast, CT protocols vary based on the purpose of the exam or depend on the individual institution (52).
Accurate delineation of the RV endocardial contour requires homogeneous enhancement of the RV cavity (48). Since routine coronary CT protocol targets optimal enhancement of the coronary arteries and aorta, a contrast administration protocol focusing on visualizing the right cardiac chamber, such as multiphasic contrast injection or split-bolus technique, can help accurately draw the RV endocardial contour (53). In our study, EDV and SV showed better agreement in the subgroup of RV-dedicated contrast protocol. A contrast protocol focused on RV can be important for accurate evaluation of volume and function. Moreover, the inferior temporal resolution of CT to CMRI may lead to inaccurate ventricular volumetry values, which may be more prominent in previous CT scanners with < 64 slices. In this meta-analysis, studies with ≥ 64 CT slices showed better agreement of EDV and ESV than studies with < 64 CT slices.
The correct determination of diastolic and
end-systolic phases is important for accurate measurement of ventricular volume (32, 54). The optimal reconstruction interval of cardiac CT has not been established, but it usually differs by 5% or 10% of the RR interval. Although the 5% interval reconstruction method may be expected to help accurate selection of the end-diastolic/end-systolic phase of the cardiac cycle better than the 10% interval, this meta-analysis showed that the reconstruction interval did not affect the evaluation of RV function on CT.
The volumetry method can be divided into the 2D-based Simpson’s method and 3D-based method. In CMRI
measurement, the 2D-based Simpson’s method is commonly used. However, it shows disadvantages such as incorrect basal slice selection and respiratory misregistration artifacts. Nevertheless, agreement was better in the RV functional parameters when the same method as CMRI (Simpson’s method) was used in CT volumetry. Moreover, there was a tendency for overestimation of EDV and ESV in the 3D-based method on CT compared to 2D-based CMRI. This result mainly depends on the difference in principles between the two volumetry methods, since the 2D-based Simpson’s method calculates the chamber volume by multiplying the cross-sectional area of each short-axis slice by slice thickness plus inter-slice gap and fails to truly reflect the full anatomical detail of RV. In this context, we should note that 2D CMRI may not represent the actual volume of the cardiac chamber because it mainly relies on the Simpson’s method, as shown in a phantom study (6), even CMRI is currently accepted as the reference standard. In addition to the volumetry method, the early timing of the end-diastolic phase with CMRI compared with cardiac CT and the partial volume effects of CT segmentation could be factors resulting in the overestimation of volume with CT, particularly with right ventricular EDV (54).
Moreover, CT attenuation of RV can be a contributing factor, since 3D-based volumetry methods are mostly performed using a threshold-based, region-growing method, which relies on CT attenuation of the RV cavity after contrast administration. However, segmentation with CT images can lead to blurring of the endocardial contour and contain larger parts of the myocardium in the RV cavity in comparison with CMRI, especially in cases of the CT contrast protocol focused on examining the coronary artery (25). Koch et al. (11) compared the two methods in the same patient population and showed insufficient correlation in the 3D-based method, with inhomogeneous contrast enhancement of RV as the probable reason.
Previous studies on ventricular volumetry with CMRI reported that inclusion of the papillary muscle and trabeculation resulted in significant differences in left ventricular volume measurement, up to 25% for EDV and 68% for ESV, and in RV volume measurement, up to 15% for the EDV index and 21% for ESV (30, 33, 55, 56). Although the inclusion of the papillary muscle may overestimate the RV volume, most studies in this meta-analysis included the papillary muscle and trabeculation in the RV cavity with CMRI, while the methods used with CT differed among studies. This meta-analysis showed better agreement in all RV functional parameters when the papillary muscle and trabeculation were included in the RV cavity on CT, probably because of the same segmentation method used in CT and CMRI.
There are several limitations in this meta-analysis. First, the patient characteristics including disease category were different among studies. Second, other variables that could affect the accuracy of RV volume, such as slice thicknesses of CT and CMRI and magnetic field strength of CMRI, were not considered, as most included studies applied the same slices for image reconstruction in CT and CMRI, and used the 1.5T MRI scanner. Third, significant heterogeneity was observed in all studies in this meta-analysis. Although we performed a subgroup analysis for the associated factors, heterogeneity in all subgroups was significant. Finally, the segmentation methods used with CMRI were uniform in this study, and studies with 3D-CMRI were not included because no study met the eligibility criteria.
In conclusion, cardiac CT is reliable for measurement of RV volume and function compared to CMRI, although significant inter-study heterogeneity is observed. Moreover, an RV-dedicated CT contrast protocol, ≥ 64 CT slices, and use of the same CT volumetric method as CMRI (Simpson’s method and inclusion of the papillary muscle and trabeculation in the RV cavity) can improve agreement with CMRI.
Supplementary Materials
The Data Supplement is available with this article at https://doi.org/10.3348/kjr.2019.0499.
Conflicts of Interest
The authors have no potential conflicts of interest to disclose.
Acknowledgments
We thank Na Won Kim, PhD (Yonsei University Medical Library) for her assistance in literature search.
ORCID iDs
Young Joo Suh
https://orcid.org/0000-0002-2078-5832 Jin Young Kim
https://orcid.org/0000-0001-6714-8358 Kyunghwa Han
https://orcid.org/0000-0002-5687-7237 Young Jin Kim
https://orcid.org/0000-0002-6235-6550 Byoung Wook Choi
https://orcid.org/0000-0002-8873-5444
REFERENCES
1. de Groote P, Millaire A, Foucher-Hossein C, Nugue O, Marchandise X, Ducloux G, et al. Right ventricular ejection fraction is an independent predictor of survival in patients with moderate heart failure. J Am Coll Cardiol 1998;32:948-954
2. van Wolferen SA, Marcus JT, Boonstra A, Marques KM, Bronzwaer JG, Spreeuwenberg MD, et al. Prognostic value of right ventricular mass, volume, and function in idiopathic pulmonary arterial hypertension. Eur Heart J 2007;28:1250-1257
3. Knauth AL, Gauvreau K, Powell AJ, Landzberg MJ, Walsh EP, Lock JE, et al. Ventricular size and function assessed by cardiac MRI predict major adverse clinical outcomes late after tetralogy of Fallot repair. Heart 2008;94:211-216
4. Marcus FI, McKenna WJ, Sherrill D, Basso C, Bauce B, Bluemke DA, et al. Diagnosis of arrhythmogenic right ventricular cardiomyopathy/dysplasia: proposed modification of the Task Force Criteria. Eur Heart J 2010;31:806-814
5. Oosterhof T, van Straten A, Vliegen HW, Meijboom FJ, van Dijk AP, Spijkerboer AM, et al. Preoperative thresholds for pulmonary valve replacement in patients with corrected tetralogy of Fallot using cardiovascular magnetic resonance. Circulation 2007;116:545-551
6. Sugeng L, Mor-Avi V, Weinert L, Niel J, Ebner C, Steringer-Mascherbauer R, et al. Multimodality comparison of quantitative volumetric analysis of the right ventricle. JACC Cardiovasc Imaging 2010;3:10-18
7. Abouzeid CM, Shah T, Johri A, Weinsaft JW, Kim J. Multimodality imaging of the right ventricle. Curr Treat Options Cardiovasc Med 2017;19:82
8. Galea N, Carbone I, Cannata D, Cannavale G, Conti B, Galea R, et al. Right ventricular cardiovascular magnetic resonance imaging: normal anatomy and spectrum of pathological
findings. Insights Imaging 2013;4:213-223
9. Prasad SK, Pennell DJ. Safety of cardiovascular magnetic resonance in patients with cardiovascular implants and devices. Heart 2004;90:1241-1244
10. Dupont MV, Dra˘gean CA, Coche EE. Right ventricle function assessment by MDCT. AJR Am J Roentgenol 2011;196:77-86 11. Koch K, Oellig F, Oberholzer K, Bender P, Kunz P, Mildenberger
P, et al. Assessment of right ventricular function by 16-detector-row CT: comparison with magnetic resonance imaging. Eur Radiol 2005;15:312-318
12. Lembcke A, Dohmen PM, Dewey M, Klessen C, Elgeti T, Hermann KG, et al. Multislice computed tomography for preoperative evaluation of right ventricular volumes and function: comparison with magnetic resonance imaging. Ann Thorac Surg 2005;79:1344-1351
13. Raman SV, Shah M, McCarthy B, Garcia A, Ferketich AK. Multi-detector row cardiac computed tomography accurately quantifies right and left ventricular size and function compared with cardiac magnetic resonance. Am Heart J 2006;151:736-744
14. Raman SV, Cook SC, McCarthy B, Ferketich AK. Usefulness of multidetector row computed tomography to quantify right ventricular size and function in adults with either tetralogy of Fallot or transposition of the great arteries. Am J Cardiol 2005;95:683-686
15. Plumhans C, Mühlenbruch G, Rapaee A, Sim KH, Seyfarth T, Günther RW, et al. Assessment of global right ventricular function on 64-MDCT compared with MRI. AJR Am J Roentgenol 2008;190:1358-1361
16. Schroeder J, Peterschroeder A, Vaske B, Butz T, Barth P, Oldenburg O, et al. Cardiac volumetry in patients with heart failure and reduced ejection fraction: a comparative study correlating multi-slice computed tomography and magnetic resonance tomography. Reasons for intermodal disagreement. Clin Res Cardiol 2009;98:739-747
17. Müller M, Teige F, Schnapauff D, Hamm B, Dewey M. Evaluation of right ventricular function with multidetector computed tomography: comparison with magnetic resonance imaging and analysis of inter- and intraobserver variability. Eur Radiol 2009;19:278-289
18. Guo YK, Yang ZG, Shao H, Deng W, Ning G, Dong ZH. Right ventricular dysfunction and dilatation in patients with mitral regurgitation: analysis using ECG-gated multidetector row computed tomography. Int J Cardiol 2013;167:1585-1590 19. Guo YK, Gao HL, Zhang XC, Wang QL, Yang ZG, Ma ES. Accuracy
and reproducibility of assessing right ventricular function with 64-section multi-detector row CT: comparison with magnetic resonance imaging. Int J Cardiol 2010;139:254-262 20. Jensen CJ, Wolf A, Eberle HC, Forsting M, Nassenstein
K, Lauenstein TC, et al. Accuracy and variability of right ventricular volumes and mass assessed by dual-source computed tomography: influence of slice orientation in comparison to magnetic resonance imaging. Eur Radiol 2011;21:2492-2502
21. Huang X, Pu X, Dou R, Guo X, Yan Z, Zhang Z, et al. Assessment of right ventricular function with 320-slice volume cardiac CT: comparison with cardiac magnetic resonance imaging. Int J Cardiovasc Imaging 2012;28 Suppl 2:87-92
22. Takx RA, Moscariello A, Schoepf UJ, Barraza JM Jr, Nance JW Jr, Bastarrika G, et al. Quantification of left and right ventricular function and myocardial mass: comparison of low-radiation dose 2nd generation dual-source CT and cardiac MRI. Eur J Radiol 2012;81:e598-e604
23. Lee H, Kim SY, Gebregziabher M, Hanna EL, Schoepf UJ. Impact of ventricular contrast medium attenuation on the accuracy of left and right ventricular function analysis at cardiac multi detector-row CT compared with cardiac MRI. Acad Radiol 2012;19:395-405
24. Gao Y, Du X, Liang L, Cao L, Yang Q, Li K. Evaluation of right ventricular function by 64-row CT in patients with chronic obstructive pulmonary disease and cor pulmonale. Eur J Radiol 2012;81:345-353
25. Fuchs A, Kühl JT, Lønborg J, Engstrøm T, Vejlstrup N, Køber L, et al. Automated assessment of heart chamber volumes and function in patients with previous myocardial infarction using multidetector computed tomography. J Cardiovasc Comput Tomogr 2012;6:325-334
26. Zhang XC, Yang ZG, Guo YK, Zhang RM, Wang J, Zhou DQ, et al. Assessment of right ventricular function for patients with rheumatic mitral stenosis by 64-slice multi-detector row computed tomography: comparison with magnetic resonance imaging. Chin Med J (Engl) 2012;125:1469-1474
27. Yamasaki Y, Nagao M, Yamamura K, Yonezawa M, Matsuo Y, Kawanami S, et al. Quantitative assessment of right ventricular function and pulmonary regurgitation in surgically repaired tetralogy of Fallot using 256-slice CT: comparison with 3-tesla MRI. Eur Radiol 2014;24:3289-3299
28. Maffei E, Messalli G, Martini C, Nieman K, Catalano O, Rossi A, et al. Left and right ventricle assessment with cardiac CT: validation study vs. cardiac MR. Eur Radiol 2012;22:1041-1049
29. Wang L, Zhang Y, Yan C, He J, Xiong C, Zhao S, et al. Evaluation of right ventricular volume and ejection fraction by gated (18)F-FDG PET in patients with pulmonary hypertension: comparison with cardiac MRI and CT. J Nucl Cardiol 2013;20:242-252
30. Freling HG, van Wijk K, Jaspers K, Pieper PG, Vermeulen KM, van Swieten JM, et al. Impact of right ventricular endocardial trabeculae on volumes and function assessed by CMR in patients with tetralogy of Fallot. Int J Cardiovasc Imaging 2013;29:625-631
31. Goo HW, Park SH. Semiautomatic three-dimensional CT ventricular volumetry in patients with congenital heart disease: agreement between two methods with different user interaction. Int J Cardiovasc Imaging 2015;31:223-232 32. Goo HW. Comparison between three-dimensional
quantifying ventricular volumes. Korean J Radiol 2018;19:704-714
33. Han Y, Osborn EA, Maron MS, Manning WJ, Yeon SB. Impact of papillary and trabecular muscles on quantitative analyses of cardiac function in hypertrophic cardiomyopathy. J Magn Reson Imaging 2009;30:1197-1202
34. Moher D, Liberati A, Tetzlaff J, Altman DG; The PRISMA Group. Preferred reporting items for systematic reviews and meta-analyses: the PRISMA statement. PLoS Med 2009;6:e1000097 35. Whiting PF, Rutjes AW, Westwood ME, Mallett S, Deeks JJ,
Reitsma JB, et al. QUADAS-2: a revised tool for the quality assessment of diagnostic accuracy studies. Ann Intern Med 2011;155:529-536
36. DerSimonian R, Laird N. Meta-analysis in clinical trials. Control Clin Trials 1986;7:177-188
37. Williamson PR, Lancaster GA, Craig JV, Smyth RL. Meta-analysis of method comparison studies. Stat Med 2002;21:2013-2025
38. Higgins JP, Thompson SG. Quantifying heterogeneity in a meta-analysis. Stat Med 2002;21:1539-1558
39. Egger M, Davey Smith G, Schneider M, Minder C. Bias in meta-analysis detected by a simple, graphical test. BMJ 1997;315:629-634
40. Kim KW, Lee J, Choi SH, Huh J, Park SH. Systematic review and meta-analysis of studies evaluating diagnostic test accuracy: a practical review for clinical researchers-part I. General guidance and tips. Korean J Radiol 2015;16:1175-1187
41. Schwarzer G. Meta: general package for meta-analysis. Available at: https://cran.r-project.org/package=meta. Accessed March 15, 2019
42. Pickett CA, Cheezum MK, Kassop D, Villines TC, Hulten EA. Accuracy of cardiac CT, radionucleotide and invasive ventriculography, two- and three-dimensional echocardiography, and SPECT for left and right ventricular ejection fraction compared with cardiac MRI: a meta-analysis. Eur Heart J Cardiovasc Imaging 2015;16:848-852
43. Rudski LG, Lai WW, Afilalo J, Hua L, Handschumacher MD, Chandrasekaran K, et al. Guidelines for the echocardiographic assessment of the right heart in adults: a report from the American Society of Echocardiography endorsed by the European Association of Echocardiography, a registered branch of the European Society of Cardiology, and the Canadian Society of Echocardiography. J Am Soc Echocardiogr 2010;23:685-713
44. Lang RM, Badano LP, Mor-Avi V, Afilalo J, Armstrong A, Ernande L, et al. Recommendations for cardiac chamber quantification by echocardiography in adults: an update from the American Society of Echocardiography and the European Association of Cardiovascular Imaging. Eur Heart J Cardiovasc
Imaging 2015;16:233-270
45. Shimada YJ, Shiota M, Siegel RJ, Shiota T. Accuracy of right ventricular volumes and function determined by three-dimensional echocardiography in comparison with magnetic resonance imaging: a meta-analysis study. J Am Soc Echocardiogr 2010;23:943-953
46. Dill T. Contraindications to magnetic resonance imaging: non-invasive imaging. Heart 2008;94:943-948
47. Rizvi A, Deaño RC, Bachman DP, Xiong G, Min JK, Truong QA. Analysis of ventricular function by CT. J Cardiovasc Comput Tomogr 2015;9:1-12
48. Gopalan D. Right heart on multidetector CT. Br J Radiol 2011;84:S306-S323
49. van Hamersvelt RW, Eijsvoogel NG, Mihl C, de Jong PA, Schilham AMR, Buls N, et al. Contrast agent concentration optimization in CTA using low tube voltage and dual-energy CT in multiple vendors: a phantom study. Int J Cardiovasc Imaging 2018;34:1265-1275
50. Zhang W, Ba Z, Wang Z, Lv H, Zhao J, Zhang Y, et al. Diagnostic performance of radiation-dose and low-contrast-dose (double low-dose) coronary CT angiography for coronary artery stenosis. Medicine (Baltimore) 2018;97:e11798
51. Iyama Y, Nakaura T, Yokoyama K, Kidoh M, Harada K, Oda S, et al. Low-contrast and low-radiation dose protocol in cardiac computed tomography: usefulness of low tube voltage and knowledge-based iterative model reconstruction algorithm. J Comput Assist Tomogr 2016;40:941-947
52. Scholtz JE, Ghoshhajra B. Advances in cardiac CT contrast injection and acquisition protocols. Cardiovasc Diagn Ther 2017;7:439-451
53. Kerl JM, Ravenel JG, Nguyen SA, Suranyi P, Thilo C, Costello P, et al. Right heart: split-bolus injection of diluted contrast medium for visualization at coronary CT angiography. Radiology 2008;247:356-364
54. Goo HW. Semiautomatic three-dimensional threshold-based cardiac computed tomography ventricular volumetry in repaired tetralogy of Fallot: comparison with cardiac magnetic resonance imaging. Korean J Radiol 2019;20:102-113
55. Weinsaft JW, Cham MD, Janik M, Min JK, Henschke CI, Yankelevitz DF, et al. Left ventricular papillary muscles and trabeculae are significant determinants of cardiac MRI volumetric measurements: effects on clinical standards in patients with advanced systolic dysfunction. Int J Cardiol 2008;126:359-365
56. Park EA, Lee W, Kim HK, Chung JW. Effect of papillary muscles and trabeculae on left ventricular measurement using cardiovascular magnetic resonance imaging in patients with hypertrophic cardiomyopathy. Korean J Radiol 2015;16:4-12