저작자표시-비영리-변경금지 2.0 대한민국 이용자는 아래의 조건을 따르는 경우에 한하여 자유롭게 l 이 저작물을 복제, 배포, 전송, 전시, 공연 및 방송할 수 있습니다. 다음과 같은 조건을 따라야 합니다: l 귀하는, 이 저작물의 재이용이나 배포의 경우, 이 저작물에 적용된 이용허락조건 을 명확하게 나타내어야 합니다. l 저작권자로부터 별도의 허가를 받으면 이러한 조건들은 적용되지 않습니다. 저작권법에 따른 이용자의 권리는 위의 내용에 의하여 영향을 받지 않습니다. 이것은 이용허락규약(Legal Code)을 이해하기 쉽게 요약한 것입니다. Disclaimer 저작자표시. 귀하는 원저작자를 표시하여야 합니다. 비영리. 귀하는 이 저작물을 영리 목적으로 이용할 수 없습니다. 변경금지. 귀하는 이 저작물을 개작, 변형 또는 가공할 수 없습니다.
Regulation of cancer progression
by hepatitis B virus X protein (HBx) and HBxAP/RSF1
by
Mi-Young Cho
Major in Cancer Biology
Department of Biomedical Sciences
The Graduate School, Ajou University
Regulation of cancer progression
by hepatitis B virus X protein (HBx) and HBxAP/RSF1
by
Mi-Young Cho
A Dissertation Submitted to The Graduate School of
Ajou University in Partial Fulfillment of The Requirements
for The Degree of Ph.D. of Biomedical Sciences
Supervised by
Hyeseong Cho, Ph.D.
Major in Cancer Biology
Department of Biomedical Sciences
The Graduate School, Ajou University
This certifies that the dissertation
of Mi-Young Cho is approved.
SUPERVISORY COMMITTEE
Jae-Ho Lee
Hyeseong Cho
Chang-Woo Lee
Jae Youn Cheong
Youngsoo Lee
The Graduate School, Ajou University
December 18
th, 2015
i
-ABSTRACT-
Regulation of cancer progression
by hepatitis B virus X protein (HBx) and HBxAP/RSF1
Hepatitis B virus X protein (HBx), encoded by hepatitis B virus (HBV) genome, plays a crucial role in the pathogenesis of liver cancer, and we previously showed that reactive oxygen species (ROS) significantly elevated the HBx protein levels. First, I herein investigated the role of antioxidants in regulation of HBx protein expression and their clinical relevance. Overexpression of catalase or superoxide dismutase 2 (MnSOD) induced a significant decrease in HBx expression level. Complete disruption for cysteine residues in HBx protein resulted in a dramatically reduced HBx protein level and this HBx Cys-null (Cys-) mutant no longer responded to catalase, suggesting that disulfide bonds in HBx are important for its protein stability. Moreover, Huh7-Cys- cells failed to generate colonies in clonogenic survival assays, while Huh7 cells expressing wild-type HBx (Huh7-X) yielded a significant number of colonies. Next, I analyzed 50 human HBV-induced hepatocellular carcinoma (HCC) samples. Seventy-eight percent of HCC samples contained lower catalase levels than surrounding tissues. Importantly, patients with a high T/N (tumor/non-tumor tissue) ratio for catalase showed significantly longer survival than those with a low T/N ratio. Interestingly, there was a significant inverse relationship between catalase and HBx expression levels in stage IV HCCs. Thus, catalase expression in HCC patients can be clinically useful for prediction of patient survival and restoration. Second, HBx in the host cells was found to be tightly associated with protein called HBxAP (HBx-associated protein), which was identified as a subunit of chromatin remodeler RSF complex. I found that RSF1 protein was overexpressed in HBV-related HCC specimens along with elevated HBx protein compared to those in surrounding liver tissues. Notably, depletion of RSF1 induced the premature separation of sister chromatids and fluorescence resonance energy transfer (FRET) analysis revealed that centromeric H3K9me3 levels were reduced in mitotic RSF1 depleted
ii
cells. Moreover, in histone peptide array RSF1 widely bound to modified histone H3 peptides except that it no longer interacted with the phosphorylated histone H3 peptide at the Ser28. Further investigation is needed to reveal underlying mechanisms by which RSF1 regulates chromosomal instability. Taken together, these findings suggest that HBx and RSF1 contribute to liver cancer development.
iii
TABLE OF CONTENTS
ABSTRACT ... i
TABLE OF CONTENTS...iii
LIST OF FIGURES ... vi
LIST OF TABLES ... viii
I. Regulation of catalase on hepatitis B virus X protein (HBx) in HBV-related advanced hepatocellular carcinomas... 1
A. INTRODUCTION ... 2
B. MATERIALS AND METHODS……….4
1. Cell cultures and plasmids………4
2. RNA extraction, reverse transcription-polymerase chain reaction ... 4
3. Western blotting . ... 5
4. Luciferase assay ... 5
5. Clonogenic cell proliferation assays ... 5
6. Patient’s characteristics... 6
7. Statistics ... 6
C. RESULTS ... 7
1. The protein levels of HBx are decreased by catalase and MnSOD ... 7
2. Catalase downregulates HBx protein levels at the translational level ... 7
3. Cysteine residues of HBx are essential to maintain protein stability ... .9
iv
5. Cysteine null mutant is not affected by catalase or N-acetyl cysteine………12
6. Cysteine residues are important for HBx-mediated clonogenic cell proliferation………...14
7. Catalase expression level is lower in tumor tissues than in non-tumor tissues in HBV-related HCC………..……….17
8. Catalase expression level is significantly lower in HBV-related advanced HCC………..………..17
9. HBx protein levels are negatively correlated with catalase expression in HBV-related advanced HCC………...20
10. HBx protein levels have no correlation with MnSOD expression in HBV-related advanced HCC………23
11. Prognostic significance of catalase expression in HBV-related advanced HCC………....23.
D. DISCUSSION ... 30
II. HBxAP/RSF1 as a chromatin remodeller and HBx-associated protein ... 32
A. INTRODUCTION ... 33
B. MATERIALS AND METHODS ... .36
1. Cell cultures and antibody...36
2. Plasmid………..………...…..36
3. Chromosome spreading and Giemsa staining……….36
4. FRET (Fluorescence Resonance Energy Transfer) assay……...………37
5. Modified histone peptide array………...37
v
7. Protein microchip array………. ….……….. 37
C. RESULTS………..39
1. RSF1 is overexpressed in HBV-related advanced HCC……...………..39
2. RSF1 depletion induces premature separation of sister chromatids...39
3. The centromeric expression level of H3K9me3 is downregulated at metaphase in RSF1 knock-down cells………..………..43
4. RSF1 depletion enhances the expression levels of H3K9me3 and H3K27me3 in mitosis………46
5. RSF1 dissociates from histone peptides with phosphorylated H3S28 modification………46
6. RSF1 directly interacts with diverse targets………...…………48
D. DISCUSSION... 51
III. CONCLUSION ... 53
IV. REFFERENCE ... 54
vi
LIST OF FIGURES
Fig. 1. The protein levels of HBx are decreased by catalase and MnSOD ... .8 Fig. 2. Catalase downregulates HBx protein levels at the translational level ... 10 Fig. 3. Cysteine residues of HBx are essential to maintain protein stability ... 11 Fig. 4. Cysteine null mutant of HBx is insufficient for transactivation activities.. ... 13 Fig. 5. Cysteine null mutant is not affected by catalase or N-acetyl cysteine ... 15 Fig. 6. Cysteine residues are important for HBx-mediated clonogenic cell proliferation……….…….….16 Fig. 7. The protein level of catalase is lower in tumor than those in non-tumor in HBV-related HCC specimens………... 18 Fig. 8. Catalase expression level is significantly lower in HBV-related advanced HCC specimens.. ... 19 Fig. 9. HBx protein levels are negatively correlated with catalase expression in
HBV-related advanced HCC. ... 21 Fig. 10. HBx protein levels have no correlation with MnSOD expression in
HBV-related advanced HCC...24 Fig. 11. A schematic models………...35 Fig. 12. RSF1 is overexpressed in HBV-related advanced hepatocellular carcinomas………....…40 Fig. 13. RSF1 is important for mitotic centromere cohesion……...…………..……41 Fig. 14. The centromeric expression level of H3K9me3 is not increased at metaphase
in RSF1 knock-down cells………..……….…….…….44 Fig. 15. The levels of H3K9me3 and H3K27me3 are increased in mitotic shRSF1
vii
cells………...47 Fig. 16. RSF1 dissociates from histone peptides with phosphorylated H3S28
modification………..49 Fig. 17. Binding partners of RSF1………...50
viii
LIST OF TABLES
Table 1. Correlation between survival and clinicopathological characteristics in 44 HCCs..25 Table 2. Effects of catalase expression and clinicopathological characteristics on overall
survival of HCC patients in multivariate analysis………...26 Table 3. Correlation between catalase expression and clinicopathological characteristics in
44 HCCs……….27 Table 4. Correlation between HBx expression and clinicopathological characteristics in 44
HCCs………..28 Table 5. Correlation between MnSOD expression and clinicopathological characteristics in
1
I. Regulation of catalase on hepatitis B virus X
protein (HBx) in HBV-related advanced
2
A. INTRODUCTION
Hepatocellular carcinoma (HCC) is a common malignancy, accounting for nearly one million deaths worldwide every year (Thun et al., 2010). Chronic infection with hepatitis B virus (HBV) is a major predisposing factor for the development of HCC. Vaccination of newborns against HBV is an effective preventive measure; however, approximately 54% of HCC cases worldwide are still associated with chronic HBV infection (Parkin et al., 2001). Surgical resection, percutaneous ablation and liver transplantation are major curative modalities, but they are limited to patients with early HCC. A large proportion of patients is diagnosed with advanced stages of HCC and therefore has fewer treatment options. Understanding the molecular mechanism by which HBV infection increases the incidence of HCC could lead to strategies for prevention and therapeutic intervention in the diseases.
HBV, a member of the Hepadnaviridae family, contains a 3.2-kb genome that encodes four overlapping open reading frames (ORFs). The molecular etiology of HBV-induced HCC remains unclear; however, the multifunctional HBV X protein (HBx) has implicated in cancer development. HBx plays an important role in the maintenance of viral replication, and directly stimulates several cellular kinases involved in cell proliferation and transformation (Calvisi et al., 2006; Matter et al., 2014). HBx residing in mitochondria triggers chronic inflammatory responses through activation of the nuclear factor kappa B (NF-κB) signaling pathway as well as induction of interleukins and cyclooxygenase-2 (COX-2) expression (Lara-Pezzi et al., 1998; Lim et al., 2010). Moreover, HBx in hepatocytes is largely responsible for lipid peroxidation and hepatic steatosis (Kim et al., 2007; Na et al., 2009), aggravating oxidative liver injury. Thus, reducing or eliminating HBx protein in HBV-infected patients represents an attractive strategy for intervening in disease progression. To date, several cellular regulators such as DDB1 (Damaged DNA-Binding protein 1), PIN1 (Peptidyl-prolyl cis/trans isomerase NIMA interacting 1) and SIAH1 (Seven in absentia homolog 1) (Bergametti et al., 2002; Pang et al., 2007; Zhao et al., 2011) have been proposed to control HBx protein levels. However, their clinical relevance to disease progression remains largely unknown.
3
diseases. In HBV-infected livers, oxidative stress activates hepatic stellate cells, and chronic activation of stellate cells not only triggers fibrogenesis but also stimulates proliferation of hepatocytes, increasing the likelihood of HCC development. We previously showed that an increase of reactive oxygen species (ROS) levels in cells dramatically enhanced the stability of HBx protein (Wang et al., 2003). Moreover, HBx-positive hepatocytes were mainly found in the periportal region where necroinflammatory activity is high (Jin et al., 2001). Since HBx also increases intracellular ROS level through mitochondrial damage (Lee et al., 2004), it is possible that a feedback loop develops between HBx and ROS under chronic oxidative stress conditions. Thus, intervening in this feedback loop would be an effective way to prevent further disease progression. Antioxidant molecules such as catalase, superoxide dismutase (SOD) and glutathione peroxidase decrease oxidative stress; in fact, compensatory up-regulation of MnSOD has been found under oxidative stress conditions (Connor et al., 2007).
In the present study, we investigated the role of antioxidants in regulating HBx expression and assessed their clinical relevance in HBV-related HCC tissues. We found that catalase dramatically decreased HBx levels and cysteine residues of HBx are important for stability of HBx protein. In addition, we found that relative catalase expression in tumors compared to normal liver tissues can be clinically useful for predicting patient survival.
4
B. MATERIALS AND METHODS
1.
Cell cultures and plasmidsThe Huh7 human hepatoma cell line (JCRB0403) and human Chang liver cell line (JCRB9066) were obtained from the Health Science Research Resources Bank (Osaka, Japan) in 1996 and have been maintained in our laboratory. The Chang X-34 cell line was established in our laboratory by transfecting the plasmids of pTetX and pUHD172-1 into the Chang cells (Yun et al., 2000). All the cell lines were maintained in Dulbecco’s modified Eagle minimal essential medium (DMEM) (GIBCO-BRL, Grand Island, NY), supplemented with 10% fetal bovine serum (FBS). A microbial contamination screening for mycoplasma has been routinely carried out every three months. Hepatic characteristics of these cell lines were authenticated by determining albumin mRNA expression in 2011.
HBx full-length DNA (adr subtype) was amplified from the HBx/pcDNA3.1+ plasmid and subcloned into p3xFLAG-CMV-10 vectors. Four cysteine mutants of HBx were generated by replacing Cys to Ser and subcloned into p3xFLAG-CMV-10 vectors. The HBV 1.2-mer replicon, nuclear localization signal (NLS)-, nuclear export signal (NES)-HBx and human COX-2 promoter linked to luciferase reporter constructs were used as previously described (Lim et al., 2010)
.
2.
RNA extraction, reverse transcription-polymerase chain reactionTotal RNA was extracted from hepatoma cells using Trizol reagent (Ambion) according to the manufacturer’s instructions. First strand cDNA was synthesized from 1 ug of total RNA by using ReverTra Ace qPCR RT Master Mix (TOYOBO). The expression level of HBx was determined by reverse transcription-PCR using C1000 Touch Thermal Cycler (Bio-rad) and normalized with GAPDH. The primer sets used for HBx were as follows: sense 5’-AGGATCTATGGCTGCTAGGCT-3’ and antisense GGTACCCTAGGCAGAGGTGAA-3’; for GAPDH, sense CCATGGAGAAGGCTGGGG-3’ and antisense 5’-CACTGACACGTTGGCAGTGG-3’. PCR was performed with 25-30 cycles of the reaction
5
involving 95°C for 30 seconds, 55-62°C for 30 seconds, and 72°C for 60-90 seconds. Reactions were assayed in triplicate.
3.
Western blottingEach of the fresh frozen tumor and surrounding non-tumor liver tissues were lysed with RIPA buffer (50 mM Tris-HCl (pH 7.4), 150 mM NaCl, 1% NP-40%, 0.1% sodium dodecyl sulfate, 0.1% sodium deoxycholate, 5 mM ethylene-diaminetetraacetic acid and 5 mM ehtyleneglycol-bis(aminoethylether)-tetraacetic acid) supplemented with protease and phosphatase inhibitor. After centrifugation at 13,000 r.p.m. for 15 min at 4℃, lysates were collected. The lysates (20 ug) was boiled for 5 min in sample buffer. Samples were then resolved by sodium dodecyl sulfate-polyacrylamide gels and transferred electrophoretically to nitrocellulose membranes (Bio-rad). The blots were incubated in blocking buffer (Tris-buffered saline containing 5% non-fat milk and 0.1% Tween-20) for 1h at room temperature and then incubated with primary antibody for overnight at 4℃. The blots were incubated with horseradish peroxidase-conjugated secondary antibody for 1 h at room temperature. The immunoblots were visualized by enhanced chemiluminescence system (GE). Specific antibody for HBx was generated from rabbit. The primary antibodies used were rabbit anti-catalase (Ab Frontier), rabbit anti-MnSOD (Ab Frontier), rabbit anti-GAPDH (Santa Cruz), rabbit anti-Pin1 (Cell Signaling), mouse anti-DDB1 (Santa Cruz) and mouse anti-flag (Sigma).
4. Luciferase assays
HBx WT and 4 cysteine mutant constructs were transfected into Huh7 cells. Transfected cells were harvested at 48 hr after transfection. Luciferase assays were performed with the Dual-Luciferase Reporter Assay system (Promega) as instructed by the manufacturer.
5. Clonogenic cell proliferation assays
6
were seeded in 6-well plates and maintained in complete medium for 2 weeks. Colonies were stained with a mixture of 6% glutaraldehyde and 0.5% crystal violet for 12 hrs then rinsed with tap water.
6. Patient’s characteristics
Between June, 2005 and May, 2010 over 100 patients with HCC who underwent hepatectomy at Ajou University Hospital were enrolled in this study. A total of 100 paired specimens (tumor and surrounding non-tumor tissues) were obtained after hepatectomy. Of the 100 patients, 44 patients with available follow-up data were eligible for analysis of the association between clinicopathological features and overall survival. All patients were chronic carriers of HBV. Tumor stages were determined according to a modified UICC staging system.
7. Statistics
Each experiment was repeated at least three times. Statistical significance was determined by comparing mean values (± standard error of the mean: SEM) using Student’s t-test and was assumed for p<0.05 (*), p<0.01 (**) and p<0.005 (***). The expression levels of HBx, catalase and MnSOD protein in tumor tissues and surrounding non-tumor tissues were compared using Wilcoxon’s signed rank test. Spearman’s rho correlation analysis was used to determine the correlation between HBx and catalase protein levels. To further evaluate the prognostic value of the subjects, we determined the cutoff points of the expression ratios (T/N) of catalase and HBx based on western blotting. After measuring the p values of many possible cases, 0.8- and 4.5-fold were taken to be the cutoff values with the minimum p values for catalase and HBx, respectively. In cases with <0.8 T/N expression ratio of catalase in HCC patients, the expression of catalase was considered to be low expression.
Overall survival analysis was estimated using the Kaplan-Meier method. To determine the correlation between catalase or HBx and clinicopathological characteristics, we used either Fisher’s exact test or Pearson’s chi-square. Data analysis was conducted using the SPSS software (Version 18).
7
C. RESULTS
1. The protein levels of HBx are decreased by catalase and MnSOD.
In our previous work, we found that the HBx level in liver cells was sensitive to ROS levels, such that oxidative stress conditions significantly augmented HBx levels (Yun et al., 2002; Wang et al., 2003). Here, we examined whether the ROS scavengers, catalase and MnSOD suppressed HBx expression levels. Consistent with our previous findings, hydrogen peroxide (H2O2) treatment of HBx-expressing ChangX-34 cells, previously established in our laboratory (Yun et al., 2000),markedly upregulated HBx protein levels at 18 h after treatment (Figure 1A). Notably, introduction of MnSOD into Chang X-34 cells induced a significant reduction in HBx levels (Fig. 1B). We further tested the relationship between ROS and HBx levels by transiently transfecting Huh7 liver cancer cells with the HBx gene and found that HBx levels in these cells were also significantly reduced by MnSOD or catalase (Figure 1C). HBx is prevalent in the cytoplasm, but is also found in the nucleus and mitochondria (Sirma et al., 1998).We therefore, transfected Huh7 cells with HBx fusion constructs containing a nuclear localization signal (pNLS-HBx) or nuclear export signal (pNES-HBx), which promote translocation into or out of the nucleus of cells, respectively. Regardless of HBx subcellular localization, HBx levels were significantly reduced by overexpression of MnSOD or catalase (Figure 1D). Next, we examined whether antioxidants control the level of HBx protein expressed from the endogenous HBx promoter in the HBV genome. As shown in Figure 1E, HBx expressed from the HBV genome was consistently decreased in MnSOD or catalase overexpressed contexts, in which the core antigen level was not affected.
2. Catalase downregulates HBx protein levels at the translational level.
To examine whether this effect of antioxidants on HBx protein levels occurred at the transcriptional level, we determined HBx mRNA levels by reverse transcription-polymerase
8
Fig. 1. The protein levels of HBx are decreased by catalase and MnSOD. (A, B) Stably
HBx-expressing Chang X-34 cells were treated with 0.5 mM H2O2 in a time-dependent manner. Doxycycline-induced HBx protein in Chang X-34 cells was decreased by the overexpression of MnSOD. (C) Huh7 cells were cotransfected with Myc-tagged HBx plus catalase or MnSOD using the PEI method. (D, E) pNES-HBx, pNLS-HBx or HBV 1.2mer construct were transfected into Huh7 cells along with MnSOD or catalase.
9
chain reaction (RT-PCR) and found that HBx mRNA levels were unchanged (Figure 2A). In contrast, the reduction in HBx accumulation observed in the presence of catalase was completely reversed by treatment with the proteasome inhibitor MG132 (Figure 2B). Taken together, our findings strongly suggest that antioxidants act as powerful regulators that reduce the steady-state level of HBx protein in liver cells at the translational level.
3. Cysteine residues of HBx are essential to maintain protein stability.
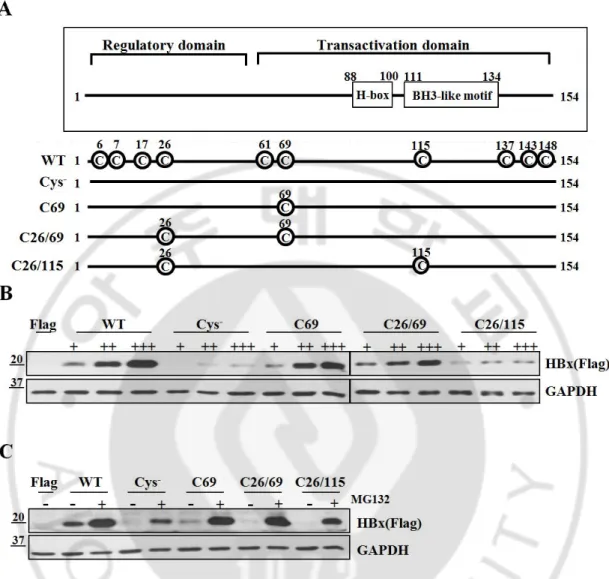
HBx has 8 to 10 conserved cysteine residues depending on HBV subtypes (Sidhu et al., 2014). Since HBx level was sensitive to antioxidants, we hypothesized that the stability of HBx protein could be regulated through cysteines, the residues most reactive to intracellular redox status. It is shown that cysteine residues in HBx protein form intra-molecular disulfide bonds as well as inter-molecular disulfide bonds, the latter of which contributes to dimerization of HBx proteins (Gupta et al., 1995; Sidhu et al., 2014).As a functional motif of HBx , the H-box motif and BH3-like motif have been reported. HBx interacts with the DDB1 of CUL4-DDB1 E3 machinery via its H-box motif and HBx protein stability can be regulated (Li et al., 2010). In addition, HBx binds to Bcl-2 and Bcl-XL through its BH3-like motif, which affects several cellular processes (Kusunoki et al., 2014). To test the role of HBx cysteine residues, we first generated four different cysteine mutants: one with no cysteines (Cys-), one with a single cysteine remaining at residue 69 (C69), one with two cysteines remaining at residues 26 and 69 (C26/69) and one with two cysteines remaining at residues 26 and 115 (C26/115) (Figure 3A). All the cysteine mutants were generated by replacing Cys to Ser. When these constructs were transfected into Huh7 cells, basal HBx expression levels were quite different among these transfectants (Figure 3B). WT-HBx showed high, stable protein levels, whereas the cysteine mutants showed relatively lower HBx levels. At increasing concentrations (1, 2, 4 mg), both C69 and C26/69 mutant constructs produced stable, dose-dependent accumulation of HBx protein, similar to WT-HBx (Figure 3B). In contrast, the Cys -and C26/115 mutants barely produced HBx protein, suggesting that the cysteine at position 69 is critical for HBx stability. The expression levels of all cysteine mutants were significantly elevated in the presence of MG132 (Figure 3C).
10
Fig. 2. Catalase downregulates HBx protein levels at the translational level. (A) Total
cellular mRNA from transfected Huh7 cells with HBx and catalase were analyzed for HBx mRNA expression. (B) After Huh7 cells were transfected with HBx and catalase, cells were incubated with or without the proteasome inhibitor, MG132 (20 mM) for 4 hrs. The HBx expression level was detected by Western blotting.
11
Fig. 3. Cysteine residues of HBx are essential to maintain protein stability. (A) Schematic
diagram showing WT-HBx and four different cysteine mutants of HBx. All the cysteine mutants were generated by replacing Cys to Ser. (B) Huh7 cells were transfected with WT-HBx and four types of cysteine mutants of WT-HBx in a dose-dependent manner. (C) After transfection of WT-HBx and four cysteine mutants into Huh7 cells, 20 mM MG132 was treated on transfected cells for 4 hrs.
12
4. Cysteine null mutant of HBx is insufficient for transactivation activities.
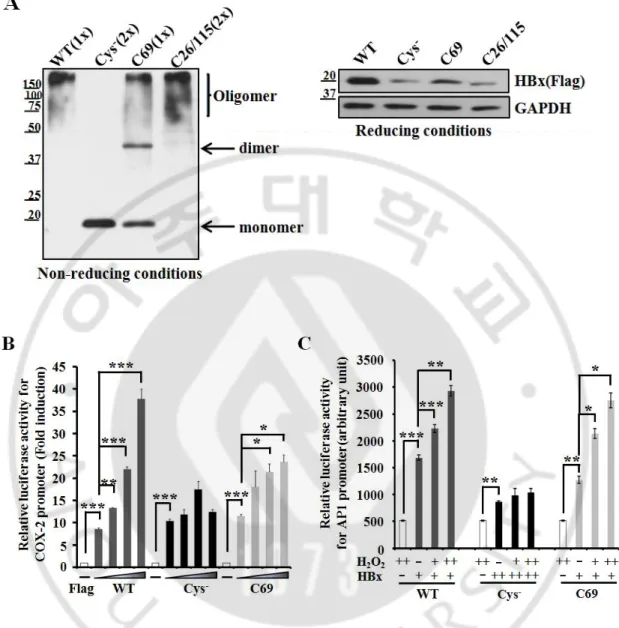
We next examined whether these proteins formed dimers or oligomers. Under non-reducing conditions, the Cys--HBx protein existed exclusively as a monomer, whereas the C69-HBx protein formed not only a monomer but also dimers and oligomers (Figure 4A). On the basis of these results, we postulate that HBx dimer formation requires specific cysteine residues, which likely mediate formation of disulfide linkages between HBx molecules. However, dimeric HBx readily formed oligomers in cells that do not use cysteine residues. Similar to WT-HBx, the C26/115 mutant retaining two cysteine residues primarily formed oligomers.
We previously reported that HBx transactivated the promoter of cyclooxygenase-2 (COX-2), mediator of inflammatory responses (Lim et al., 2010).WT-HBx significantly increased the promoter activity of COX-2 in a dose-dependent manner. Both the Cys- and C69 mutants were able to activate the COX-2 promoter; however, dose-dependent increases of luciferase activity were not observed with the Cys- mutant. The C69 mutant also showed a dose-dependent increase in its transactivation function on the COX-2 promoter (Figure 4B). Next, we addressed whether ROS-induced augmentation of HBx levels is correlated to its transactivation function. Since the COX-2 promoter may be activated by H2O2 through different signaling pathways, we transfected the AP-1 promoter-fused luciferase reporter along with HBx constructs and treated with H2O2 for 10 hrs. We found that both wild-type HBx and C69 showed a significant increase in AP-1 luciferase activities. In contrast, there was no increase in luciferase activity with the Cys- mutant (Fig. 4C). Taken together, our data reveal that cysteine residues of the HBx protein are central to maintaining HBx protein stability and its transactivation activity in liver cells.
5. Cysteine null mutant is not affected by catalase or N-acetyl cysteine.
We next asked whether antioxidants affected the expressions of Cys- and C69 mutants. Since basal expression of the Cys- mutant was weak, we transfected a 2-fold higher
13
Fig. 4. Cysteine null mutant of HBx is insufficient for transactivation activities. (A)
WT-HBx and the other three cysteine mutants were overexpressed in Huh7 cells and Western blotting was performed under non-reducing and reducing conditions. (B, C) The COX-2 promoter (-327/+59)-Luc reporter or the AP-1 promoter-Luc reporter construct was transiently transfected with the indicated plasmids (WT-HBx (0.1 mg), Cys--HBx (0.2 mg) or C69-HBx (0.1 mg)) in Huh7 cells. Data shown are mean ± SEM of three independent experiments. Statistically significant differences are indicated: *p<0.05, **p<0.01, ***p<0.005; Student’s t-test.
14
concentration of Cys- cDNA than WT-HBx. Notably, expression of the Cys--HBx was barely affected by co-expression of catalase, whereas the basal expression of WT-HBx was consistently reduced (Figure 5A). On the other hand, the levels of the C69-HBx protein were moderately reduced by catalase overexpression. Reduction in HBx levels by catalase was restored by treatment with proteasome inhibitors, MG132 and Lactacystin (Figure 5A), indicating that reduction in HBx levels by catalase occur at the post-translational level. Similar results were obtained by exposing cells to the antioxidant chemical, N-acetyl-cysteine (NAC) (Figure 5B). These findings suggested that HBx cysteine mutants are resistant to antioxidants in maintenance of HBx levels.
6. Cysteine residues are important for HBx-mediated clonogenic cell proliferation.
Next, we used clonogenic cell proliferation assays to investigate whether the monomeric Cys- mutant exerted an effect on cell function. To this end, we established two stable Huh7 cell lines, one expressing WT-HBx (Huh7-X) and the other expressing Cys--HBx (Huh7-Cys-). These cell lines were produced by transfecting Huh7 cells with different concentrations of Flag-tagged WT-HBx or Flag-tagged Cys--HBx and the G418-resistant clones were selected. After determining expression levels of Flag-WT-HBx and Flag-Cys--HBx among different clones by Western blotting, we chose two stable clones that showed similar expression levels of HBx (Figure 6A, lower panel). Huh7-X cells generated a significant number of colonies, whereas Huh7-Cys- cells were barely able to form them (Figure 6A, upper panel). Thus, Cys- -HBx conferred little in the way of cell proliferation or survival advantage. In addition, NAC treatment reduced the number of Huh7-X cell colonies by more than 50% (Figure 6B), showing that the HBx expression level directly affects cellular behavior. Collectively, in addition to protein stability, cysteine residues of HBx are important for acquiring clonogenic proliferation advantage.
15
Fig. 5. Cysteine null mutant is not affected by catalase or N-acetyl cysteine. (A) Huh7
cells were transiently transfected with either WT-HBx, (0.1 mg), Cys--HBx (0.2 mg) or C69-HBx (0.1 mg) in conjunction with catalase (1 or 2 mg). At lanes 5, 9 and 13, the transfected cells were treated with 20 mM MG132 for 4 hrs (upper panel). In lower panel, 10 mM Lactacystin was treated into transfected cells for 8 hrs. (B) After transfection with WT-HBx, Cys--HBx or C69-HBx in Huh7 cells, the transfected cells were treated with N-Acetyl-Cysteine in a dose-dependent manner.
16
Fig. 6. . Cysteine residues are important for HBx-mediated clonogenic cell proliferation.
(A, B) WT-HBx (0.5 mg) or Cys--HBx (1 mg) plasmids were transfected into Huh7 cells and the transfected cells were selected in the presence of G418. The effect of N-Acetyl-Cysteine on Huh7-X or Huh7-Cys- stable cell lines was determined using clonogenic cell proliferation assay. Data shown are mean ± SEM of three independent experiments. Statistically significant differences are indicated: ***p<0.005; Student’s t-test.
17
7. Catalase expression level is lower in tumor tissues than in non-tumor tissues in HBV-related HCC.
To address clinical relevance of our findings, we examined whether HBx levels were correlated with antioxidant molecules in HBV-related HCC patients. We first screened more than 100 cases of paired samples of tumor and surrounding non-tumor tissues from HCC patients using Ponceau S staining or by determining GAPDH (glyceraldehyde-3-phosphate dehydrogenase) expression levels. From these samples we selected 50 paired specimens that showed similar GAPDH expression or protein levels in each sample of the pair. Among 50 paired samples from HCCs patients, 45 (90%) tumor samples showed much higher levels of HBx protein than surrounding non-tumor samples (Figure 7A); conversely, catalase expression level was significantly lower in most tumor samples (78%). In the case of MnSOD, 18 (36%) of 50 paired tissues showed higher expression levels in tumor than in normal whereas 22 (44%) of 50 tissues showed increased expression levels in normal tissues. In addition, PIN1 and DDB1 proteins, also known to regulate HBx protein stability (9-10), were significantly overexpressed in tumor tissues in 35 (87.5%) samples and in 19 (42.2%) samples, respectively (Figure 7A). To further investigate the differences in protein expression level between tumor tissues and non-tumor tissues, we performed densitometric analysis of Western blots and statistical analysis using box plots. Regardless of HCC stages, HBx expression level normalized with GAPDH was about 3 fold higher in tumor tissues than in non-tumor tissues (*** p<0.005; Wilcoxon’s signed-rank test). Conversely, catalase expression was much lower in tumor tissues than in non-tumor tissues (**p<0.01; Wilcoxon’s signed-rank test). MnSOD expression also showed a reduction in tumor tissues although this difference was weaker than catalase (Figure 7B).
8. Catalase expression level is significantly lower in HBV-related advanced HCC.
Next, we analyzed the data by tumor stages and we reached the same conclusion (Figure 8A, 8B), demonstrating that HBx protein levels were all elevated in tumor tissues regardless of
18
Fig. 7. The protein level of catalase is lower in tumor than those in non-tumor in HBV-related HCC. (A) Representative images of expression level of HBx, catalase, MnSOD, PIN1
and DDB1 in 10 paired HCCs (T) and surrounding non-tumor liver tissues (N) by Western blotting. (B) Statistical analysis of HBx, Catalase and MnSOD levels between liver tumors and their surrounding non-tumor tissues. (*p<0.05, **p<0.01, ***p<0.005; Wilcoxon’s signed-rank test ).
19
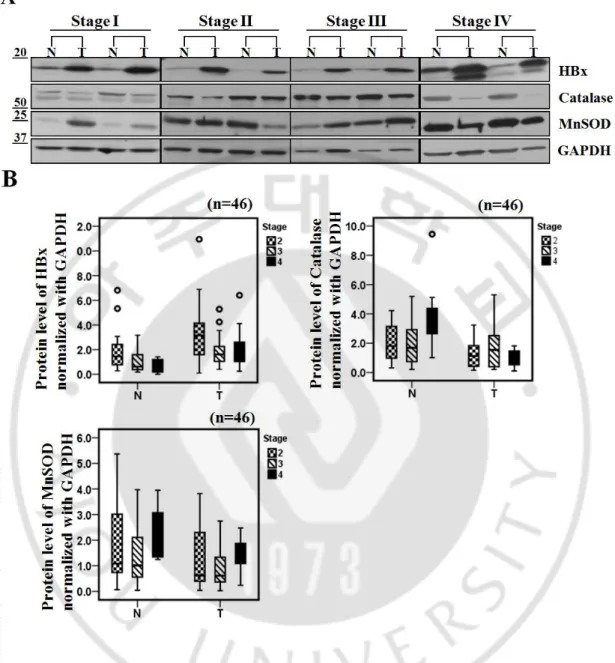
Fig. 8. Catalase expression level is significantly lower in HBV-related advanced HCC. (A)
Representative images of Western blotting showing HBx, catalase and MnSOD levels in different cancer stages. (B) Densitometric analysis of HBx, Catalase or MnSOD protein level in surrounding non-tumor and tumor tissues for each cancer stages by Western blotting.
20
cancer stage. In contrast, catalase protein levels were all reduced in tumors. Intriguingly, we have noticed that catalase levels in non-tumor tissues of the stage IV were increased (Figure 8B). In contrast, decrease in catalase level in tumor tissue was especially marked in the stage IV specimens. These findings may suggest that surrounding normal liver tissues at the stage IV cope with the chronic oxidative stresses by elevating catalase levels whereas tumor cells in that stage lose the ability responding to chronic oxidative stresses.
9. HBx protein levels are negatively correlated with catalase expression in HBV-related advanced HCC.
We attempted to analyze these correlations further and calculated the tumor/non-tumor tissue (T/N) ratios of HBx, catalase and MnSOD expression levels for each individual sample by tumor stages. Then, we applied a statistical analysis to establish the correlation between HBx and catalase using their T/N expression ratios. Interestingly, this analysis showed a negative correlation between the T/N ratios for HBx and catalase only in stage IV (r = -0.47, p=0.008; Wilcoxon’s signed-rank test) (Figure 9A). And a Spearman correlation analysis also showed a strongly negative correlation between HBx and catalase T/N expression ratios in stage IV (Spearman correlation coefficient =-0.683, p=0.042) (Figure 9B). However, we did not observe any correlation between HBx and MnSOD T/N expression ratios in stage IV. Importantly, a Kaplan-Meier analysis showed that the prognosis of HCC patients with lower catalase expression (n=29) was poorer than those with higher catalase expression (n=15) (p=0.023, Figure 9C; left panel). In particular, low catalase expression was significantly associated with shorter overall survival in stage IV HCC patients (p=0.023, Figure 9C; right panel). A Kaplan-Meier analysis of HBx expression showed a trend toward shorter survival in HCC patients with higher HBx expression (n=16) than in those with lower HBx expression (n=28), but this difference did not reach statistically significance.
22
Fig. 9. HBx protein levels are negatively correlated with catalase expression in HBV-related advanced HCC. (A) A correlation between HBx tumor/non-tumor (T/N) expression
ratio and catalase T/N expression ratio in stage IV was examined by scatter plotting in 9 cases of HBV-related HCC patients (r = -0.47, p=0.008; Wilcoxon’s signed-rank test). (B) We evaluated a correlation of HBx and catalase using Spearman’s rho correlation analysis (p=0.042, coefficient = -0.683). (C) The cumulative overall survival rates of HCC patients by catalase expression level based on Western blotting, was analyzed by a Kaplan-Meier curve. p values were determined by the log-rank test.
23
10. HBx protein levels have no correlation with MnSOD expression in HBV-related advanced HCC.
MnSOD expression was not correlated with HBx expression and was not associated with patient survival (Fig. 10A, B). Together, the T/N ratio of catalase expression in each individual may at least partly reflect its oxidative stress condition. In addition, the T/N ratio of catalase expression in each individual can be used as a better prognostic marker than general catalase expression.
11. Prognostic significance of catalase expression in HBV-related advanced HCC.
Next we evaluated further a connection between catalase and the clinical features of HCC using in depth statistical analyses. A Univariate Cox regression analysis showed that tumor size, venous invasion, tumor differentiation (Edmondson grade), tumor recurrence, and catalase expression were associated with overall survival (p<0.1; Table 1). A multivariate Cox proportional hazard regression analysis revealed that tumor differentiation (p=0.044) and catalase expression (p=0.035) were independent prognostic factors for the overall survival of HCC patients (Table 2).
Finally, to determine whether catalase or HBx or MnSOD expression has clinical significance, we analyzed the correlation between their expression and clinicopathological characteristics. In our cohort, we found no significant correlation between catalase expression and other clinicopathological features (Table 3) as well as HBx or MnSOD expression was not related to clinicopathological features (Table 4, 5). These results imply that the predictive power of catalase is superior to clinicopathological features with respect to overall survival in HCC patients.
24
Fig. 10. HBx protein levels have no correlation with MnSOD expression in HBV-related advanced HCC. (A) No correlation between HBx tumor/non-tumor (T/N) expression ratio
and MnSOD T/N expression ratio in stage IV was examined by scatter plotting in 9 cases of HBV-related HCC patients (r = -0.086) (B) The cumulative overall survival rates of HCC patients by MnSOD expression level based on Western blotting, was analyzed by a Kaplan-Meier curve. p values were not determined by the log-rank test.
30
D. Discussion
For patients with HCC, the prognosis is generally poor and the effectiveness of available remedies is limited. Oxidative stress and associated DNA damage is one of the critical factors involved in the progression of liver cancer (Nair et al., 2010). HBV-induced oxidative stress stimulates translocation of the mitogen-activated protein kinase (MAPK) Raf-1 to mitochondria, resulting in phosphorylation of the Raf-1 activation domain. Recently, sorafenib, a multi-kinase inhibitor, was established as the standard of care for patients with advanced HCC for whom loco-regional treatment is not an option (Llovet et al., 2008). Raf-1 is the key mediator of in the signaling pathway targeted by sorafenib treatment. In addition, our findings here provide a rationale for antioxidant therapeutic approaches in HBV-related HCCs, especially in advanced stages.
We identified catalase as a cellular regulator that effectively reduces the stability of HBx. This is important because HBx cellular levels in liver cells are directly linked to its ability to activate target genes and to stimulate HBV replication and tumorigenic potential (Zhang et al., 2012). Thus reducing HBx levels could be an important strategy for the prevention and treatment of liver diseases in HBV-infected patients. To date, several regulators of HBx protein stability have been reported. PIN1 has been shown to increase HBx stability (Pang et al., 2007). In support of this, we found a strong positive correlation between HBx and PIN1 in HCC tissues (Figure 7A). The current study adds catalase to the list of known HBx modulators, showing that catalase effectively accelerates the degradation of HBx protein (Figure 1). Since chronic HBV infection increases oxidative stress in the liver, it is possible that HBx is accumulated under chronic inflammation conditions due to increased ROS levels. Thus, catalase not only alleviates oxidative stress but also reduces HBx protein levels. Accordingly, we propose that catalase would be more effective than other modulators under chronic oxidative stress conditions.
The effect of catalase on HBx stability involves Cys residues of the HBx protein (Figure 3). The Cys--HBx mutant exclusively formed monomers and showed very little intracellular accumulation. Although the C26/115-HBx mutant mainly formed an oligomer (Figure 4A), its expression levels were very low. In contrast, the C69 mutant protein was readily accumulated,
31
indicating that preservation of the cysteine at residue 69 is important for HBx stability. Notably, C69 lies within the Kunitz domain, which inhibits the function of serine proteases (Ranasinghe and McManus, 2013).Since the Kunitz domain is a disulfide-rich structure of a- and b-fold, the disulfide bond at cysteine 69 in HBx may be important for protecting HBx from protease degradation.
We further postulated that catalase expression in HCC patients could be clinically useful for the prediction of patient survival (Figure 8, 9). Here, we used each patient’s own non-tumor tissue (N) as a control for catalase expression in non-tumor (T), calculating a T/N ratio of catalase expression for each patient. We showed for the first time that patients with a relatively high T/N ratio of catalase expression (>0.8) exhibited significantly higher survival than those with low T/N ratios (Figure 9C, Table 3). Thus, the reduction of oxidative stress in tumors by catalase could be crucial for patient survival. This interpretation is supported by others showing that treatment with catalase derivatives significantly reduced the number of metastatic colonies on the surface of the liver (Nishikawa et al., 2004). In addition, high levels of ROS and low levels of catalase have been shown to increase tumor progression (Gupta et al., 2001), suggesting that catalase functions as a tumor suppressor. Thus, low catalase expression in tumors compared to non-tumor tissues could serve as a valuable predictor of poor survival of patients with advanced HCC, and enhancement of catalase expression in tumors could be a useful therapeutic strategy for the treatment of HCC. Interestingly, the level of MnSOD, another potent antioxidant molecule that also suppressed HBx accumulation in cells (Figure 1), was not significantly correlated with patient survival (Table 5). One of the challenges in the treatment of HCC is the lack of prognostic indicators for patient outcome in advanced cases of HCC. In this study, a low catalase expression level was associated with reduced patient survival, especially in advanced stage IV HCC patients. Furthermore, multivariate analyses showed that catalase expression is an independent factor for patient survival. Considering that the value of prognostic factors in HCC may vary at different disease stages, these results suggest that catalase expression is a potential independent prognostic indicator of overall survival in patients with highly advanced HCC. In the future, additional work is required to clarify the role of oxidative stress in the molecular pathogenesis of advanced HCC and its response to targeted therapy.
32
II. HBxAP/RSF1 as a chromatin remodeller and
HBx-associated protein
33
A. INTRODUCTION
Chromatin remodeling complexes are key players in the regulation of chromatin structure and nuclear biological processes in eukaryotic cells. There are four major types of chromatin remodeling complex in mammalian cells including the CHD, INO80, SWI/SNF and ISWI families. All of these complex use ATP as an energy source to regulate chromatin remodeling, transcription, DNA replication and repair sharing similar ATPase subunit known as SNF2 superfamily (Erdel and Rippe, 2011). The ISWI family in humans can be further divided into multiple subtypes, the NURF, CHRAC, ACF, WICH, NoRC, CERF and RSF complexes (Clapier and Cairns, 2009).
In 1998, a research group led by Reinberg D reported that RSF harbored ATP-dependent nucleosome-remodeling and spacing activities (LeRoy et al., 1998). Following this report, several functional aspects of RSF1 have been suggested. For example, RSF1 can act as a histone chaperone and HBxAP/RSF1 increases HBV transcription in a pX-dependent manner (Shamay et al., 2002). In addition, RSF1 is a transcriptional repressor, and reconstitutes and spaces CENP-A nucleosomes in vitro (Perpelescu et al., 2009). Recently, it has been reported that RSF1 is essential for PLK1 deposition and function at mitotic kinetochores (Lee et al., 2015). It has also been shown that ATM-dependent chromatin remodeler RSF1 facilitates DNA damage checkpoints and homologous recombination repair (Min et al., 2014). Additionally, RSF1 is expected to be correlated with heterochromatin. It is reasoned that the depletion of RSFl shows the similar phenotype like as those of HP1α (Heterochromatin Protein 1α) and HP1α is identified as a binding partner of RSF1 using mass spectrophotometry (data not shown). Overall, RSF1 is likely to function with HP1α, regulating centromere cohesions in mitosis. However, the role of RSF1 as a chromatin remodeler in regards to the regulation of chromatin structure, nucleosome dynamics and histone modifications has not previously been explored in detail.
HP1α is a major component of heterochromatin and plays a critical role in heterochromatin formation and mitotic progression. It consists of a chromodomain (CD), chromoshadow domain (CSD) and a Hinge region (H). CD recognizes histone H3K9me3, while CSD is responsible for binding to its cognate binding protein containing the PxVxL
34
motif. HP1α associates with chromatin during interphase and dissociates from the chromosome arms in mitosis. Thus, many studies have reported that the depletion of HP1α caused defects in mitotic centromere cohesion and the failure of cell-cycle progression. In this context, Watanabe group reported that the recruitment of shugoshin is the important primary role for centromeric heterochromatin in ensuring eukaryotic chromosome segregation (Yamagishi et al., 2008). When HP1α is accumulated at centromere in prometaphase, shugoshin1 and PP2A complex also are recruited at centromere and protect cohesin complex to suppress cohesion resolution (Fig. 11A).
So far, it was considered that H3K9me2/3 and H3K27me2/3 marks function distinctively. However, recent studies demonstrated the co-existence of these repressive marks at various genome loci and suggested the cooperative mechanisms between these methylation modifications in gene silencing. Especially, cooperation was proposed to be mediated either by the combined impact of H3K9me2 and H3K27me3 marks on the recruitment of chromodomain-containing protein or via direct interaction between H3K9 and H3K27 histone methyltransferases (Escamilla-Del-Arenal et al., 2013; Mozzetta et al., 2014). In addition, Decottignies group reported that proximity of the H3K27me3 mark increases the binding of HP1α to H3K9me3 and that it was dependent on the PRC2 complex (Fig. 11B) (Boros et al., 2014). However, it was unclear whether PRC2 directly interacts with HP1α or if it is mediated via another factor. Although HP1α is a well-known key player in mitotic cohesion and gene silencing, the detailed mechanism responsible for the accumulation in mitotic centromere and relationships with another chromatin factors remains unknown. In this study, we sought to investigate this mechanism in relation to RSF1.
35
Fig. 11. A schematic models. (A) A schematic model illustrating how HP1 protects
centromeric cohesion (Yamagishi et al., 2008). (B) The cooperation model between H3K27me3 and H3K9me3 (Boros et al., 2014).
36
B. MATERIALS AND METHODS
1. Cell cultures and antibody
HEK293T cells and HeLa cells were cultured in Dulbecco’s modified Eagle’s medium (Gibco BRL Grand Island, NY) supplemented with 10% fetal bovine serum and maintained in 5% CO2 at 37℃.
The following commercially available antibodies were used: RSF1 (Abcam), SUV39H1 (Santa Crutz), histone H3 (Abcam), H3K9me3 (Abcam), H3K27me3 (Abcam), V5 (Abcam), EZH2 (Abcam), HP1α (Cell signaling), Flag (Sigma) and RNF220 (Santa Crutz).
2. Plasmid
MARC (Methylation Activity Reporter at Centromere) construct was a gift from Xuebiao Yao (Lingluo et al., 2012). To localize the MARC at centromere, the CENP-B fused to CFP domain. And to check the changes in methylation of H3K9, H3K9 peptide with YFP is incorporated to CENP-B fused CFP.
3. Chromosome spreading and Giemsa staining
HeLa cells were seeded and cultured overnight at 37℃. HeLa cells treated with 0.1 ug/ml nocodazole for 4hrs, at 37℃. Accumulated mitotic cells were harvested and washed with PBS for several times. The mitotic cells were suspended in 0.075 M KCl and incubated at 37℃, 20 min. To fix the cells, 2 ml of fixation solution (MeOH:Acetic acid=3:1) was added. And then, the fixed cells were dropped onto the slide and dried in chemical hood overnight. Next day, we did antigen retrieval with Tris/EDTA buffer containing 0.05% tween 20 (pH9.0) for 7-8 hrs at 65℃. After several washing, the cells were stained with DAPI. Giemsa staining procedure was same steps to fixed slide and dried in 65℃ oven. Next day, the fixed cells were stained with Giemsa solution for 30 min and washed with tap water.
37
4. Fluorescence Resonance Energy Transfer (FRET) assay
HeLa cells expressing MARC (Methylation Activity Reporter at Centromere) were treated with 0.1 ug/ml nocodazole for 4 hrs, 37℃. Then, the cells were washed with PBS several times. For live imaging of methylation sensor, CFP was exited at 470 mM, and CFP and YFP emissions were acquired simultaneously with a beam splitter. The YFP/CFP emission ratio was calculated at each centromere.
5. Modified histone peptide array.
Modified Histone Peptide Array is purchased from Active Motif Co. Each array contains 384 different histone modification combinations in duplicate for acetylation, methylation, phosphorylation and citrullination modifications on the N-terminal tails of histones H2A, H2B, H3 and H4. One array was blocked with 5% non-fat milk solution for 1h, at RT and washed with TBST buffers several times. And then the array was incubated with RSF1 protein for overnight, at 4℃. After washing with TBST buffers, Primary antibody and secondary antibody were bound to the array in order and detected with ECL solutions.
6. Purification of RSF1
293T floating cells were transfected with 10ug of RSF1-V5 DNA. To check the secretion of RSF1, we harvested the supernatant every day. On 5th day, we assured the RSF1 protein in the supernatant and concentrated with a 100 kD cut-off concentrator to 10 folds.
7. Protein microchip array
The protein microarray chip was spotted with 16,368 unique, full-length human recombinant proteins in duplicate along with several control proteins such as IgG, GST, BSA-biotin, and histones. The protein chip was equilibrated with HEN buffer (250 mM Hepes,
38
1 mM EDTA, 0.1 mM Neocuproine, 0.5% Nonidet P-40) for 30 min. S-nitrosylated proteins were treated with 100 uM GSH or GSNO for 1h on a shaking platform at 60 rpm. Chips were washed 3 times with HEN buffer for 10 min, and incubated with 20 mM methyl methane-thiosulfonate (MMTS, 50 rpm, 50℃ for 1 h) and excess MMTS was removed 5 times with HEN buffer for 10 min. The protein chips were incubated with 50 mM ascorbate and 0.4 mM N-(6-(biotinamido)hexyl)-3’-(2’-pyridyldithio)-propionamide for 12 hrs at RT. To remove ascorbate and biotin-HPDP, protein chips were washed 5 times with HEN buffer for 10 min. Monoclonal anti-biotin in 5% dry milk was applied for 2 hrs at art and washed 3 times with PBST for 10 min. The anti-mouse Alex-fluor 647 in 5% dry milk was applied for 1 h and washed 3 times with PBST for 10 min at RT. Protein chips were dried via centrifugation at 200 g for 2 min using a 50 ml conical tube. The protein chips were scanned for quantification and statistical analysis.
39
C. RESULTS
1. RSF1 is overexpressed in HBV-induced advanced HCC.
HBxAP/RSF1 is known to be overexpressed in number of cancer types including ovarian, prostate, and colon cancers (Shih Ie et al., 2005; Choi et al., 2009; Liu et al., 2012; Li et al., 2014; Xie et al., 2014). It has been reported that RSF1 increases the malignancy of cancer cells and induces genomic instability. Recent studies have explored the utility of RSF1 overexpression as a prognostic marker in human hepatocellular carcinomas (Xie et al., 2014). As RSF1 expression levels have not previously been investigated in HBV-related hepatocellular carcinomas, we analyzed 10 patient samples with HBV-related hepatocellular carcinomas. In stage II to stage IV patients, RSF1 was found to be overexpressed in liver tumor tissue when compared to the surrounding non-tumor tissue, in association with HBx protein overexpression (Fig. 12A). These results confirm that RSF1 is amplified together with HBx in HBV-related hepatocellular carcinomas.
We next investigated the interaction between HBx and RSF1. In Huh7 liver cells, endogenous RSF1 co-immunoprecipitated with flag-tagged HBx, suggesting their physical interaction (Fig. 12B). It is postulated that HBx and RSF1 work in concert to activate cell proliferation and transform the HBV-related hepatocellular carcinomas toward a higher state of malignancy.
2. RSF1 depletion induces premature separation of sister chromatids.
RSF1 is known to be a chromatin remodeling factor but its full physiological role remains elusive. To investigate when RSF1 intracellular function is needed, we analyzed the protein expression profile in relation to cell cycle using double thymidine block. RSF1 protein expression levels were observed to increase during S and M phases, suggesting the involvement of RSF1 during these phases (Fig. 13A). Recently, our group previously has reported that RSF1 tightly associates with centromere proteins and recruits PLK1 to kinetochores to play an essential role in faithful cell division(Lee et al., 2015). And mitotic
40
Fig. 12. RSF1 is overexpressed in HBV-related hepatocellular carcinomas. (A)
Representative images of RSF1 and HBx expression levels in 10 paired HCC samples (T) and surrounding non-tumor liver tissues (N) (B) RSF1 co-immunoprecitated with overexpressed flag-tagged HBx in Huh7 liver cell lysates.
42
Fig. 13. RSF1 is important for mitotic centromere cohesion. (A) To assess the protein
expression profile of RSF1, HeLa cells were synchronized with double thymidine block. After release from double thymidine, HeLa cells were harvested from 0 hr to 12 hrs. RSF1 protein expression levels were increased during S phase and mitosis. (B) When HeLa S3 or RSF1-depleted HeLa S3 cells were stained with Giemsa, severe mitotic chromosome cohesion defects were observed in RSF1-depleted HeLa S3 cells. (C) When HeLa S3 or RSF1-depleted HeLa S3 cells were stained with DAPI and ACA using chromosome spreading analysis, the distances between ACA on chromatids were observed to be further apart in the absence of RSF1, confirming the presence of mitotic centromere cohesion defects.
43
RSF1-depleted HeLa S3 cells were stained with Giemsa, severe chromosome cohesion defects were observed at the centromeres compared to wild-type HeLa S3 cells (Fig. 13B). In addition, when mitotic HeLa S3 cells were stained with DAPI using chromosome spreading method, mitotic centromere cohesion defects were confirmed again in the absence of RSF1 (Fig. 13C). These findings suggest that the expression level of RSF1 is enhanced at S and M phases and RSF1 is essential for mitotic chromosome cohesion.
3. The centromeric expression level of H3K9me3 is downregulated at metaphase in RSF1 knock-dwon cells.
In the previous section, we demonstrated that mitotic chromosome cohesion defects were induced by depletion of RSF1. In the context of this phenomena, it is well known that heterochromatin protein HP1α is also important for sister-chromatid cohesion and mitotic progression (Nonaka et al., 2002; Inoue et al., 2008; Nozawa et al., 2010). To investigate whether mitotic chromosome cohesion defects caused by RSF1 depletion arise from HP1α, we analyzed the methylation status of histone H3K9 in terms of HP1α binding sites in the centromere using fluorescence resonance energy transfer (FRET)-based sensors that report quantitative changes in methylation in living cells. FRET-based sensors use the MARC (Methylation Activity Reporter at Centromere) construct that targets centromeres via its CENP-B fusion construct (Fig. 14A). Together with chromodomains from HP1, this sensor responds to enzymatic methylation at H3K9 quantitatively with an associated YFP/CFP emission ratio. The changes in intra-molecular FRET between cyan and yellow fluorescence depend on changes in methylation of a SUV39H1 substrate peptide such as H3K9. When this MARC construct was transfected into HeLa cells, the YFP/CFP emission ratio increased by approximately 30% from prometaphase to metaphase. However, in shRSF1 HeLa cells, there were few changes (Fig. 14B, C). From these results, we assumed that RSF1 can regulate the localization of HP1α by influencing the methylation status of H3K9 in mitotic centromeres.
45
Fig. 14. The centromeric expression level of H3K9me3 is not increased at metaphase in RSF1 knock-down cells. (A) Schematic representation of the domain structure of MARC. (B)
HeLa cells and shRSF1 HeLa cells expressing MARC were imaged in prometaphase and metaphase. (C) Statistical analysis of MARC activity as a YFP/CFP ratio derived from experiments shown in (B).
46
4. RSF1 depletion enhances the expression levels of H3K9me3 and H3K27me3 in mitosis.
HP1α, a major component of heterochromatin, associates with chromatin during interphase, and mostly HP1α dissociates from the chromosome arms during mitosis (Le Douarin et al., 1996; Brasher et al., 2000). In this context, it was reported that human POGZ binds to HP1α through its unique zinc-finger-like motif (HPZ) and modulates dissociation of HP1α from the mitotic chromosome arms through Aurora B-mediated phosphorylation of H3S10 (Nozawa et al., 2010). It has been widely reported that H3K9me2/3 ensures chromatin anchorage for HP1. Recently, several studies have presented another hypothesis that H3K9 methylation and H3K27 methylation coexist and both contribute to the maintenance of gene silencing (Vermeulen et al., 2010; Boros et al., 2014). In addition, the phosphorylation of serine residues at histone H3 occurs as a dynamic modification in mitosis that works in concert with acetylation and methylation marks at neighboring lysine residues in specific combinational patterns. The phosphorylation sites at H3S10, H3S28 harbor the identical motif –ARKS- (Sawicka and Seiser, 2012) (Fig. 15A). We analyzed the methylation status of H3K9 and H3K27 during mitosis using chromatin-bound fractionation. As shown in Figure 14B, the HP1α expression appears not to change in the mitotic shRSF1 HeLa cells. However, SUV39H1 histone methyltransferase and its substrate H3K9 methylation were increased. In addition, another methyltransferase, EZH2 and its substrate H3K27 methylation were increased in the shRSF1 HeLa cells. From these results, we hypothesize that RSF1 recognizes and regulates the methylation levels of H3K9 and H3K27 to maintain the association between HP1α and heterochromatin in mitosis.
5. RSF1 dissociates from histone peptides with phosphorylated H3S28 modification.
It remains unknown how RSF1 binds to chromatin and what kinds of histone modifications associated with RSF1 interactions. We screened histone modifications for interactions with RSF1 using a modified histone peptide array. As a control, we used purified GST-tagged HP1α protein. In Figure 16A (left panel), we confirmed the purification of HP1α protein. As expected, HP1α strongly bound to methylated H3K9, as shown in Figure 16A (right panel). We then sought to identify the modified histone peptide with
47
Fig. 15. The levels of H3K9me3 and H3K27me3 are increased in mitotic shRSF1 cells. (A)
Schematic representation of the –ARKS- motif at H3 K9-S10 and H3 K27-S28 sites (Sawicka and Seiser, 2012). (B) HeLa and shRSF1 HeLa cells were treated with 0.1 ug/ml nocodazole for 12 hrs, and the chromatin bound fractions were analyzed by Western blotting with the specified antibodies. H3 and topoisomerase II α were used as loading controls for the chromatin fractions.
48
purified RSF1 protein from Sf9 insect cells. Unexpectedly, as shown in Figure 15B, RSF1 was found to a number of histone H3 peptides, and even with unmodified histone H3 pepides. This suggests that RSF1 lacks strong specificity for histone modification. Simultaneously, it was noted that RSF1 does not appear to bind to any kind of histone peptides with phosphorylated H3S28 modification (Fig. 16B). We hypothesize that if H3S28 is phosphorylated with Aurora B or MSK1/2, RSF1 can dissociate from chromatin like as the dissociation of POGZ at phohphorylated H3S10 by Aurora B.
6. RSF1 directly interacts with diverse targets.
As one of another approach to elucidate function of RSF1, we searched for binding partners using a protein chip array. RSF1 protein as a secreted form was produced from 293T floating cells. After the 293T floating cells were transfected with 10ug of RSF1 DNA, the expression level of RSF1 peaked on Day 5. The supernatants were harvested and concentrated with a 100 kD cut-off concentrator (Fig. 17A). A protein chip array was then incubated with the purified RSF1 protein. Among 17,000 binding candidates, approximately 30 molecules were found to directly bind to RSF1 (Fig. 17B). Of particular note, the serine/threonine protein kinase NEK2, a mitotic regulator that is important for cell cycle progression and chromatin condensation, was identified. This finding is in line with the role of RSF1 in mitosis and progression of the cell cycle. In addition, POLD3, RMI 1 and ORC3, which are involved in DNA replication and repair, as well as RBBP7 and histone H4 were found. These further support an important role for RSF1 in nuclear biological processes. Noticeably, GAD2, BCAN, PGCB, PSPH and HIP1 are associated with nervous system and neuronal disorder diseases including Williams syndrome and Huntington’s disease. It appears to be possible that RSF1 plays a role in the nervous system and neuronal genetic disorders. CARD8 and RELT as a regulator of NF-kB and G-protein related GBP2 and S1PR3 were identified. With regard to catalytic enzymes, Phosphatase PP2A and E3 ubiquitin ligase RNF220 were also found to bind with RSF1. Interestingly, RSF1 strongly interacts with histone H4. Taken together, these results suggest that RSF1 plays essential roles in multiple cellular processes via interactions with diverse binding partners.
49
Fig. 16. RSF1 dissociates from histone peptides with phosphorylated H3S28 modification.
(A) The image and graphical analysis of ECL detection of HP1α as a control for histone peptide array analysis. (B) The image and graphical analysis of ECL detection of RSF1. The red boxes indicate histone peptides with phosphorylated H3S28.
50
Fig. 17. Binding partners of RSF1. (A) RSF1 as a secreted form was purified from 293T
floating cells. (B) The image of Protein chip array (left panel) and binding partners of RSF1 (right panel).