09-R-006
대한설비공학회 2009 하계학술발표대회 논문집 pp. 1476 ~ 1483
판형 열교환기의 열전달과 유동특성에 대한 연구
김 진 화†, 이 광 성, 지 명 국, 정 한 식*, 정 효 민*경상대학교 대학원 정밀기계공학과, *경상대학교 정밀기계공학과 해양산업연구소
Study on Characteristics of Heat Transfer and Flow in
Plate Heat Exchanger
Zhen-Hua Jin†, Kwang-sung Lee, Myoung-Kuk Ji, Han-Shik Chung* and Hyo-Min Jeong*
Department of Mechanical and Precision Engineering, Gyeongsang National University, Korea *Department of Mechanical and Precision Engineering, Gyeongsang National University,
Institute of Marine Industry, Korea
ABSTRACT: In present work, experiments conducted to investigate the heat transfer characteristics and relationship between operating parameters and production of fresh water as output of the system. Plate Heat Exchanger (PHE) applied in vacuum evaporator for product fresh water that system intended to efficiently use low grade heat. PHE have become popular in chemical, power, food and refrigeration industries due to the efficient heat transfer performance, extremely compact design and flexibility of extend or modify to suit changed duty. The heat transfer part contains corrugated plates with 60 degree of chevron angle which verified by many researchers and commonly apply. Fresh water can be produced from saline water under near vacuum pressure by operating ejector. Consequently, evaporating temperature stay around 51-57 ℃ so it is possible to use any low grade heat source or renewable source. The maximum fresh water produced by freshwater generator with plat heat exchanger applied in the study was designed as 1.0 Ton/day.
Key words: fresh water generator, plate heat exchanger, heat transfer, pressure drop
†Corresponding author
Tel.: +82-55-646-47661; fax: +82-55-640-3188 E-mail address: [email protected]
Nomenclature
b mean channel gap [m] De equivalent diameter [m] Dp port diameter [m] f friction factor
G mass velocity[kg/m2·s]
h convective heat transfer coefficient [W/m2·℃] k thermal conductivity [W/m2·℃] n number of channel Re Reynolds number Superscript β chevron angle μ viscosity Subscript c channel 1. INTRODUCTION
In desalination system it is no doubt heat exchanger is extremely important as a key point. The importance of heat exchanger has increased immensely from the view point of energy conservation, conversion, recovery and
successful implementation of new energy
Nowadays PHE widely use in different
industries such as chemical, food and
pharmaceutical process and refrigeration. The
heat transfer occurred between adjacent
channels through plates. Alternate plates are
assembled such that the corrugations on
successive plates contact and cross each other to provide mechanical support to the plate pack through a large number of contact points. This resulting flow passages are go through a narrow, highly interrupted and tortuous so that
will enhance the heat transfer flow and
increasing the level of turbulence. At the same
time, pressure drop will be accompanied
inevitably. True flexibility is unique to the plate heat exchanger both in initial design and after installation. In the initial design the basic size, geometry, total number and arrangement of standard plates can easily be selected to precisely fit the specific duty. An existing
plate heat exchanger can very easily be
extended or modified to suit an increased or changed duty. Moreover, it is very compact
and low in weight in spite of their
compactness.(2-5)
Plate patterns have great influence on both of thermal and hydraulic performance, the final design is certainly depends on the initial choice of plate pattern. Although many types have been used in the past, the chevron type plate has proved to be the most successful model during last decades. A comprehensive step of design method was presented by Shah and
Focke.(6) The commonly used chevron angle
varies between 30°to 60°. This been verified by many researchers according to experimental results and simulations already. An analytical
study has been made by Martin(7) to predict
the performance of chevron type plate heat exchanger.
The main objective of this paper is
discussing main conception of plate heat
exchanger applied in vacuum evaporator for product fresh water. Especially focus on the
evaporating and condensing performance for product water. Besides, flow mal-distribution is common in reality that significantly reduces
the heat exchanger performance. Thus,
simulation conducted flow distribution in a PHE with 6 channels and used k-εstandard turbulence model.
2. Experimental Apparatus and Test Procedure
2.1 Experimental device
The concept of a fresh water generator is simple the sea water is evaporated using a heat source, separating pure water from salt,
sediment and other elements. Fresh water
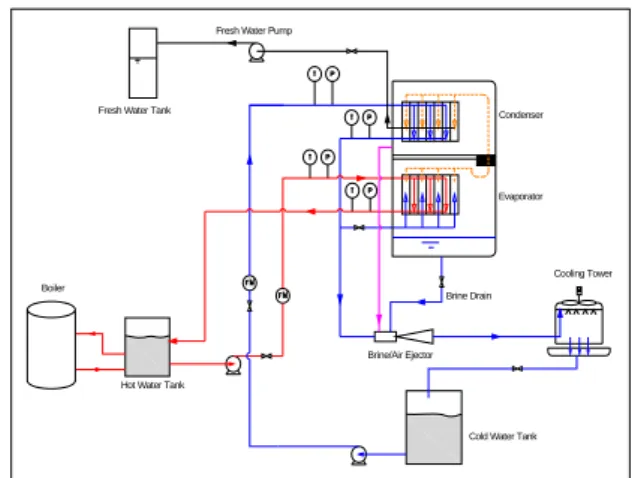
generators usually attempt to use existing heat to run it in order to reduce cost of operation. There are two main elements in a fresh water generator, one heat exchanger evaporates the sea water and another one condenses the fresh water vapour into liquid phase for usage. In the condenser element, the vapour is condensed by cold seawater. We built Schematic diagram of fresh water generator experimental device as Fig. 1.
Boiler
Fresh Water Pump
Cooling Tower
Cold Water Tank Evaporator Condenser
Hot Water Tank Fresh Water Tank
Brine Drain Brine/Air Ejector
Fig. 1 Schematic diagram of the facility of fresh water generator system. 2.2 Experimental method
The heat transfer part contains corrugated plates with 60 degree of chevron angle which
verified by many researchers and commonly apply. Moreover the plate package arranged with U type configuration. The air inside the evaporation chamber is evacuated to a near vacuum, hence the saturation point of water becomes lower much more. It then becomes
possible to evaporate the seawater at a
temperature around 60 ℃. The engine jacket cooling water is sufficiently hot to evaporate the water and it is commonly used. In present system saturation temperature located in the range of 51℃-57℃. The system may divide to main circuits. One is cold water circuit that cold fluid is supplied to the heat exchanger where it receives heat from the hot fluid
across the plates. Finally the cold water
delivered to cooling tower where temperature cool down and maintain at the inlet condition of heat exchanger. This experiment used city
water. Since it assumed that the water
temperature is constant. In the other hand, the hot fluid is flowing to the plate heat exchanger and fed back to hot water tank where is keep at a constant temperature using boiler.
The procedure of experiment firstly operate
cold fluid circuit to obtain near vacuum
condition in the tank which contains the heat exchanger. Further step is operating hot water circuit to supply hot water to heat transfer with the cold fluid between alternate plate channels of heat exchanger. It should be notice that there is bypass line connected from outlet of cooling water provide to evaporator. The pre heated cooling water supplied to absorb
heat from hot water so that can be
evaporating much more quickly and use the heat energy sufficiently. The temperature and pressure at inlet and outlet of fluids are recorded respectively till the steady state is reached. Same procedure has been repeated with different flow rate and supply temperature of hot fluid. Time (s) 0 1000 2000 3000 4000 5000 V a c uum pr e ssure (kP a ) 0 20 40 60 80 100
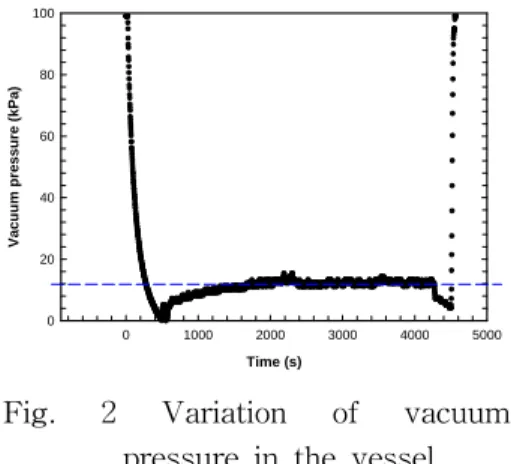
Fig. 2 Variation of vacuum
pressure in the vessel.
As mentioned above the vessel contains two unit of exchanger is maintained with vacuum condition while the system is operating. The pressure variation in the inside of vessel is show as Fig. 2. This is one of experimental results with operate system exactly operate ejector entrain the inside air so that pressure decrease rapidly within 10 minutes. At this condition flowing hot stream and cold stream to start to exchange heat. We can see inside pressure increase gradually since there are vapour occurred. However through some period
it maintain at steady state along 12kPa
vacuum pressure relatively. It showed sharp increasing at end of part this because stop ejector and it recovery to atmosphere condition.
In this way one circle of experiment is
complete.
3. Results and Discussion
According to above mentioned concept and procedure, the experiments conducted at the range of 60 ℃, 65 ℃ and 70 ℃ for the setting
temperature at hot fluid respectively.
Meanwhile the flow rate of fluid is set at
3.0m333/h and 3.5 m3/h.
First look at pressure drop that it is
calculated as approximately 1.5 times the inlet velocity head per pass. Since the entrance an exit losses in the core cannot be determined by experimentally, they are included in the
friction for the given plate geometry. Although the momentum effect is negligibly small for liquids, it is also included in the following expression. The pressure drop or rise caused by elevation of change for liquids. Summing all contributions, the pressure drop on one fluid side in a plate heat exchanger is given by
c m c i m e c i c p p g gL g G D g fLG g n G P ρ ρ ρ ρ ρ ⎟⎟⎠ ± ⎞ ⎜⎜ ⎝ ⎛ − + ⎟⎟ ⎠ ⎞ ⎜⎜ ⎝ ⎛ + = Δ 2 0 2 2 1 1 1 2 4 2 5 . 1 25 . 0 Re 8 . 0 − = f , μ e GD = Re , 2 ) 4 / /( p p m D G π ⋅ =
where Gpis the fluid mass velocity at the port
and
n
pis the number of passes in the givenfluid side,
D
eis the equivalent diameter of flowpassages namely twice of pressing depth(b),
o
ρ
andρ
iare fluid mass densities evaluated atlocal bulk temperature and mean pressure at outlet and inlet, respectively. The Reynolds number is based on hydraulic diameter of the
corrugated channel which is equivalent to
twice of pressing depth of the plate.
A considerable amount of research has been conducted to determine heat transfer and flow friction characteristics of chevron plate. Martin provides comprehensive correlations for friction factors and Nusselt numbers for this geometry. The correlations for the fanning friction factor is
(
)
1 2 / 1 0 3.8 cos 1 cos / sin 09 . 0 tan 045 . 0 cos 1 f f f β β β β β + − + + = Where ⎪⎩ ⎪ ⎨ ⎧ − = −2 0 ) 0 . 3 Re ln 56 . 1 ( Re 16 f , ⎪⎪⎩ ⎪⎪ ⎨ ⎧ + = 289 . 0 1 Re 75 . 9 9625 . 0 Re 25 . 149 fMartin also obtained the Nusselt number
correlations as follows, using the momentum and heat transfer analogy from a generalized
Leveque solution in thermal entrance turbulent flow in a circular pipe.
Temperature (oC) 31 32 33 34 35 36 37 P res su re d o rp (kP a ) 0 10 20 30 40 50 60 Calculation Experiment
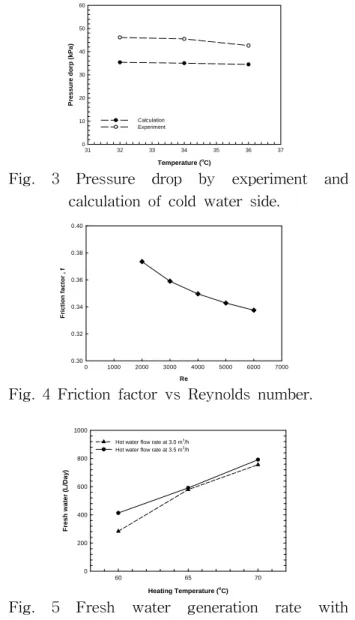
Fig. 3 Pressure drop by experiment and
calculation of cold water side.
Re 0 1000 2000 3000 4000 5000 6000 7000 F ri c ti on f act or , f 0.30 0.32 0.34 0.36 0.38 0.40
Fig. 4 Friction factor vs Reynolds number.
Heating Temperature (o C) 60 65 70 Fresh w a te r ( L /D ay ) 0 200 400 600 800 1000
Hot water flow rate at 3.0 m3/h
Hot water flow rate at 3.5 m3
/h
Fig. 5 Fresh water generation rate with
temperature and different flow rate. As the Reynolds number increases the heat transfer coefficient also increases, but friction factor decreases. Fig. 3 shows comparison of
pressure drop between experimental and
theoretical results based on the above
equations. It is observed that there is
difference for experimental results and
calculation method which according to equation suggested by R. K. Shah. The calculation results ignored the third term of right hand side of equation since it is difficult to measure exact the density at each point. Additionally, in
experiment friction loss through pipeline is the inevitable. Thus this may result into the gap compare to experimental results. The friction factor decrease with increasing of Re number as show in Fig. 4.
Fig. 5 shows the fresh water generation at each supply temperature of hot water and flow rate. The line depicts the effect of flow rate and supply temperature of hot water on the fresh produce. It is showed that compare two lines it clear that fresh water generation rate is increasing proportionately by increase of hot water supply temperature. With different flow rate affect to the fresh water quantity is less at 65 ℃ and 70℃. However, the difference of fresh water quantity is become large at 60 ℃ of hot water temperature case. The reason for the difference might be due to when the hot water temperature is lower, the cold water outlet temperature will lower too so that for evaporating the temperature gap is large than other case at high temperature, similarly there need much more amount of heat and time to accumulate then it can be evaporated. Since the supply temperature is lower relatively.
Hence, resulted into evaporating is not
happened sporadically at this condition.
Hot water temperature (oC)
58 60 62 64 66 68 70 72 Te mp er atu re ( oC) 0 20 40 60 80 100 120 Th in Th out Tc in Tc out T vapor T fresh water
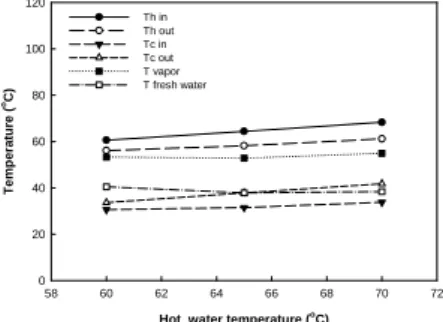
Fig. 6 Temperature variations
with flow rate of 3.5m3/h.
Hot water temperature (o
C) 58 60 62 64 66 68 70 72 Tem pe ratur e ( oC) 0 20 40 60 80 100 120 Th in Th out Tc in Tc out T vapor T fresh water
Fig. 7 Temperature variations
with flow rate of 3.0m3/h.
Fig. 6 and Fig. 7 show the temperature distribution with flow rate of hot water at 3.0m3/h and 3.5m3/h. It shows temperature is increasing gradually with increase of hot water
supply temperature. It is observed the
temperature of fresh water is higher in case of 60℃ than other because the generation rate is smaller than other case.
4. Numerical Analysis
A large number of optimization techniques are available from literature and quite a lot of
commercial optimization software. CFD can
provide another method approach to modeling and investigate performances. Moreover, there are a number of papers trying to approach other way namely numerical simulation like
described in the articles.(8-10)
The numerical simulation solved the flowing continuity equation, momentum equation and
energy equations use commercial software
Fluent 6.3.26. In this paper, a CFD model taken
to simulate flow distribution in the plate
channel. The dimension of plate model in length of 400 and width of 100mm, equivalent diameter is 7mm and the port diameter is 24mm. The fluid domains were modelled with properties of water. The simulation was solved use k-ε turbulence model.
Simulation model is corrugated one plate and 6 channel model with only plat shape as
corrugated model conduct 5 case which the Reynolds number increasing from 2000 to 6000.
Fig. 9 shows pressure drop according to
increasing of Reynolds number.
Fig. 8 Corrugate plate and flat multi channel model. Re 0 1000 2000 3000 4000 5000 6000 7000 P re ssur e dr op ( Pin -P oou t )/ Pin 0.0 0.2 0.4 0.6 0.8
Fig. 9 Pressure drop according to Reynolds number. y / Y 0.0 0.2 0.4 0.6 0.8 1.0 Ve lo c tiy (m/ s ) 0.0 0.2 0.4 0.6 0.8 1.0 1.2 1.4 1.6 1.8 2.0 1.25 m3/h 1.50 m3/h 1.75 m3/h
Fig. 10 Velocity distributions at the last channel in 6 channel unit. y / Y 0.0 0.2 0.4 0.6 0.8 1.0 P ressu re(kP a ) 100.0 100.5 101.0 101.5 102.0 1.25 m3/h 1.50 m3/h 1.75 m3/h
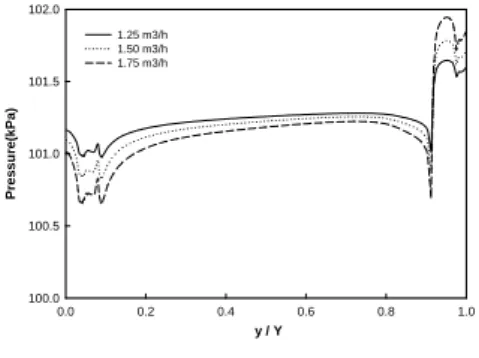
Fig.11 Pressure distributions at
the last channel in 6 channel unit. From Fig. 10 and Fig. 11 we can find more
detailed variation of velocity and pressure
along y direction cross port and plate channel. The y axis distance means location from bottom of channel. This data represent the
cross port section along y direction. The
simulation results indicate that pressure and velocity varied sharply around port due to changing of flow area. However at other area the distribution of pressure and velocity is near uniform. y / Y 0.0 0.2 0.4 0.6 0.8 1.0 Te mp er atu re (K) 310 315 320 325 330 335 1.25 m3/h 1.50 m3/h 1.75 m3/h
Fig. 12 Temperature distributions at the last channel.
Channel number 1 2 3 4 5 6 Tem p er at ur e ( K ) 310 312 314 316 318 320 322 324 326 328 330 1.25 m3/h 1.50 m3/h 1.75 m3/h
Fig.13 Temperature distributions located in different channel.
Fig. 12 shows the variation of temperature in the last channel. There is less influence by flow rate on the temperature distribution in this channel. However, Fig. 13 shows a little
difference of temperature when the flow
approach to end of channels the influence is
increasing. Moreover, we can see the
temperature distribution within 6 channels that there happens maldistribution as estimated. In
the first channel bottom area temperature
appears lower than other area. Since less
amount of fluid flowing to this channel
relatively compare to other channel. Therefore it considered if the channel made in various deferent depth size for heat transfer more sufficiently. This work will be continued in further research.
5. Conclusion
In the present work, we discussed about fresh water generator system which used plate heat exchanger to evaporate and condense with
vacuum conditions. Experiments have been
carried out on the fresh water generating according to the supply temperature and flow rate of heating medium and show the influence on the performance of product fresh water as outcome of the system.
The experiment show that with higher hot water supply temperature can produce more quantity of fresh water. The flow rate of hot water supply temperature affect less to the produce of fresh water in the range of high temperature. However, it can achieve more amount of fresh water at lower flow rate. Because at lower flow rate heat transfer
sufficiently between hot medium and cold
medium through adjacent plates. The
simulation results indicate that pressure and velocity varied sharply around port due to
changing of flow area. It observed that
pressure drop significant with increasing of Reynolds number. In the 6 channel model the
flow rate is less effect on temperature but approach to end of channel the influence is increasing.
ACKNOWLEDGEMENT
This research was financially supported by
Regional Industrial Common Technology
Development from Ministry of Knowledge
Economy. The Authors would like to thank the Human Resource Training Project for Regional Innovation from the Ministry of Education,
Science Technology (MEST) and Korea
Industrial Technology Foundation(KOTEF) and Brain Korea 21 Project.
REFERENCES
1. Khawaji, A. D., Kutubkhanah, I. K. and Wie,
J. M., 2008, Advances in seawater
desalination technologies, Desalination, Vol. 221. pp. 47-69.
2. Zahid, H. A., 2003, Plate heat exchanger literature survey and new heat transfer and pressure drop correlations for refrigerant evaporators, Heat Transfer Engineering. Vol. 24, No. 5, pp. 3-16.
3. Bobbili, P. R., Sunden, B.and Das, S. K.,, 2006, An experimental investigation of the port flow maldistributon in small and large
plate package heat exchangers, Applied
Thermal Engineering,Vol. 26, pp. 1919-1926. 4. Srihari, N.and Das, S. K., 2006, Transient
response of multi-pass plate heat
exchangers considering the effect of flow maldistribution, Chemical Engineering and Processing, Vol. 47. pp.695-707.
5. Rao, B. P., Kumar, P. K. and Das, S. K, 2002. Effect of flow distribution to the channels on the thermal performance of a plate heat exchanger, Chemical Engineering and Processing, Vol. 41, pp.49-58.
6. Shah, R. K. and Focke, W. W., 2003, Plate heat exchanger and their design theory in
heat transfer equipment design, Hemisphere, Washington, USA.
7. Martin, H., 1996, A theoretical approach to predict the performance of chevron-type plate heat exchangers, Chemical Engineering and Processing, Vo.l 35, pp. 301-310.
8. Fernandes, C. S., Dias, R. P., Nobrega, J. M.and Maia, J. M., 2007, Laminar flow in chevron type plate heat exchangers: CFD
analysis of tortusity, shape factor and
friction factor, Chemical Engineering and Processing, Vol .46, pp. 825-833.
9. Zhang, G. M.,Tian, M. C. and Zhou, S. J.,
2006, Simulation and analysis of flow
pattern in cross-corrugated plate heat
exchanger. Journal of Hydrodynamics. Vol. 18. No. 5, pp. 547-551.
10. Noh, S. J., 2004, Numerical study of heat transfer and pressure drop in chevron type plate heat exchanger. Thesis. pp. 8-49.