1. Introduction
Natural water bodies played an important role in the balance of ecological environment, so the treatment of black and odorous water had become one of the key points of environmental governance[1-2]. In line with the principle of “regulating pollution first”, identifying river pollutants and pollution sources was the premise of river regulation. The commonly used pollution source analysis method was to use the receptor model to carry out principal component analysis on water quality indicators[3-4], and then combined the field investigation to determine the pollution source type for pollution load calculation, and obtained the main pollution source[5].
To protect to Chao lake ecology was the hot topic in China[6-9].This study was the analysis of point source pollution load in the small watershed of DongPieHong Ditch, Chao Lake.
The water quality monitoring number used SPSS principal component analysis to identify the main pollution sources[10], combined with hydrology, topography, drainage network and the runoff coefficient to calculate surface runoff[11-12], agricultural non-point source[13], the source of town pollution load , analyzed the structural characteristics of the pollution
source[14], and provided the basis for the design of the treatment plan.
2.Materials and Methods 2.1 Study Area
DongPieHong Ditch(117°52'58.57′′~117°5 3′01.11′′E, 31°37′04.81′′~31°35′02.8 0′′N) has a total length of 2.7 km and a drainage area of 1.21 km2. The bottom elevation is 6.47-8.96 m, and the bottom of the river is 5-8 m wide.
2.2 Sample Collection
2.2.1 River water sample sampling
Five sampling sections (Fig. 1) were set up from upstream to downstream of the river.
Water samples were collected by water sampler and returned to the laboratory for COD, NH3-N and TP concentrations.
* School of Biology, Food and Environment, Hefei University, Hefei 230601, China.
** School of Biology, Food and Environment, Hefei University, Hefei 230601, China. Correspondent Author
Analysis of non-point and point source pollution load in DongPieHong Ditch
Yu Shan*·Jun Chen*·Jie Jin*·YongLian Song*·Jun Liu*·DongBiao Wu*·Ke Wu**
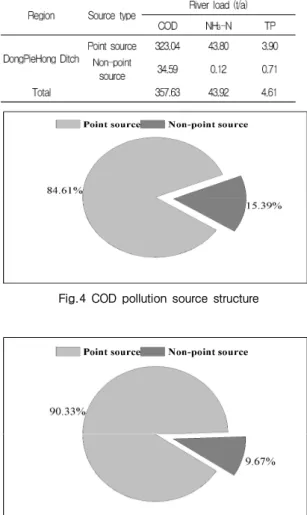
Abstract: In this study, the DongPieHong Ditch were taken as the research object, five sampling points were set to measure the COD, NH3-N,TNandTPindexes. The correlation and principal component analysis were used to judge the main pollution sources and calculate pollution contribution rate. According to the population in the basin, the load of point source pollution into the river was estimated. As a result, the load of COD, NH3-N and TP into the river was 323.04t/a, 43.8t/a and 3.9t/a, respectively. According to the statistics of the rainfall in the basin, the concentrations of COD, TP and NH3-N in the initial rainwater were measured and calculated for non-point source pollution, and the results shown that the inflow loads of COD, NH3-N and TP into the river were 34.59t/a, 0.12t/a and 0.71t/a, respectively. It was found that the main cause of the pollution in the east flash flood gully was point source pollution, and the proportions of COD, NH3-N and TP into the river were 90.33%, 99.72% and 84.61%, respectively.
Key Words: water pollution; principal component analysis; point source pollution; water quality monitoring;
Fig.1 Distribution of sampling points in DongPieHong Ditch
2.2.2 Surface runoff sampling
Moderate rain or heavy rain was selected for monitoring. In the initial flushing stage of rainfall, samples were collected within 30min of the self-generated flow and every 5min. One sample was taken every 10 min between 30 and 60 min. Samples were then sampled at intervals of 30min, with a total sampling time of 3h. Take three equal water samples at each time period, and monitor the concentration of COD, NH3-NandTPaftermixingevenly.
2.3 Pollution Load Calculation Model 2.3.1 Town point source pollution
According to the per capita comprehensive discharge coefficient, the pollutant emissions of residents’ living can be calculated. The per capita comprehensive discharge coefficient can be checked by the “Handbook for Pollution Source Production and Pollution Emission Coefficient”. The calculation method for the discharge of pollutants from residents' living sources is:
GP=365×NFP×10-6 (1) Where: Gp is the pollutant discharge (t/a) of residents’ living; N is the resident population (person); Fp is the resident pollutant production coefficient (g/person·d).
2.3.2 Surface runoff pollution
Urban surface runoff pollution calculation method:
Wdi,j=Sdi*Q*Cdi,j*Ψ*ψ*10-9 (2) Wd,j=ΣWdi,j
In the formula,Wdi,j is the annual discharge (t/a) of pollutants of type i block type j; Sdi is the land type i area; Q is the annual rainfall (mm);Cdi,j is the concentration of pollutants in the initial rainwater of the i block (mg/L); Ψ is the runoff coefficient;ψ is the coefficient of pollutant inflow into river; Wd,j is the pollutant discharge (t/a) of pollutant j for one year.
2.3.3 Rural non-point source pollution
Agricultural non-point source calculation method:
Wmi,j=θmi,j*Smi*φm,i (3) Wm,j=ΣWmi,j
Where Wmi,j is the pollution discharge (t/a) of land type i non-point source pollutants for one year;θmi,j is the land type i discharge coefficient (kg/mu·year); Smi is the land type i area (km2);φmi is the coefficient of entry into the river for land type i surface source pollutants; Wm,j is the non-point source pollutant j one year of pollution discharge (t/a);
3.Results and Analysis
3.1 Spatial Distribution of Pollutants
According to the concentration of various pollutants (Table 1) and spatial distribution characteristics (Fig. 2), the concentration of various pollutants in 5 sampling points did not change much, and the variation coefficient was between 12.86-29.30, indicated that the pollution sources in the river might be distributed in a scattered way. Field investigation shown that there were sewage discharge outlets in the river and they were distributed in a scattered way.
Table 1 Water quality indicators of DongPieHong Ditch
3.2 Principal Component Analysis
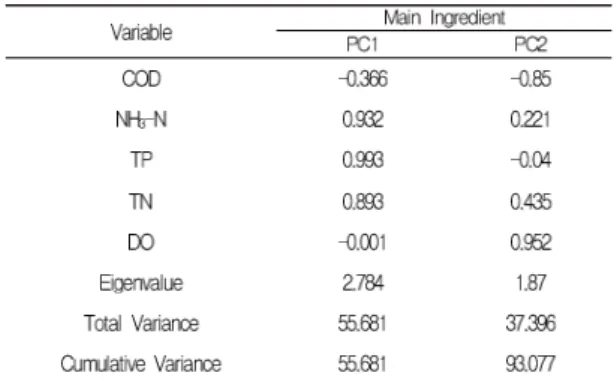
The SPSS was used to analyze the correlation of the sampled data and the results were analyzed (Table 2). It can be seen from the table that NH3-N is significantly correlated with TP and TN, indicating that the three pollutants may come from the same source, the main component. The analysis results (as shown in Table 3) shown that the three common factors with eigenvalues greater than 1 are extracted, and the cumulative contribution rate was 93.08%. The main component PC1 was mainly composed of NH3-N, TP, TN, and the water body nitrogen and phosphorus nutrients. The content of the main component PC2 was mainly composed of COD and DO, which may be related to organic pollution.
Table 2 Person correlation analysis results
* At the 0.05 level (two-tailed), the correlation is significant.
Table 3 Principal Component Analysis Results
3.3 Pollution into the River Load
The investigation of DongPieHong Ditch basin shown that the sewage from industrial enterprises in the river basin was discharged into the sewage treatment plant through the pipe network, and there was no outlet of industrial sewage in the river. Because the river mainly flows through residential areas, and the east coast sewage pipe network construction was not complete, a large number of domestic sewage direct discharge be found.
Therefore, the main cause of point source pollution was the domestic sewage discharged into the river through the outlet of the domestic sewage. Due to the low terrain in the west and high in the east, the east bank is the main catchment area of the river. Non-point source pollution is mainly caused by rainwater flowing through different land types(Fig.3) to carry pollutants into the river, which can be divided into agricultural non-point source pollution and surface runoff pollution.
Fig.3 Type of land use of DongPieHong Ditch
3.3.1 Town point source pollution
The point source pollution was mainly the living pollution of urban residents. According to
“Technical Guide for the Rural Environmental Contiguous Demonstration Project in Anhui Province”, “The First National Pollution Source Survey of Urban Living Sources and Discharge Coefficients”, the per capita pollutant discharge was determined (Table 4), the annual COD, NH3-N and TP emissions of about 25,000 people in the basin are calculated, and the pollutant discharge load into the river was calculated with the pollutant inflow coefficient of 0.6 (Table 5).
Table 4 Per capita pollutant discharge
Table 5 Load of pollutants into the river
3.3.2 Non-point source pollution
Non-point source pollution was mainly agricultural non-point source pollution and urban surface runoff pollution. According to the area of various land types (Table 6), the average concentration of surface runoff pollutants in initial rainwater (Table 7) and the average annual rainfall of ChaoHu city, the load of non-point source pollution into the river (Table 8) was calculated.
Table 6 Summary of parcel classification area
Table 7 Average concentration of surface runoff pollutants in initial rainwater
Table 8 Pollutant Discharge and Inflow Load
3.3.3 Structural characteristics of pollution sources
Fig.4 to Fig.6 shown that point source pollution was mainly sources of pollution, among which the main point source pollution was urban living pollution, COD, NH3-N and TP accounting for the largest proportion of the total river load, respectively 90.33%, 99.72% and 84.61%. Therefore, it can be seen that point source pollution was the largest source of river pollution in DongPieHong Ditch, followed by non-point source surface runoff pollution and
agricultural non-point source pollution.
Table 9 Statistics of pollution source structure
Fig.4 COD pollution source structure
Fig.5 NH3-N pollution source structure
Fig.6 TP pollution source structure
4.Conclusion
According to the results of principal component analysis, it can be concluded that the main reason of water quality deterioration was the surplus of nitrogen and phosphorus, which was closely related to human activities.
According to the calculation of the load of pollutants into the river and the analysis of the structure of pollution sources, it can be concluded that the main cause of the water pollution in DongPieHong Ditch was the point source pollution caused by the direct discharge of domestic sewage from residential areas, which COD, TP and TN occupation of discharge was up to 90.33%, 99.72% and 84.61%. In order to control point source pollution, rain and sewage diversion measures should be taken to cut off the sewage outlet and reduce the load of pollution into the river.
Acknowledgments
This research were supported by Anhui Provincial Central Committee Guides Local Science and Technology Development Project (YDZX20183400004146). Financial Support Project for Top-notch Talents in the Universities of Anhui (gxgnfx2018030). Hefei Independent Innovation Policy ‘Borrowing and Subsidizing’ Fund Project (J2018G22). National Special Item on Water Resource and Environment (2017ZX07603-003). Opening Project of Anhui Key Laboratory (MJ-ZK201701). Talent Research Foundation of Hefei University (16-17RC04). Innovation Team for Manucipal Solid Waste Treatment of Anhui.
References
[1] René P. Schwarzenbach, Thomas Egli, Thomas B. Hofstetter, Urs Von Gunten, Bernhard Wehrli, (2010), “Global water pollution and human health”, Annual Review of Environment and Resources, Vol.
35, No. 1, P. 109-136.
[2] Charles J. Vörösmarty, Pamela Green, Joseph Salisbury, Richard B. Lammers,
(2000), “Global water resources:
Vulnerability from climate change and population growth”, Science, Vol. 289, No.
5477, P. 284-288.
[3] HuiPing Zhou, Yan Gao, AiJing Yin, (2014),
“Methods of source apportionment of water pollution and application progress”, Environmental Protection Science, Vol. 40, No. 6, P. 19-24.
[4] HuaiCheng Zhang, Jie Dong, ZaiFeng Wang, (2013), “The latest progress on source apportionment of water pollution source”, Environmental Monitoring in China, Vol. 29, No. 1, P. 28-22.
[5] WeiLi Duan, Bin He, Daniel Nover, GuiShan Yang, Wen Chen, HuiFang Meng, Shan Zou, ChuanMing Liu, (2016), “Water Quality Assessment and Pollution Source Identification of the Eastern Poyang Lake Basin Using Multivariate Statistical Methods” Sustainability, Vol. 8, P. 133-147.
[6] BinYou Gao, LiXin Yang, Chao Song. (2016),
“General strategy and innovative practices on rehabilitation and protection of Chao lake”, Journal of Biology, Vol. 33, No. 2, P.
1-7.
[7] ZaoMing Song, He Li, Jun Chen, YuFang Bai, Chen Gong, Ke Wu,(2016), “Influential factors of tailings ecological environment in Wangjiaao, Chaohu”, Journal of Biology, Vol.33, No. 2, P. 17-20.
[8] JingJing Wu, Ke Wu, Jun Chen, YaYun Sun, Chao Deng, Jie Jin, (2016), “Hefei Binhu lake national forest park of plant configuration research”, Journal of Biology, Vol.33, No. 2, P. 26-29.
[9] YuFang Bai, Ke Wu, DongBiao Wu, Jun Chen, ZaoMing Song, LiLi Meng,(2016),
“Pollution features and treatment of simple domestic waste disposal sites in Paihe river basin”, Journal of Biology, Vol.33, No. 2, P.
60-63.
[10] Xin Zhang, ZongXue Xu, XinYu Kuang, TongWen Dou, ChangSen Zhao, BoHan Wang, (2018), “Source Apportionment of Urban Fresh Water Quality and Spatial Distribution of Jinan City”, Yellow River, Vol. 40, No. 2, P. 63-68.
[11] PingJing Gui, Feng Wang, ShanPu Li, Xi Zhou, LiKou Zou, LiangQian Fan, (2016),
“Estimation and evaluation of agricultural
non-point source pollution load by stage export co- efficient model: A case study in Sichuan Province”, Acta Agriculturae Zhejiangensis, Vol. 28, No. 1, P. 110-118.
[12] Lei Wu, JianEn Gao, XiaoYi Ma, Dan Li, (2015), “Application of modified export coefficient method on the load estimation of non-point source nitrogen and phosphorus pollution of soil and water loss in semiarid regions”, Environmental Science and Pollution Research, Vol. 22, No. 14, P.
10647-10660.
[13] Maruyama Toshisuke, Noto Fumikazu, Takimoto Hiroshi, Kimihito Nakamura, Takeo Onishi, (2011), “Assessment of the long-term variation in the nitrogen pollution load potential from farmland to groundwater in the Tedori River Basin, Japan”, Paddy and Water Environment, Vol. 9, No. 4, P.
441-449.
[14] JianJian Wang, QiaoHua Zhao, Yong Pang, KaiMing Hu, (2017), “Research on nutrient pollution load in Lake Taihu, China”, Environmental Science and Pollution Research, Vol. 24, No. 21, P. 17829-17838.
논문투고일 2019년 11월 30일 논문심사일 2019년 12월 10일 논문게재일 2019년 12월 30일