83
<원례보저>
Cerebellar maturation ratio of forebrain and brainstem at magnetic resonance imaging in the micropig
Kang-jae Yi, Jun-young Kim, Namsoon Lee, Mihyun Choi, Jung-hee Yoon, Min-cheol Choi*
Department of Veterinary Medical Imaging, College of Veterinary Medicine and Research Institute for Veterinary Science, Seoul National University, Seoul 151-742, Korea
(Received: October 5, 2011; Revised: April 27, 2012; Accepted: May 7, 2012)
Abstract : The study of pigs as a human disease model has been conducted in neuroscience. But the morphological development of pig brain by using MRI is rare. The purpose of this study is to determine whether cerebellum maintains consistent proportion to other brain regions in aging.
Clinically healthy sixteen micropigs, 1, 2, 4, and 8 months were studied. The micropigs were anesthetized with isoflorane. MRI was acquired using a 0.3T system. To figure out development of ratio that allowed identification of normal cerebellum size, we measured the area of the cerebellum, brainstem, and forebrain from the mid-sagittal brain images on T1W. Mid-sagittal cross-sectional area (CSA) of total brain, forebrain, brainstem, and cerebellum were expressed as absolute values and also as percentages which were compared between the four age groups of micropigs for the purpose to define the effect of age on brain morphometry. It was found that there was not a significant difference in the percentage of the brain occupied by an individual region between groups although the absolute CSA differed significantly among age groups. There was no effect of age on the ratio between the cerebellum and total brain in 4 age groups. The normal size of cerebellum changes during brain development maintained a consistent ratio to other brain regions in normal micropigs. The ratio of CSA quantified on the mid-sagittal MR images offers a suitable method to detect presence of cerebellar anomalies in micropigs.
Key words : cerebellum, maturation, micropig, MRI
Introduction
The micropig has been used as an experimental animal model in the field of neuroscience [13].
Morphologically, compared to other small laboratory animals, the pigs’ brain resembles the human brain (gyrencephlic) more in anatomy, growth and development [6]. The studies of pig’s brain with MRI are not sufficient, but the body composition analysis, MRI protocol for in vivo visualization, myelination study, microstructural and cerebrovascular changes are revealed [3, 8, 12, 19]. But the brain regions according to brain development using MRI are not studied.
The aim of this experiment is to describe the effect of age on brain morphometry (cerebellum, brainstem and forebrain) with mid-sagittal brain images using MRI.
Materials and Methods
Animal preparation
Clinically healthy sixteen micropigs (1, 2, 4 and 8 month-age groups, Medi Kinetics micropigs; Medi Kinetics, Korea) were used for the brain morphometry.
Each age group consists of 4 micropigs without gender difference, weighing from 5 to 20 kg.
All animals were raised under microbiologically well controlled conditions and dry food was provided with water ad libitm. This research strictly followed the guide line of the ‘Guide for the Care and Use of Laboratory Animals’ of Seoul National University, Korea.
Methods
All micropigs were anesthetized with propofol and isoflurane, and MRI scan was performed using a 0.3 T
*Corresponding author
Tel: +82-2-880-1278, Fax: +82-2-880-8662 E-mail: mcchoi@snu.ac.kr
were used for calculation of the cerebellum, brainstem and forebrain (Fig. 1). The outlines of the areas of three brain regions were manually traced. Mid-sagittal cross- sectional area (CSA) of total brain, forebrain, brainstem, and cerebellum were expressed as absolute values (mm2) and also as percentages to the total brain.
SPSS was used for data analysis. P values of below 0.05 were considered significant.
Results
Mid-sagittal cross-sectional images of three brain regions were acquired (Fig. 1). We selected T1 weighted image for evaluating brain size, because the brain margin is more distinct so that it is easy to trace each brain region (Fig. 2). Mid-sagittal CSA of total brain, forebrain, brainstem, cerebellum, and ratio of the three brains to
region to total brain, data distribution was established
Fig. 2. Mid-sagittal CSA image of 2 month micorpig. Images were scanned on the T1 weighted sequence (A), and on the T2 weighted sequence (B). Note that the brain margin on T1-weighted image is more distinct than on T2-weighted image.
Table 1. Mean and Standard Deviation of the Mid-sagittal cross-sectional area (CSA) of total brain, forebrain, brainstem, cerebellum, and ratio of the three brains to TB for groups in 1~8 month age range
1 month 2 month 3 month 4 month
Total brain 1,402.35± 6.84 1,676.80± 4.19 1,707.59± 5.85 1,947.68± 6.64 Forebrain 969.28± 4.74 1,094.65± 4.83 1,145.85± 5.03 1,346.17± 6.96
Brainstem 159.43± 2.62 202.47± 4.07 219.02± 4.20 243.88± 2.38
Cerebellum 273.64± 4.27 331.26± 2.73 342.67± 2.61 357.62± 2.83
FB : TB (%) 69.11± 0.94 65.28± 1.00 67.10± 1.38 69.11± 1.00
BS : TB (%) 11.36± 0.29 12.07± 0.56 12.82± 0.40 12.52± 0.29
CBM : TB (%) 18.33± 0.84 19.75± 0.60 20.67± 1.33 18.33± 0.91
CSA: mm2. FB: forebrain, TB: total brain, BS: brainstem, CBM: cerebellum. All data are expressed as the mean± SD (range).
Fig. 1. T1-weighted mid-sagittal MR image of the brain of a micropig. Note the manually traced outline of the three brain regions of interest: cerebellum (1), brainstem (2), forebrain (3).
using linear regression. There was a strong positive correlation between cross-sectional area of each brain region and age. Although the absolute CSA differed significantly among age groups, there was not a significant difference in the percentage of the brain occupied by an individual region between groups. There was no significant effect of age and weight on the CSA
of the ratio of cerebellum to total brain in the four age groups when evaluated using linear regression (Fig. 4).
Discussion
The cerebellum plays an important role in motor control and contributes to coordination, precision and accurate timing. When there is a lesion in the cerebellum, ataxia or incoordination of the head, neck and all four limbs with preservation of strength is usually caused [9].
In young animal, cerebellar abiotrophy, degeneration, hypoplasia, cortical atrophy and other diseases are reported in many species [2, 4, 5, 14, 15, 17, 18].
Though the cerebellum is thought to be one part of the brain, the MRI study of the pig with growth development and age is rare. In human studies, the cerebellum shows reduction in the volume of the cerebellar hemispheres and the cerebellar vermis with age advanced [7, 10, 11]. In one study of cerebellum volume of normal Koreans who were in their 20s and 40s, the volume of the cerebellum was significantly Fig. 3. Relationship between cross-sectional area (CSA) of
the cerebellum (A), brainstem (B), forebrain (C) with age.
CSM: cerebellum; BS: brainstem; FB: forebrain. (A) R2= 0.4282, p = 0.006; (B) R2= 0.7625, p < 0.0001; (C) R2= 0.9161, p < 0.0001.
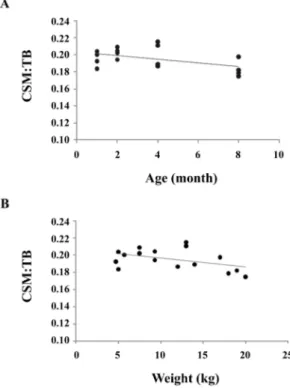
Fig. 4. Relationship between CSA of the ratio of cerebellum to total brain with age and weight. CBM: cerebellum; TB:
total brain. (A) R2= 0.2418, p = 0.053; (B) R2= 0.0198, p = 0.084.
another study, the time course and regional differences in age-related volume loss in cerebellum and brainstem, the volume remained stable until age 50 years and declined thereafter. Volume loss in the cerebellar vermis was striking [7].
In a study of the development of a morphometric MRI in the dog’s brain, the ratio of the cerebellum to total brain and of the brainstem to cerebellum mid-sagittal cross-sectional area was compared. In this study, the percentage of the brain occupied by the cerebellum in diverse dog breeds between 1 and 5 years of age was not significantly different and cerebellum size did not change with increasing age [16].
In our study with micropigs, it was found that there was not a significant difference in the percentage of the brain occupied by an individual region between 1-month to 9-month age although the absolute CSA differed significantly among in different ages. And there was no effect of age on the ratio between the cerebellum and total brain in 4 age groups (18.3~20.7%). These results show similar trend like those in dogs (14.5~16.3%) [16].
The normal size of cerebellum change during brain development maintains a consistent ratio to other brain regions in normal micropigs, which is also a similar pattern like those in the dog and human.
But there are some limitation in our study with a narrow range of age group, lack of animal number and postmortem study. So, further study is needed for brain atrophy and degeneration in aged micropigs for human brain research.
MR imaging provide for the brain morphological and neuroanatomical information, and it is also a noninvasive imaging technique to assess morphometric analysis of CSA of the three brain regions. This measurement may be useful in the future for studying consistent ratio of cerebellum to total brain associated with age. This measurement that detects cerebellar abnormality would be very useful clinically.
In conclusion, while the size of the brain was directly related to the age and size of the animal, the cerebellum maintained a consistent ratio to other brain regions in normal micropig.
Administration, Korea.
References
1. Chung SC, Choi DY, Lee BY, Lee B, Eom JS, Sohn JH. Measuring of the cerebellar volume of normal Koreans in their 20s and 40s using magnetic resonance imaging. J Korean Radiol Soc 2004, 51, 489-493.
2. de Lahunta A. Abiotrophy in domestic animals: a review. Can J Vet Res 1990, 54, 65-76.
3. Fang M, Li J, Gong X, Antonio G, Lee F, Kwong WH, Wai SM, Yew DT. Myelination of the pig's brain:
a correlated MRI and histological study. Neurosignals 2005, 14, 102-108.
4. Gould DH, Le Couteur RA, Bertone JJ, Knight AP.
Cerebellar cortical atrophy in Angus calves. Proc Am Coll Vet Pathol 1985, 239
5. Kent M, Glass E, deLahunta A. Cerebellar cortical abiotrophy in a beagle. J Small Anim Pract 2000, 41, 321-323.
6. Lind NM, Moustgaard A, Jelsing J, Vajta G, Cumming P, Hansen AK. The use of pigs in neuroscience: modeling brain disorders. Neurosci Biobehav Rev 2007, 31, 728-751.
7. Luft AR, Skalej M, Schulz JB, Welte D, Kolb R, Bürk K, Klockgether T, Voight K. Patterns of age- related shrinkage in cerebellum and brainstem observed in vivo using three-dimensional MRI volumetry. Cereb Cortex 1999, 9, 712-721.
8. Mitchell AD, Scholz AM, Wange PC, Song H. Body composition analysis of the pig by magnetic resonance imaging. J Anim Sci 2001, 79, 1800-1813.
9. Nelson RW, Couto CG. Disorders of locomotion ed.:
Small animal internal medicine, 2nd ed. pp. 970-1001, Mosby, St. Louis, 1998.
10. Raz N, Dupuis JH, Briggs SD, McGavran C, Acker JD. Differential effects of age and sex on the cerebellar hemispheres and the vermis: a prospective MR study.
AJNR Am J Neuroradiol 1998, 19, 65-71.
11. Raz N, Gunning-Dixon F, Head D, Williamson A, Acker JD. Age and sex differences in the cerebellum and the ventral pons: a prospective MR study of healthy adults. AJNR Am J Neuroradiol 2001, 22, 1161-1167.
12. Rosendal F, Pedersen M, Sangill R, Stødkilde- Jørgensen H, Nielsen MS, Bjarkam CR, Sunde N, Sørensen JC. MRI protocol for in vivo visualization of the Göttingen micropig brain improves targeting in experimental functional neurosurgery. Brain Res Bull 2009, 79, 41-45.
13. Sauleau P, Lapouble E, Val-Laillet D, Malbert CH.
The pig model in brain imaging and neurosurgery.
Animal 2009, 3, 1138-1151.
14. Steinberg HS, Van Winkle T, Bell JS, de Lahunta A. Cerebellar degeneration in Old English Sheepdogs.
J Am Vet Med Assoc 2000, 217, 1162-1165.
15. Swan RA, Taylor EG. Cerebellar hypoplasia in beef shorthorn calves. Aust Vet J 1982, 59, 95-96.
16. Thames RA, Robertson ID, Flegel T, Henke D, O'Brien DP, Coates JR, Olby NJ. Development of a
morphometric magnetic resonance image parameter suitable for distinguishing between normal dogs and dogs with cerebellar atrophy. Vet Radiol Ultrasound 2010, 51, 246-253.
17. van der Merwe LL, Lane E. Diagnosis of cerebellar cortical degeneration in a Scottish terrier using magnetic resonance imaging. J Small Anim Pract 2001, 42, 409-412.
18. Whittington RJ, Morton AG, Kennedy DJ. Cerebellar abiotrophy in crossbred cattle. Aust Vet J 1989, 66, 12- 15.
19. Winter JD, Dorner S, Lukovic J, Fisher JA, St Lawrence KS, Kassner A. Noninvasive MRI measures of microstructural and cerebrovascular changes during normal swine brain development. Pediatr Res 2011, 69, 418-424.