DOI : http://dx.doi.org/10.5394/KINPR.2017.41.5.353
Measurement of Port Service Quality in Container Transport Logistics Using Importance –Performance Analysis: A Case of Busan Port
Min-Ho Ha*․†Ki-Myung Ahn
*School of Civil and Environmental Engineering, Nanyang Technological University, Singapore
†Division of Shipping management, Korea Maritime and Ocean University, Korea
Abstract: This study aims to propose an assessment tool of port service quality (PSQ) in the context of container transport logistics (CTLs), by taking the perspectives from port users. The CTLs defined in this study are the relevant activities of serving the physical flows of a container box from a point of origin via a container port to a point of destination. To address the ports’ role in collaboration between its channel members in CTLs, the PSQ measures for all port user groups (i.e. common PSQ measures) are selected based on the relevant CTLs activities involved by port, and its users within terminal/port area as well as throughout the CTLs chain. An importance-performance analysis (IPA) is applied as a diagnostic tool to analyse the status quo of Busan Port in CTLs contexts, by comparing the importance and performance (IP) scores against each individual CTLs criterion. The findings from the IPA reveal that port managers and policy makers at the Busan Port should concentrate on six PSQ measures (i.e. SR1, SR4, ITS1, VAS1, VAS4, ICI3) to enhance PSQ in CTLs. However, four measures (i.e. ITS2, ITS3, ITS4, VAS2) are identified as a possible overkill, indicating an area of inefficiency where a remedial action of the cost-cutting decision is necessary. On the other hand, the Busan port shows an outstanding performance on four measures such as SR2, SR3, ICI1 and ICI2. The measures are not only important but also high performance. The study findings provide managerial guidance to port managers in Busan Port, in view of searching for managerial and operational strategies for sustainable port growth.
Key words : Port Service Quality, Container Transport Logistics, Importance-Performance Analysis, Container Ports, Port Users
†Corresponding author : [email protected] 051)410-4385
1. Introduction
Busan Port, on the one hand, faces an inevitable port competition with major Asian container ports to seizure transhipment cargoes, while on the other hand, the port is in competition with domestic container ports to capture gateway cargoes. To this end, port service quality (PSQ) that measures ports meet the customers’ expectations is always considered as one of the most important criteria in port choice, port competition and port competitiveness (Brooks and Schellinck, 2013). Since the adaptation of the lean and agile principles in the port and maritime domains based on the supply chain management (Marlow and Paixão Casaca, 2003), the physical scope of research on PSQ has increasingly enlarged from within the terminal/port area to throughout the container transport logistics (CTLs) chain. The CTLs defined in this study is the relevant activities of serving the physical flows of a container box from a point of origin via a container port to
a point of destination (Lai and Cheng, 2003). In this respect,
the sole efforts on service quality improvement made by
terminal operating companies (TOCs) and port authority
(PA) look apparently ineffective but the efforts should be
made on collaboration principles with relevant members in
the chain. Previous studies have addressed the significance
of collaboration among the channel members and its
effectiveness on port performance and competitiveness
(Panayides and Song, 2009). Therefore, ports need to
basically collaborate with their channel members to keep
the ports sustainable in the intense port competitions. This
is, however, a challenging task for ports because there are
various conflicts and interest of different stakeholders in
complex port systems. To deliver the task in reconciling
the conflicting interests with success, critical diagnosis of
ports’ status quo by taking the perspectives from port
stakeholders would be a prerequisite. In the CTLs chain,
ports need to proactively interact with the most influential
stakeholders (i.e. commercial port users such as shipping
of Busan Port line, shipper and its agents, logistics service providers, etc.)
so that they can identify their interests and concerns in changing logistics environment.
To this end, this study proposes an assessment of PSQ in CTLs contexts by taking the perspectives from port users. An importance-performance analysis (IPA) is applied as a diagnostic tool to analyse the status quo of Busan Port in CTLs comparing the importance and performance (IP) scores against each individual CTLs criterion. In particular, we attempt to provide the vital strategies for Busan Port in establishing sustainability for future growth and to meet the needs of port users.
The remainder of the paper is structured as follows. In the next section, the theoretical background of IPA and PSQ is carefully reviewed. Section 3 demonstrates the implementation of IPA method and its results are discussed in section 4. Finally, the paper concludes with the managerial implications and recommendations for further research.
2. Literature review
2.1 Importance-performance analysis
Importance-performance analysis (IPA) was first introduced by Martilla and James (1977) for a marketing tool and then its use has been widely accepted in tourism and hospitality (Tonge and Moore, 2007), health services (Abalo et al., 2007), port and logistics (Lai and Cheng, 2003;
Lee and Hu, 2012; Brooks and Schellinck, 2013). Thanks to its simple implementation and visualising both data and strategic suggestions, IPA has been used for the diagnosis or monitoring of services or products, which enables decision makers to translate the results into managerial actions.
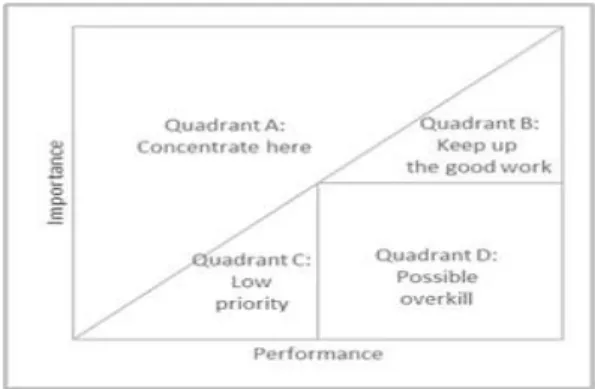
In this study, we use the IPA method developed by Abalo et al. (2007), which enlarged the top left quadrant of the original partition by means of an upward diagonal line on which importance is equal to performance as seen in Fig 1, leading decision makers to distinguish distinct significance between the attributes. This differs from Martilla and James' original version in which the importance-performance matrix (IPM) has the same size of four quadrants. The interpretation of four quadrants is the same as the original one. The quadrant A, ‘concentrate here’, denotes that attributes were evaluated with high
importance and low performance. Attributes in the quadrant B, ‘keep up the good work’, were evaluated with high importance and high performance. Attributes in the quadrant C, ‘lower priority’, were evaluated with low importance and low performance. The quadrant D, ‘possible overkill’ explains that attributes were evaluated as low importance and high performance.
Fig. 1 IPA matrix
2.2 Port service quality
Previous studies mainly investigated whether a service quality delivered by ports meets port users’ needs in terms of timing, quantity and quality (Brooks, 2006). In addition, some indicator to measure port agility, or the speed with which the port service provider responds to and flexibly meets customers’ special requests were used to evaluate service quality (Brooks and Schellinck, 2013). These are also underpinned by the SERVQUAL on service quality in the port industry (Shin et al., 2001; Ugboma et al., 2004). In addition, a significance of the port/terminal roles in supply chain contexts has been acknowledged (Marlow and Paixão Casaca, 2003; Panayides and Song, 2009). In this context, higher integration and coordination between the players in supply chains lead to a higher port competitiveness. Marlow and Paixão Casaca (2003) argued that agile ports entail a reliable and adequate multimodal process which is at the heart of lean port competitiveness. Therefore, ports should be integrated with other logistics players in CTLs, indicating that integration is not only limited to setting up systems and processes but also on the functional activities (Panayides and Song, 2009). Most of these studies, however, focused on either developing conceptual frameworks or finding causal relationships between perceived service quality and port performance/
competitiveness/ service (re)purchase/ customer loyalty/
customer satisfaction. This study attempting to use IPA
focuses on identifying strength and weakness of the case port and formulates port management strategies based on the visualised IPA strategic suggestions. The strategies are proposed based on IPA results obtained by the difference between the expected service quality (i.e. importance) and the perceived service quality (i.e. performance). We also address this study need due to a series of world economic recessions that make ports face emerging challenges in the decision-making of their investment portfolios.
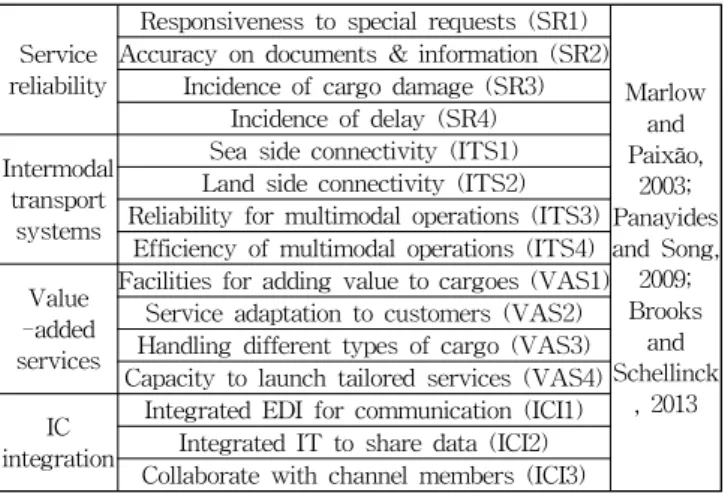
The measures of PSQ in CTLs contexts were identified based on port performance indicators (PPIs) identified by Ha et al. (2017). However, some indicators which are not related to the PSQ in CTLs were adjusted to the CTLs contexts by a group of experts. They include (1) 6 industrial experts who have been working in the shipping and port industries for more than 15 years with PhD (1 expert from a shipping line), MSc (3 experts from terminal operators, a shipping line and a forwarder) and BA (1 from a terminal operator and a forwarder, respectively) (2) 2 professors who have more than 15 years teaching and research experience (3) 2 experts from government/port authorities (1 department manager and 1 managing director) who have been working for port logistics departments. It is noteworthy that they are also invited to evaluate the ‘level of importance’ on PSQ measures based on Analytic Hierarchy Process (AHP). The adjusted measures represent the inter-activities among the relevant stakeholders (i.e. a port and its customers) in CTLs and their varied needs as shown in Table 1.
Table 1 Measures in container transport logistics(CTLs)
Servicereliability
Responsiveness to special requests (SR1)
Marlow Paixão,and 2003;
Panayides and Song,
2009;
Brooks Schellinckand
, 2013 Accuracy on documents & information (SR2)
Incidence of cargo damage (SR3) Incidence of delay (SR4) Intermodal
transport systems
Sea side connectivity (ITS1) Land side connectivity (ITS2) Reliability for multimodal operations (ITS3)
Efficiency of multimodal operations (ITS4) Value
-added services
Facilities for adding value to cargoes (VAS1) Service adaptation to customers (VAS2) Handling different types of cargo (VAS3) Capacity to launch tailored services (VAS4) IC
integration
Integrated EDI for communication (ICI1) Integrated IT to share data (ICI2) Collaborate with channel members (ICI3)
The measures relate to (1) the extent to which the port service delivered by ports meets port users’ needs in terms of on-time, right quantity and right quality (service reliability); (2) the extent to which a port provides an adequate connectivity to both sea side and land side and
the well-established operations between each transport mode (intermodal transport systems); (3) the extent to which a port has the ability to add value to the services that it provides in the context of facilitating further the objectives of the supply chain system (value-added services); (4) the extent to which a port achieves the establishment and use of seamless communication systems that facilitate efficient servicing of CTLs operations and achievement of CTLs goals (IC integration).
3. Application of Importance-performance Analysis
In implementing IPA for empirical setting, CTLs measures need to be evaluated in terms of the ‘level of importance’ and the ‘level of performance’. The measures’
importance should be evaluated prior to evaluating the measures’ performance of the Busan Port as Martilla and James (1977) recommended. AHP (Saaty, 1980) was used for evaluating CTLs measures importance to avoid the
‘ceiling effects’, representing all attributes with high importance rate, which is a major problem observed from IPA empirical studies.
The 10 panel of experts were approached to respond to a question such as “which measure should be emphasized more in the context of CTLs, and how much more?” Using Saaty’s nine-point scale for a number of pairwise comparisons, the AHP questionnaire was devised. The evaluations of the ten experts were verified with the CR (consistency ratio) of 0.1 or less. Table 2 denotes the local weights (LW) of measures in a two-level structure and the global weights (GW) of the bottom level measures.
However, the local weights of measures on the bottom level are generally affected by the number of measures in a cluster. For instance, there are three measures under the dimension of the IC integration (i.e. ICI1, ICI2, ICI3), which show high importance rates than the ones in the other dimensions. To this end, we normalised the local weights by multiplying the local weights with the number of measure out of the total number of measure (i.e.
multiplying local weight with 3/15 for measures under the
IC integration dimension and with 4/15 for the other
dimensions). Then the global weights of the bottom level
measures by multiplying their normalised local weights
(NLW) with the ones of their associated upper-level
measures. But the sum of global weights is not ‘1 (100%)’,
which needs to be normalised again to obtain the
of Busan Port normalised global weights (NGW) of ∑
.
The performance of Busan Port with respect to each measure was evaluated by port users (i.e. shipping line, freight forwarder and other logistics service providers) using a five-point scale ranging from 1 (very poor/strongly dissatisfied) to 5 (very good/strongly satisfied). The survey was conducted through an online survey tool as well as distributed by emails from October 2014 to March 2015. 86 valid responses were collected from the port users, 32 from shipping lines and 54 from other port users. It is noteworthy that our primary focus is to conduct the diagnosis of Busan Port’ situation with regards to port collaboration between its channel members in CTLs through surveying the expected and perceived service quality from port stakeholders. The approach should be conducted on the basis of an integrated perspective rather than specific to different port user groups. Consequently, the measures in Table 1 denote more common for all port user groups than specific to each port user group. To this end, our analysis conducts based on the integrated data taking from all port user groups. Table 2 summarises the means and standard deviations of the performance ratings of Busan Port on the PSQ measures. The normalised global weights and performance rates are used as input for IPA empirical setting to diagnose the status quo of Busan Port.
This study uses the actual mean scores of importance and performance of all measures to determine the cross-hair points (i.e. data centred diagonal line model) and plotted the measures on the four quadrants of the IPM as seen in Fig. 2.
Table 2 Importance and performance of the CTLs measures
Importance Performance
Dimension Items LW N. LW GW N. GW Mean SD Service
reliability (0.311)
SR1 0.246 0.066 0.020 0.084 3.38 0.92 SR2 0.226 0.060 0.019 0.077 3.64 0.82 SR3 0.267 0.071 0.022 0.091 3.73 0.90 SR4 0.262 0.070 0.022 0.090 3.35 0.79 Intermodal
transport systems
(0.243)
ITS1 0.361 0.096 0.021 0.088 3.56 0.90 ITS2 0.197 0.053 0.012 0.048 3.58 0.92 ITS3 0.227 0.061 0.013 0.055 3.65 0.85 ITS4 0.215 0.057 0.013 0.052 3.55 0.84 Value-added
services (0.212)
VAS1 0.297 0.079 0.013 0.055 3.28 0.98 VAS2 0.207 0.055 0.009 0.038 3.54 0.90 VAS3 0.229 0.061 0.010 0.042 3.50 0.99 VAS4 0.268 0.071 0.012 0.050 3.42 0.91 Information
communication integration
(0.235)
ICI1 0.344 0.069 0.019 0.078 3.71 0.79 ICI2 0.333 0.067 0.018 0.076 3.65 0.83 ICI3 0.323 0.065 0.018 0.074 3.56 0.77
Sum (average) 1.00 0.24 1.00
(0.067) (3.54)
4. Results and discussion
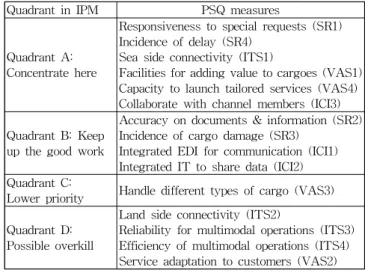
The results in Fig. 2 suggest that PPIs are plotted on the right side of the IPMs, i.e. in the quadrant A (upper side), quadrant B and quadrant D. The findings suggest that six CTLs measures (SR1, SR4, ITS1, VAS1, VAS4, ICI3) are fallen into the quadrant A: concentrate here, four (SR2, SR3, ICI1, ICI2) are located in the quadrant B: keep the good work, one (VAS3) is located in the quadrant C: lower priority and four (ITS2, ITS3, ITS4, VAS2) are located in the quadrant D: possible overkill. The CTLs measures belonged to the quadrant A are diagnosed as the area of the weakness in Busan Port, indicating port managers should allocate their available resources on the measures to improve port performance and to meet port users’
expectations. In particular, SR1 (responsiveness to special requests) and SR4 (incidence of delay) need a special attention as the IP gap is relatively distinct compared to other measures in the quadrant A. The similar results were found in Ha et al.’s (2017), according to their results on performance of Korean major container ports, performance with respect to SR1 in the ports was measured as Gwangyang (0.7510), followed by Incheon (0.6355), Busan New (0.6307) and Busan North (0.6247). On the other hand, Gwangyang outperforms other ports in terms of SR4 with 0.7299, followed by Busan New (0.6720), Incheon (0.6113) and Busan North (0.5634). From the results, we assume that the low service reliability of Busan Port is mainly contributed by Busan North Port, which implies that port managers and policy makers in Busan Port need to pay more attention to Busan North Port to keep Busan Port sustainable.
However, the CTLs measures located in the quadrant B
can be considered as the area of strength, which has to be
continuously maintained. From the results, Busan Port is
highly in compliance with cargo handling safety/security
code such as ISPS (International Code for the Security of
Ships and of Port Facilities). In addition, thanks to ‘National
Logistics Master Plan, 2011-2020’ launched by Korean
Government, Port management Information System
(Port-MIS) and domestic Shipping and Port-logistics
Information System (SP-IDC) enable port users to access
total logistics information that includes services and
functions of a single window, integrated function,
government and private enterprises collaboration, cargo
tracking system, maritime safety and security, radio
frequency identification (RFID), and mobile service by using smart phone (Lee and Lam, 2015).
IPA interprets the CTLs measures in the quadrant D as the possible overkill’, denoting an area of inefficiency where a remedial action of the cost-cutting decision is necessary.
But the interpretation should be made with cautions. Most PPIs in quadrant D represent intangible capabilities (i.e.
ITS3, ITS4, VAS2) which can be generally improved in terms of human resources and organisational capacities without committing the overkill of resources (Oh, 2001). To this end, these measures should be considered as the ‘keep up the good work’ rather then the ‘possible overkill’ in the context of port performance in CTLs. In addition, the ‘ceil effects’ of the measures’ importance have been effectively controlled.
The IPA matrix enables port managers in Busan Port to easily identify their strengths and weaknesses in terms of each individual CTLs measure. This can be identified from the results that the perceived performance by port users on the CTLs measures within the same dimension shows various dispersed patterns. For instance, the CTLs measures under the service reliability are both located in the quadrants A (i.e. SR1 and SR4) and B (i.e. SR2 and SR3). The CTLs measures under the intermodal transport systems are both located in the quadrants A (i.e. ITS1) and D (i.e. ITS2, ITS3, ITS4). The CTLs measures under the Value-added services are located in the quadrants A (i.e.
VAS1 and VAS2), C (i.e. VAS3) and D (i.e. VAS2). The CTLs measures under the information communication integration are both located in the quadrants A (i.e. ICI3) and B (i.e. ICI1, ICI2). The results can be used for Busan Port with a useful diagnostic instrument, which is capable of managing salient port stakeholders, taking into account their objectives and interests.
To address an effective stakeholder relations management in CTLs, Busan Port needs to trace the main determinants of the evolutionary patterns of its stakeholders’ needs due to the reorganizing of the stakeholder groups’ bargaining power. This can be achieved by receiving open-ended feedback from salient stakeholders and the port should adopt the feedback in developing its managerial decision-making process. Meantime, port users also proactively provide more feedback on what they have perceived against port services. This external influences and pressures exerted by salient stakeholders can stimulate Busan Port to pursue an effective stakeholder relations management based on collaboration principles with relevant
members in CTLs. The proposed IPA method provides port managers with a tool to monitor and diagnose readily their own situation in CTLs.
Fig. 2 IPA matrix: Busan Port
Table 3 Distribution of CTLs measures in IPMs
Quadrant in IPM PSQ measures
Quadrant A:
Concentrate here
Responsiveness to special requests (SR1) Incidence of delay (SR4)
Sea side connectivity (ITS1)
Facilities for adding value to cargoes (VAS1) Capacity to launch tailored services (VAS4) Collaborate with channel members (ICI3) Quadrant B: Keep
up the good work
Accuracy on documents & information (SR2) Incidence of cargo damage (SR3)
Integrated EDI for communication (ICI1) Integrated IT to share data (ICI2) Quadrant C:
Lower priority Handle different types of cargo (VAS3) Quadrant D:
Possible overkill
Land side connectivity (ITS2)
Reliability for multimodal operations (ITS3) Efficiency of multimodal operations (ITS4) Service adaptation to customers (VAS2)