ASSESSMENT OF METROPOLITAN SPECIAL MEASURES FOR ATMOSPHERIC ENVIRONMENT WITH SO
2AND PM
10TENDENCY IN SEOUL FROM 2000 TO 2007
Sunmin Park
1, Woo-kyun Lee
1, 2, Tae hyub Kwon
2, Kim Moon-Il
21. Department of environmental Science & Climate Change Affiliation, Korea University 2. Department of Environmental Science & Ecological Engineering, Korea University
Corresponding Author : [email protected]
[email protected], [email protected], [email protected]
ABSTRACT: Air pollutant, which generated by human-related activities such as vehicle running and industrial developments, has been socially and economically issued during the last few decades. Also air pollutants, which are impact on climate change, are becoming big issue since climate change has been issued all over the world. Among many different kinds of air pollutants, e.g., ozone, carbon oxide, nitrogen dioxide, sulfur dioxide and particular matter (PM), which give serious effects on human health, have been controlled by each country’s standard.
Especially, PM has been reported as a cause of asthma, atopy or bronchitis, and SO2 causes acid rain and negative influenced to a respiratory disease. For managing air pollutants, Seoul, which is the biggest metropolitan in Korea, legislated a law named Metropolitan Special measures for Atmospheric Environment in 2005. It is to control SO2
and PM. According to the national air pollutants emission report, SO2 and PM10 pollution level have increased, although the law was legislated and activated. The purpose of this study is to analyze pollution level trends of SO2
and PM using the interpolation method in Seoul. Also, based on the trends of pollution level, we assessed the Metropolitan Special measures for Atmospheric Environment. As results, SO2 and PM pollution level have seriously increased since 2005. Therefore, the Metropolitan Special measures for atmospheric environment was not efficient enough to improve the air quality of Seoul.
Key words: Air pollutant, SO2, particular matter, pollution level, Metropolitan Special measures for Atmospheric Environment
1. INTRODUCTION
Seoul, which is capital of South Korea, has grown rapidly in the past few decades. Related to this growth, various air pollutants have emitted to atmosphere.
Many research studied that air pollutants, especially SO2 and particular matter (PM10), are significantly harmful to human health. When respiring the PM, it strongly damages to the lung (Neidell, 2004). Also, long term concentration of PM is related to annual and daily mortality (Medina et al, 2004). SO2 is significantly harmful to respiration distress and can be cause of Sudden Infant Death Syndrome (Dales et al, 2010). Following these kinds of researches, analyzing air pollutants tendency and pattern are highly important
to make air quality policies and to care of human health.
In Korea, the capital area air quality has been declined since 1970 due to a lot of inhabitants in small area.
Also, this area is always crowed with massive buildings and huge place of business, which are source of air pollution. Ministry of Environment and governments of capital area made a measure, named Metropolitan Special measures for Atmospheric Environment, to control pollution level of SO2 and PM10 in 2005. The aim of the measure is to improve air quality same as advanced countries by 2014.
Nevertheless, capital area air quality is still declined.
The purpose of this paper is to show monthly tendency of SO2 and PM10 using interpolation method, which has
minimum error, from 2000 to 2007. Base on that result, moreover, we assess that the Metropolitan Special measures for Atmospheric Environment was suitable measure for Seoul.
2. MATERIALS 2.1 Study area
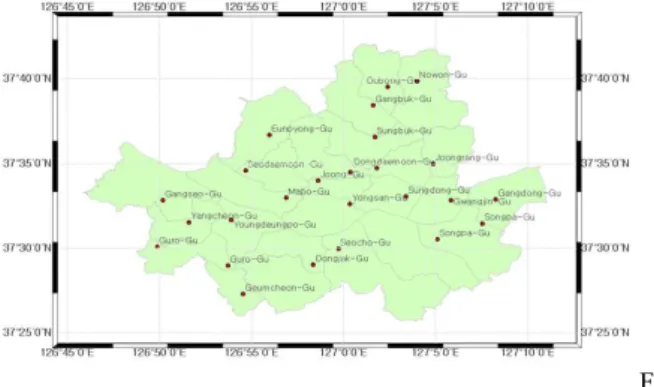
The study area is Seoul located in 126˚62′E ~ 127˚48′E and 37˚25′N ~ 37˚99′N (Figure 1). We employed Seoul, because the city is the capital of South Korea and one of the most densely-populated city in the world – approximately 14 million people and three million vehicles in 605Km2 (Kim et al. 1999). Han River, one of the largest rivers in South Korea, runs to the west sea as crossing the middle of Seoul.
2.2 Data
All ground data of the pollutant concentration were measured from air pollution monitoring stations (managed by National Institute of Environmental Research). We used 25 stations data (Figure 1), which are within Seoul, and 19 stations data, which are nearby Seoul, are for correction of edge effect from 2000 to 2007. SO2 was measured every five minutes, and product hourly mean data by stations. And PM10
was quantified every one hour (some of stations measure every five minutes).
Fi gure 1. 25 air pollution monitoring stations in Seoul
2.3 Methods
All data of 44 air pollutant stations were averaged hourly to daily, and daily to monthly data, respectively.
However, the measurement values from 44 stations were not enough to analyze the trend and change of SO2 and PM10. Therefore, the values of SO2 and PM10
were interpolated with Kriging, Natural neighbour, IDW methods and then valuses were compared with measured value with each point. In result, the value of IDW method showed minimum error.
3. RESULTS AND DISCUSSION 3.1. Results
3.1.1 Annual mean of SO2 and PM10
The lowest SO2 pollution level was shown in 2002 and the highest pollution level was shown in 2007 during 8 years. Between 2000 and 2001 the pollution level dramatically decreased, on the other hand from 2004 to 2007, the pollution level rapidly increased. Since 2004, SO2 the pollution level began to increase until recent year 2007 (Figure 2).
Figure 2. Annual mean of SO2 Figure 3. Annual mean of PM10
The lowest PM10 value was shown in 2005 and the highest PM10 value was shown in 2002 during 8 years.
Since 2002, the PM10 value had decreased dramatically until 2005, and then PM10 concentration had increased slightly from 2005 (Figure 3).
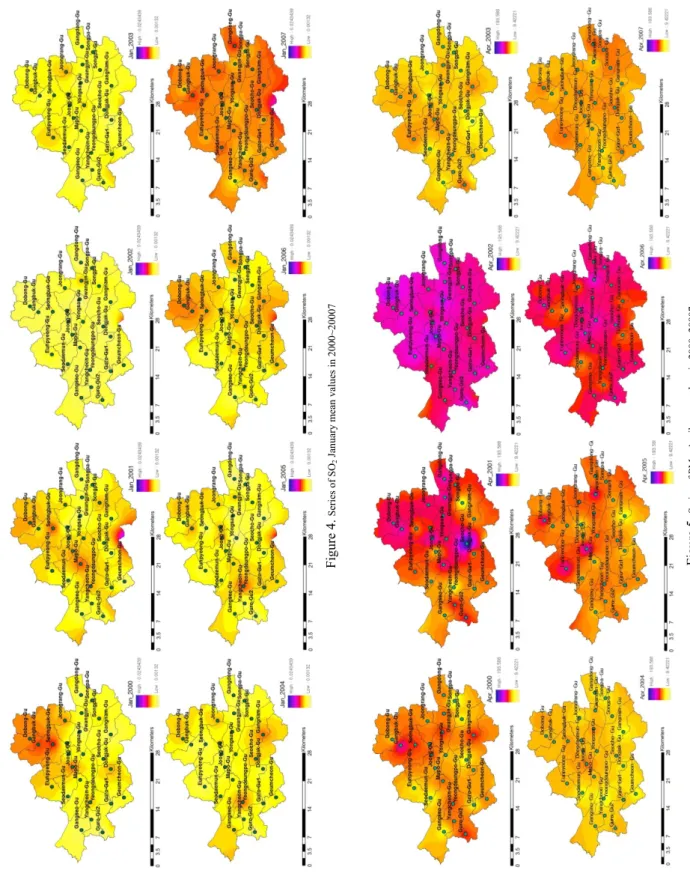
3.1.2 Monthly mean of SO2 and PM10
Monthly average of SO2 pollution is usually high in January. As shown below Figure 4, mean value of January decreased from 2000 to 2002, but increased slightly from 2003. Between 2006 and 2007, the average value of SO2 concentration became decreased in a sudden. Especially, it tells entire area of Seoul had a low air quality in 2007 refer to SO2. This trend of monthly mean level expresses similarly with annual average trend. In case of PM10, have a high pollution level in March, April and May. April have highest level in most years and the trend of annually time series shown as Figure 5. In 2002 and 2006, it appears very high level of PM10 and whole part of Seoul has serious conditions. In 2003, PM10 level decreased dramatically, but it increased again until 2006. The trend of monthly mean level of PM10 concentration was a little different with trend of annual average in terms of 2006 to 2007, but it also has a tendency of sigmoid curve.
3.2 Discussion
Base on the result as represented high air pollutant levels of this study, we possibly conclude the Metropolitan Special measures for Atmospheric Environment was not perfectly suitable to Seoul. After 2years of coming into effect the inconsistent special law from 2005, it just makes air quality of Seoul worse.
There are some amendments of Metropolitan Special measures for Atmospheric Environment in 2010. For expecting positive result of the law, policy makers should make a scrutiny into suitability of the law over again. Moreover the result of this study, in the cause of air quality improvement and detailed data collection, the air pollution monitoring stations should have set into “Dong” unit, beyond the city level.
4. CONCLUSIONS
This study has shown that SO2 and PM10 pollution level has been increased since 2005, which Metropolitan Special Measures for Atmospheric Environment was established. Therefore, the result provides that the Metropolitan Special Measures for Atmospheric Environment is not successfully progress.
The air quality policy makers need to consider more suitable measure for improving metropolitan air quality.
5. REFERENCES
Dales, R., Burnett, R.T., Smith-Doiron, M., Adm, D., Stieb D.M., Brook, J.R. 2010. Air Pollution and Sudden Infant Death Syndrome. Officail Journal of the American academy of padiatrics. 113, pp. e628-e631.
Kim, Y.P., Moon, K.C., Lee, J.H., Baik, N.J. 1999.
Concetration of carbonaceous species in particles at Seoul and Cheju in Korea. Atmospheric Environment.
33, pp. 2751-2758.
Medina S., Plasencia A., Ballester F., Mu¨cke H. G., Schwartz J., on behalf of the Apheis group. 2004.
Apheis: public health impact of PM10 in 19 European cities. J Epidemiol Community Health. 58, pp. 831–
836.
Neidell, M.J., 2004. Air pollution, health, and socio- economic status: the effect of outdoor air quality on childhood asthma. Journal of Health Economics. 23, pp.
1209–1236.
6. ACKNOWLEDGEMENTS
This research was supported by a grant from High tech Urban Development Program funded by Ministry of Land, Transportation and Maritime Affairs of Korean government.
Figure 4. Series of SO2 January mean values in 2000~20007 Figure 5. Series of PM10 April mean values in 2000~20007