Lee, In Soo*· ·Lee, Kyoo Seock **
GIS Graduate Program, Sungkyunkwan University*
Department of Landscape Architecture, Sungkyunkwan University**
GIS와 RS를 이용한 목현천 수질관리 정보체계
+이인수*·이규석**
성균관대 대학원 GIS과정*, 성균관대 조경학과**
Abstract
The purpose of this study is to develop a Water Quality Management System(WQMS), which calculates pollutant discharge and forecasts water quality with a water pollution model.
Operational water quality management requires not only controlling pollutants but acquiring and managing exact information.
A GIS software, ArcView 3.1 was used to enter or edit geographic data and attribute data, and Avenue Script was used to customize the user interface. PCI, a remote sensing software, was used to derive land cover classification from 20 m resolution SPOT data by image processing.
WQMS has two subsystems, database subsystem and modelling subsystem. The database subsystem consisted of watershed data from digital maps, remote sensing data, government reports, census data and so on. The modelling subsystem consisted of NSPLM(NonStorm Pollutant Load Model) and SPLM(Storm Pollutant Load Model). It calculates the amount of pollutant and predicts water quality. These two subsystems were connected through a graphic display module.
This system has been calibrated for and applied to Mokhyun Stream watershed.
Keyword : Water Quality Management System, Geographic Information Systems(GIS), Remote Sensing(RS)
+This research was supported by Faculty Research Fund, Sungkyunkwan University, 1998
요 약 문
본 연구의 목적은 지리정보시스템과 원격탐사를 이용하여 체계적이고 효율적인 수질 관리 자료기반을 구축하고, 유역의 오염부하를 산정하여 장래의 수질을 예측할 수 있는 수질관리시스템을 구축하는데 있다. 수질관리를 위해서는 오염물질의 최적처리 등의 기술적 측면뿐만 아니라 수질환경에 관한 정확한 정보의 취득과 관리가 필요하다.
본 연구에서는 지형 및 속성정보의 입력 및 편집을 위해 ArcView 3.1을 사용하였으 며, Avenue Script를 이용하여 사용자환경을 갖추도록 하였다. 또한, 토지피복분류를 위 하여 20m 해상도의 SPOT XS영상을 대상으로 PCI 소프트웨어를 이용하여 분석하였다.
수질관리시스템은 데이터베이스 보조시스템과 Modeling 보조시스템으로 구성된다. 데이 터베이스 보조시스템은 수치지형도에서 추출한 수치표고모델에서 분석한 유역분할도, 위 성영상자료, 정부보고서, 통계자료들로 구성되며, Modeling 보조시스템은 강우 시와 비강우 시의 유역의 오염부하량을 산정하고 수질예측을 하는 SPLM(Storm Pollutant Loading Model)과 NSPLM(Non-Storm Polutant Loading Model)으로 구성된다. 각각의 보조시스템 은 그래픽 출력 부분과 결합하여 분석결과 및 유역현황을 표시하도록 설계되었다.
개발된 수질관리 시스템은 경기도 광주군 광주읍에 위치한 목현천 유역을 대상으로 적용되고 수정되었다.
1. Introduction
Industrialization needs additional land for development, so agricultural fields, hilly terrain, riverside area have been changed for that purpose. This exploitation causes water resource shortage and water quality deteriora- tion. It is therefore required for municipalities to manage water resources based on land use management.
Water quality in rivers is determined by the amount of water, pollutant input, and land use patterns. Amount of pollutants is determined by pollutants of basin, physical·chemical·
biological processes during the inflow. For effective control of water quality, information about each pollutant source and influence of pollutants to water quality is required.
Especially amount of non-point source
pollutants is influenced by land use, topography, soil and so on.
For effective water quality management, technical methods, legal·executive restriction and exact information of water contamination are needed. It also requires various informa-tion such as physical environment, topography, water quality measurement, soil, meteorology, and so on. These data are huge in size and managed by several agencies independently. So, information system is required. GIS(Geographical Information Systems) and RS(Remote Sensing) are effective tools to enter, edit, store, retrieve, analyze and display information in establishing WQMS (Water Quality Management System) for Environmental Impact Assessment(EIA) according to the change of land use.
The purpose of this study is to establish the WQMS using GIS and RS. WQMS consists of database for stream management and
modeling for prediction of further water quality.
II. Study Method
1. Study Procedure
Fig. 1 shows the study procedure. After selecting a study site, data were collected and measured in the field, then the system was established. This system was applied and calibrated in the study site.
2. Study Site
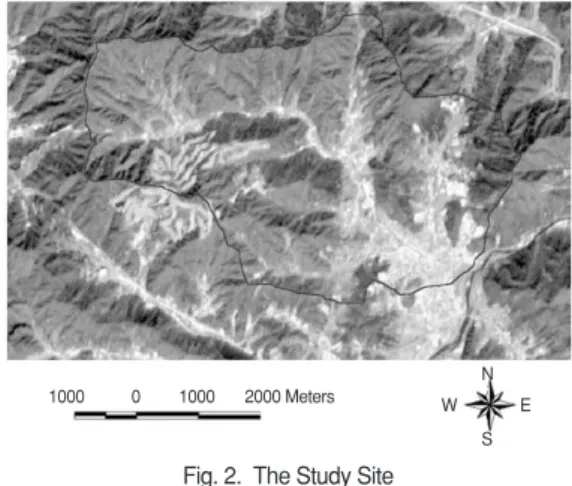
The study site is Mokhyun Stream watershed. Mokhyun Stream is located at Kwangju-eup, Kyunggi-do which is the lower part of Kyung-an stream. This stream flows into the Paldang Reservoir. The upper part of Mokhyun watershed is hilly terrain and has a golf course, while the lower part is urban area.
Total area of the site is 20.9 km
2. Figure 2 shows the study site.
3. Development of WQMS
WQMS consists of two subsystems which are database and model. Its data consists of geographic data and attribute data. Geographic data are digital topographic map, soil map, vegetation map, RS data and so on. These data are inputted into the database subsystem through the GIS/DB interface and image processing. Other attribute data are also inputted into the database.
Measured data are used to model subsystem via DB-Model interface. Model subsystem calculates the amount of pollutant according to weather conditions and predicts water quality.
Each subsystem is connected with Graphic Display Module(GDM) in order to show results. Fig. 3 shows the structure of WQMS.
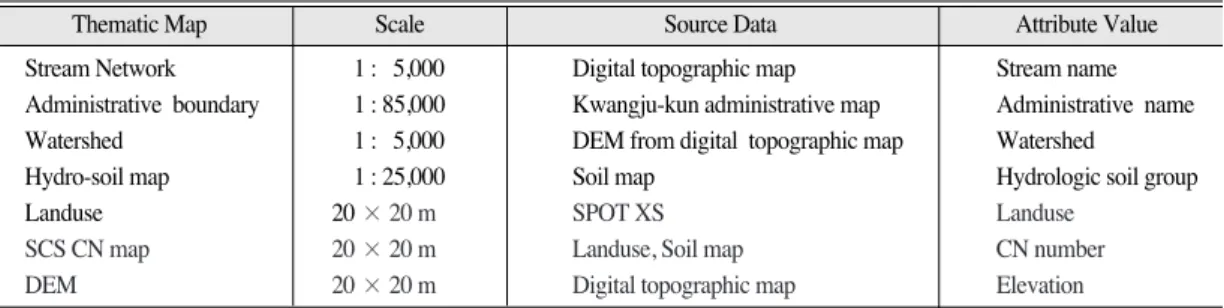
1) Data Acquisition and Database Construction In order to establish database, literature survey was performed. Field-surveying, and visiting many relevant agencies were also carried out, and finally water quality was analyzed. Table 1 shows thematic maps and Table 2 shows pollutant sources. Water quality
Fig. 1. Procedure Used in the Study
Determination of the Study Area Review of relevant study
Development of WQMS Database Construction
Development of calculating loading pollutants
To Establish and apply WQMS
Conclusions & Recommendations Data Collection
Fig. 2. The Study Site
1000 0 1000 2000 Meters
N
S
W E
data were collected from the Ministry of Environment and Kwangju-kun municipality office.
Water quality data used were BOD
5(5 day Biochemical Oxygen Demand), T-N (Total- Nitrogen), T-P (Total-Phosphate).
2) Development of Modeling Subsystem The Model subsystem consists of NSPLM
(Non-Storm Pollutant Loading Model) and SPLM(Storm Pollutant Loading Model) according to rainfall condition.
2)Constant discharge of pollutants occurs from point sources while weather-dependent discharge of pollutants occurs from non-point sources. So, water sampling was done on storm event during this study.
Fig. 3. Schematic Structure of WQMS
Table 1. Thematic Layer Thematic Map Scale Source Data Attribute Value
Stream Network 1 : 5,000 Digital topographic map Stream name
Administrative boundary 1 : 85,000 Kwangju-kun administrative map Administrative name
Watershed 1 : 5,000 DEM from digital topographic map Watershed
Hydro-soil map 1 : 25,000 Soil map Hydrologic soil group
Landuse 20 × 20 m SPOT XS Landuse
SCS CN map 20 × 20 m Landuse, Soil map CN number
DEM 20 × 20 m Digital topographic map Elevation
Thematic Map Scale Source Data Attribute Value
Collected Data
GIS D/B RS GIS D/B
Geographic Data topography, soil map
vegetation map etc.
Thematic Layer DEM, Landuse, etc.
NSPLM PLU, Roc
SPLM
SCS method, builup, wash-off Texture Database pollutant souyce, rainfall etc.
DB-Model Interface
Model Subsystem Image Data
SPOT etc.
Text and Census Data pollutant source, water quality, rainfall etc.
Graphic Display
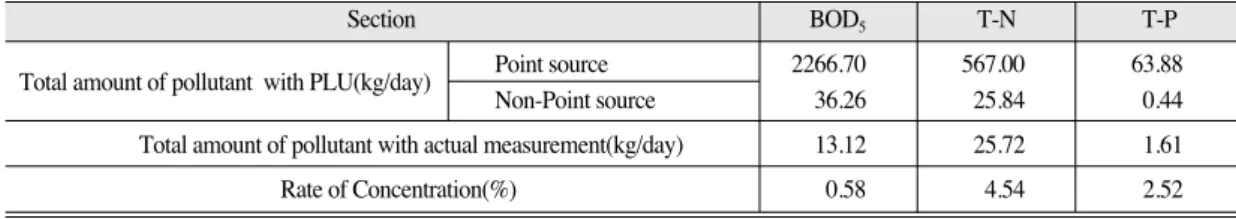
a) NSPLM(Non-Storm Pollutant Loading Model) To analyze water quality in dry weather pollutant loading unit and rate of concentra- tion were used. Pollutant load unit represents pollutants discharged by a unit of pollutant source during one day or one year.
16)Part of pollutants are discharged into watershed, treated and/or un-treated.
Amount of discharged pollutants occurred were unable to be measured actually. It is therefore universally accepted that amount of pollutant are calculated by pollutant loading unit.
9)Generally, derived pollutant decreased during the runoff. It can be explained with rate of concentration. It is the amount of arrival pollutants at the base point of disposal amount in watershed. Total amount of pollutants from actual measurements to total amount of pollutants from pollutant load factor is the rate of concentration. It can be used in predicting and calculating water quality.
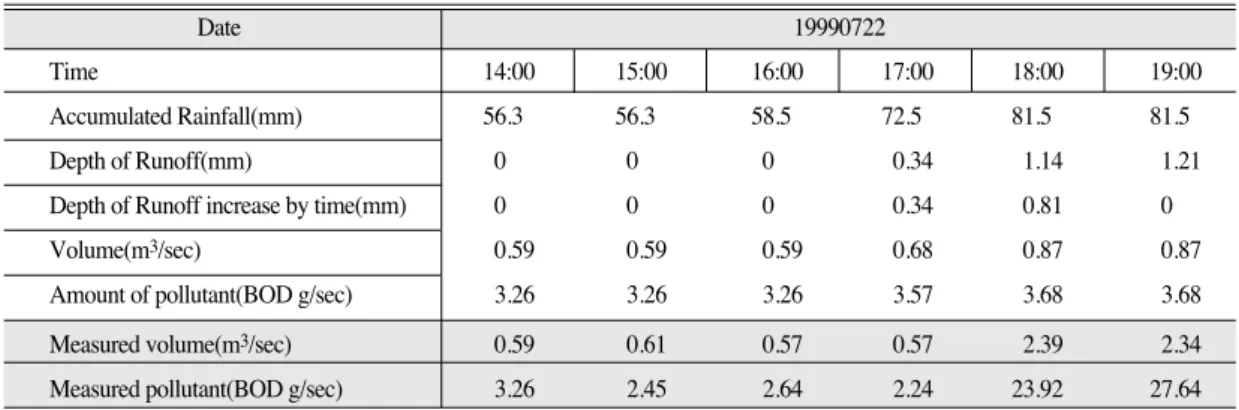
b) SPLM(Storm Pollutant Loading Model) SPLM consists of hydrological processes, calculating pollutants and determining runoff direction in each cell.
Water quality models are widely used in EIA. However, the study of basin property such as geo-hydrology, topography, soil, etc.,
and model coefficients are not sufficient.
Because existing models were developed in foreign countries, they are not calibrated to domestic conditions and determination of coefficients is difficult.
Hydrological process
Rainfall is affected by hydrological factors such as topography, soil, vegetation and so on.
Before landing on the surface, rainfall is intercepted by plants and animals and evapotranspirated. The portion of surface detention rainfall are infiltrated and others flow by surface runoff. Infiltrated water contributes to sub-surface runoff and ground runoff. Sum of surface runoff and sub-surface runoff is the direct runoff, and ground runoff is called base runoff.
Because runoff time is short and slope is steep, it was assumed that sub-surface runoff and evapotranspiration did not occur in this study.
Volumes of surface runoff was calculated according to the SCS Method. In this model,
Table 2. Pollutant Source Data
Division Details Year Source
Human being Population of sewage treatment or un-treatment 1998 Kwangju-kun municipality
Domestic Animals Cow and Pig 1998 Kwangju-kun municipality
Industrial discharge Factory and Sewage disposal plant 1998 Kwangju-kun municipality Landuse Forest, residential, cultivated field and golf course 1996 SPOT XS
Division Details Year Source
Rate of Concentration
Amount of arrival pollutants at base point (kg/day) Amount of Discharged pollutants in watershed (kg/day) Water quality (Kg/m
3) × Water volume(m
3/day) Amount of Discharged pollutants in watershed (kg/day)
=
=
... (Eq.1)
the relation of total rainfall and runoff volume is explained with equation 2.
Initial abstraction can be calculated by an empirical equation based on the field work.
14)Therefore.
where S (potential maximum retention after
runoff begins) represents the hydrologic land-
cover complexes such as landuse, soil condition and so on.
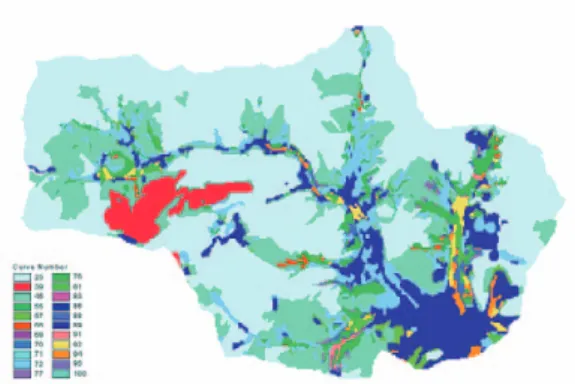
CN is the runoff curve number. It was determined by soil type and landuse.
The soil types between the two major determinants were classified into four groups according to the infiltration capacity.
The other determinant has an effect on interception and infiltration. The runoff curve numbers are experimentally determined with these two factors. Standards for CN determi- nation are shown in Table 4.
SCS AMC(Antecedent Moisture Condition) shows the soil moisture condition. Usually, it is classified into growing season and dormant season by P5(antecedent runoff amount 5 days).
Table 5 is applied in AMCII. CNs of grow- ing(AMCIII) and dominant(AMCI) seasons are calculated with equations 5 and 6.
Calculating of pollutant amount
To calculate pollutant loads, the concepts of buildup and washoff were used. It is also used in SWMM, STORM, HSPF and so on. Buildup has general meaning of accumulation, wind erosion etc,. That is, these processes bring a buildup of pollutants, and buildup pollutants
Table 3. Hydrologic soil group Soil Group Soil type Character
A sand, loamy sand, sand loam low runoff potential high infiltration rates
B silt loam, loam moderate infiltration rates
C sandy clay loam low infiltration rates
D clay loam, silty clay loam, sandy clay, clay high runoff potential very low infiltration rates source : Ferguson, Bruce. K., 1990, “On site stormwater management”, application for landscape and engineering 2nd ed., New
York, pp.19-54
Soil Group Soil type Character
Dr = (P - Ia)
2where, Dr = Depth of runoff(mm)
P = Depth of 24 - h rainfall(mm)
Ia = Initial abstraction, the losses of rainfall before runoff begins(mm)
S = potential maximum retention after runoff begins(mm)
... (Eq.2) (P - Ia) + S
Dr = (P - 0.2S)
2Ia = 0.2 S
(P + 0.8S
S = 25,400 - 254
CN ... (Eq.4)
AMCI = 4.2×AMCII
AMCIII= 23×AMCII
... (Eq.5)
... (Eq.6) 10 - 0.058×AMCII
10 + 0.13×AMCII
... (Eq.3)
are washed-off during storm event.
Power-Linear equation was used for this study. It is a exponential asymptote function, which is used in SWMM model.
Ma = ACCU × DT
awhere Ma : Amount of buildup at time t (kg) ACCU : Ratio of buildup(kg/day) DT : Dry days (day)
a : Numerical index
ACCU and Ke are dependent on urbaniza-