Introduction
Water stability of soil aggregate has been recognized as one of standard features of soil quality, because of relating to erosion, carbon dynamics, and material transport. Aggregation is a physical process of clustering constituents in soils, which is influenced by environmental and edaphic factors, including temperature, precipitation, soil texture, organic carbon, biota, and soil moisture content. Especially, the formation mechanism and stabilizing agents of aggregate are responsible for its fragmentation processes (Bronick and Ral, 2005).
Mclaren and Cameron (1996) summarized that soil aggregate formation requires followings: (i) the presence of soil colloids, (ii) flocculation of these colloids, (iii) micro-aggregation, (iv) macro-aggregation. They explained that, at the atomic or molecular level, charged colloid surface, organic molecule, cation, and water molecules bridge each other and flocculate. At the
microscopic level, clay and organic matter act as bridges between the sand and silt particles, producing microaggregates of soil. The soil microaggregates are bound together into macroaggregates by fungal hyphae, plant roots and other stabilizing agents at macroscopic level. Tisdall and Oades (1982) proposed the boundary between microaggregate and macroaggregate be 0.25 mm of aggregate diameter.
Agricultural cropland under upland condition is commonly under artificial stress of various management practices including tillage and traffic with agricultural machines, as well as natural stress such as rainfall. The stresses alter aggregate stability (Bronick and Lal, 2005).
Longer period of cultivating crops has generally been associated with aggregate breakdown and less organic carbon content (Carter, 2002; Six et al., 2004). In other words, it has been known that the effects of artificial management practices on aggregation are mainly shown in the macroaggregate dynamics (Kay, 1989).
The part of difficulty in the characterization of aggregation itself is that it depends on the method used for the purpose. Water stability of aggregate in Korea has been measured with wet-sieve analysis (Yoder, 1936)
Received : 26 April 2007 Accepted : 18 June 2007*Corresponding author: Phone : +822900271, E-mail : [email protected]
Stable Macro-aggregate in Wet Sieving and Soil Properties
Kyung-Hwa Han,
*Hyun-Jun Cho, Hyub-Sung Lee, Dong-Shig Oh, and Lee-Yul Kim National Institute of Agricultural Science and Technology, Suwon, 441-707
Soil aggregates, resulting from physico-chemical and biological interactions, are important to understand carbon dynamics and material transport in soils. The objective of this study is to investigate stable macro- aggregate (> 0.25mm diameter) in wet sieving (SM) and their relation to soil properties in 15 sites. The clay contents of soils were ranged from 1% to 33%, and their land uses included bare and cultivated lands of annual upland crops, orchard, and grass. Undisturbed 3 inch cores with five replicates were sampled at topsoil (i.e., 0- to 10-cm depth), for analyzing SM and physico-chemical properties, after in situ measurement of air permeability. SM of sandy soils, with clay content less than 2%, was observed as 0%.
Except the sandy soils, SM of soils mainly depended on land uses, showing 27%~35% in soils with annual plants such as vegetable and corn, 51% in orchard, and 75% in grass. This sequence of SM is probably due to the different strength of soil disturbance like tillage with different land uses. SM had significant correlation with cation exchange capacity, organic matter content, sand, clay, silt, bulk density, and exchangeable potassium (K) and magnesium (Mg), whereas fluctuating properties with fertilization such as pH, EC, and water soluble phosphorus weren't significantly correlated to the SM. Particularly, exchangeable calcium (Ca) had significant relation with SM, only except soils with oversaturating Ca. This study, therefore, suggested that SM could perceive different land uses and the change of soil properties in soils, necessarily considering soil textures and Ca over-saturation.
Key words : Water stable aggregate content, Land use, Soil texture
using 2-8 mm dry aggregates and a nest of sieves mesh openings of 2.0, 1.0, 0.5, 0.25, 0.1 mm respectively, which is described in NIAST (2000). More simple and easy method of aggregate stability has been required for more practicable application as soil parameter of changes in land management. Kemper (1966) and USDA (1998) used the contents of stable macro-aggregate (more than 0.25 mm diameter) using bulk air-dry soil less than 2 mm and one sieve mesh opening of 0.25 mm. In practical, bulk air-dry soil less than 2 mm has been commonly used for soil analysis such as pH, organic matter content, and particle size distribution. It has rarely been, however, studied for the relation between the contents of water stable aggregate more than 0.25 mm in soils and soil properties.
This study, therefore, was conducted to investigate stable macro-aggregate in wet sieving (SM) in soils and their relation to soil properties.
Materials and Methods
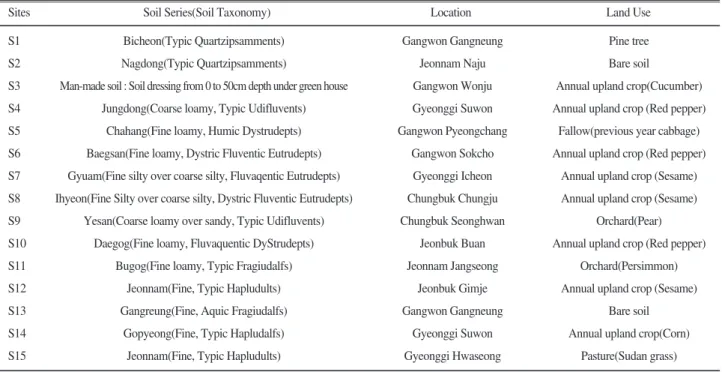
Soil sampling sites were selected as Table 1, including different soil textures and land uses except paddy rice field in Korea. Undisturbed 3inch cores with five replicates were sampled at the topsoil (i.e., 0 to 10 cm soil depth), of 15 upland sites from August to October in 2004. Air permeability at depth 0-10cm was measured with air permeameter (Daiki, Japan), in situ. After bulk density and water content were determined (Klute, 1986),
the soils were air-dried under shady condition without adding physical force, and then sieved with 10 mesh sieve. The air-dried samples (less than 2mm) used in measuring stable macro-aggregate in wet sieving, particle size distribution, organic matter content, cation exchange capacity, exchangeable cations, pH, and water soluble phosphate.
Aggregate stability in wet-sieving was used with Yoder's sieve shaker (Daiki, Japan). After 0.25mm sieve was set in the shaker, 10g soil put into the sieve and was saturated with water for five minutes. After up and down shaking for 10 minutes, the sieve with aggregate was dried and weighed. The sand correction was done with sieving, drying and weighing after dispersing the aggregate with 10mL of 5% sodium hexametaphosphate (Kemper and Koch, 1966; USDA, 1999). Stable macro- aggregate in wet sieving (SM) was calculated using following equation.
SM(% of soil > 0.25 mm)
= [(weight of dried aggregate - sand)/
(weight of dry soil - sand)] × 100
Particle size distribution was measured with pipette method, organic matter content with Tyurin method, exchangeable cation with 1N NH
4OAc extraction method, pH(H
2O, 1:5) with a pH meter(Orion, USA), EC(1:5) with a EC meter (EcoScan, Japan) as described in Sparks (1996). The analysis of cation exchange capacity of soil had the replacement with 1N NH
4OAc,
Sites Soil Series(Soil Taxonomy)
Bicheon(Typic Quartzipsamments) Nagdong(Typic Quartzipsamments)
Man-made soil : Soil dressing from 0 to 50cm depth under green house Jungdong(Coarse loamy, Typic Udifluvents)
Chahang(Fine loamy, Humic Dystrudepts) Baegsan(Fine loamy, Dystric Fluventic Eutrudepts) Gyuam(Fine silty over coarse silty, Fluvaqentic Eutrudepts) Ihyeon(Fine Silty over coarse silty, Dystric Fluventic Eutrudepts)
Yesan(Coarse loamy over sandy, Typic Udifluvents) Daegog(Fine loamy, Fluvaquentic DyStrudepts)
Bugog(Fine loamy, Typic Fragiudalfs) Jeonnam(Fine, Typic Hapludults) Gangreung(Fine, Aquic Fragiudalfs)
Gopyeong(Fine, Typic Hapludalfs) Jeonnam(Fine, Typic Hapludults) S1
S2 S3 S4 S5 S6 S7 S8 S9 S10 S11 S12 S13 S14 S15
Pine tree Bare soil
Annual upland crop(Cucumber) Annual upland crop (Red pepper)
Fallow(previous year cabbage) Annual upland crop (Red pepper)
Annual upland crop (Sesame) Annual upland crop (Sesame)
Orchard(Pear) Annual upland crop (Red pepper)
Orchard(Persimmon) Annual upland crop (Sesame)
Bare soil Annual upland crop(Corn)
Pasture(Sudan grass) Gangwon Gangneung
Jeonnam Naju Gangwon Wonju Gyeonggi Suwon Gangwon Pyeongchang
Gangwon Sokcho Gyeonggi Icheon Chungbuk Chungju Chungbuk Seonghwan
Jeonbuk Buan Jeonnam Jangseong
Jeonbuk Gimje Gangwon Gangneung
Gyeonggi Suwon Gyeonggi Hwaseong
Land Use Location
Table 1. Site descriptions of sampled soil.
washing with ethanol, and determination of NH
4+-N using distillation in alkali condition (Sparks, 1996). Water soluble phosphate were extracted with 5g soil to 50mL 0.01M CaCl
2solution (Sparks, 1996), and then phosphate-P in the extraction was measured with ICP (GBC, Australia).
Statistical analysis in this study used GLM and Duncan's multiple range test in SAS statistical software.
Differences were determined by using least squared means(LSMEANS) with differences in the P<0.05 significance lever (SAS institute and Inc., 2004).
Results and discussion
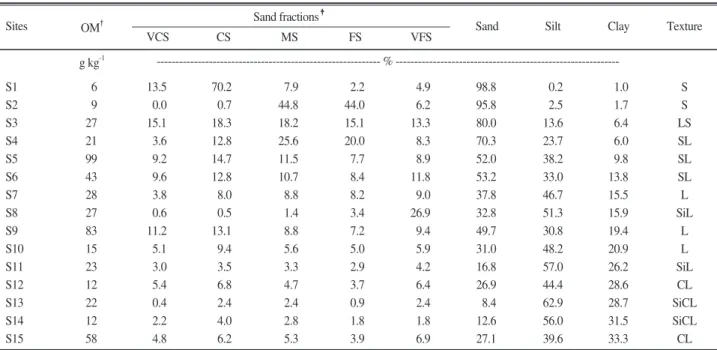
Clay content of soil samples used in this study showed from 1% to 33%, and their soil textures distributed from sand to clay loam (Table 2). Organic matter content,
Sites
"
BD: Bulk density; TPS: Total pore space; Vs: Volume ratio of solid phase; Vw: Volume ratio of liquid phase; Va: Volume ratio of gaseous phase; AP:
Air permeability.
S1 S2 S3 S4 S5 S6 S7 S8 S9 S10 S11 S12 S13 S14 S15
1.53 1.29 1.15 1.17 1.05 1.28 1.17 1.32 1.16 1.35 1.40 1.51 1.30 1.17 1.10
42.3 51.3 56.6 55.9 60.3 51.7 55.9 50.2 56.2 49.1 47.1 43.0 51.1 55.9 58.5
57.7 48.7 43.4 44.1 39.7 48.3 44.1 49.8 43.8 50.9 52.9 57.0 48.9 44.1 41.5
8.3 22.9 15.5 30.3 35.3 39.6 30.3 39.6 41.1 26.0 26.0 36.0 41.1 30.3 34.0
34.0 28.4 41.1 25.5 25.0 12.1 25.5 10.6 15.1 23.2 21.1 7.0 9.9 25.5 24.5
3.0 0.3 3.0 1.6 1.1 0.2 1.3 0.9 1.9 1.0 4.0 0.1 0.0 0.8 47.2 AP cm s-1 Va
Vw Vs
TPS BD
Mg m-3 --- % --- Table 3. Soil physical properties""of soils used.
Sites
"
OM: Organic matter content.
‡VCS: Very coarse sand; CS: Coarse sand; MS: Medium sand; FS: Fine sand; VFS: Very fine sand.
S1 S2 S3 S4 S5 S6 S7 S8 S9 S10 S11 S12 S13 S14 S15
6 9 27 21 99 43 28 27 83 15 23 12 22 12 58
13.5 0.0 15.1 3.6 9.2 9.6 3.8 0.6 11.2 5.1 3.0 5.4 0.4 2.2 4.8
70.2 0.7 18.3 12.8 14.7 12.8 8.0 0.5 13.1 9.4 3.5 6.8 2.4 4.0 6.2
7.9 44.8 18.2 25.6 11.5 10.7 8.8 1.4 8.8 5.6 3.3 4.7 2.4 2.8 5.3
2.2 44.0 15.1 20.0 7.7 8.4 8.2 3.4 7.2 5.0 2.9 3.7 0.9 1.8 3.9
4.9 6.2 13.3 8.3 8.9 11.8 9.0 26.9 9.4 5.9 4.2 6.4 2.4 1.8 6.9
98.8 95.8 80.0 70.3 52.0 53.2 37.8 32.8 49.7 31.0 16.8 26.9 8.4 12.6 27.1
0.2 2.5 13.6 23.7 38.2 33.0 46.7 51.3 30.8 48.2 57.0 44.4 62.9 56.0 39.6
1.0 1.7 6.4 6.0 9.8 13.8 15.5 15.9 19.4 20.9 26.2 28.6 28.7 31.5 33.3
S S LS SL SL SL L SiL
L L SiL CL SiCL SiCL CL Texture Clay
Silt VFS Sand
FS MS
CS
Sand fractions‡ VCS
--- % --- g kg-1
OM"
Table 2. Soil particle distribution and organic matter content of soil samples used.
having a range of 6~99 g kg
-1, tend to have dependency on land use type in soils with clay content more than about 10%, relatively high in orchards and grass compared to vegetable and bare soils. Exceptionally, high organic matter content, 99 g kg
-1, of S5 results from climate condition of low temperature, because the sampling site belongs to alpine region more than 600 meters above sea level. In case of sand, very low clay content less than 2% probably resulted in low organic matter content less than 10 g kg
-1. S1, coarse sand, showed the highest bulk density but relatively high air permeability. Clay loam soils, however, highest air permeability with lowest bulk density (Table 3). S3, green house soils, had high electrical conductivity, exchangeable cation, and water soluble P (Table 4). High
salt content in vegetable cultivated soil, i.e. S3, S8, and S10, resulted in base saturation more than 100%. In addition, Ca saturations in S8 and S10 were more than 100%. This is probably due to applying relatively a lot of agro-materials such as fertilizer in vegetable cultivation practices. The S9, S11, and S14 had high water soluble P, presumably with compost application in orchard and grass.
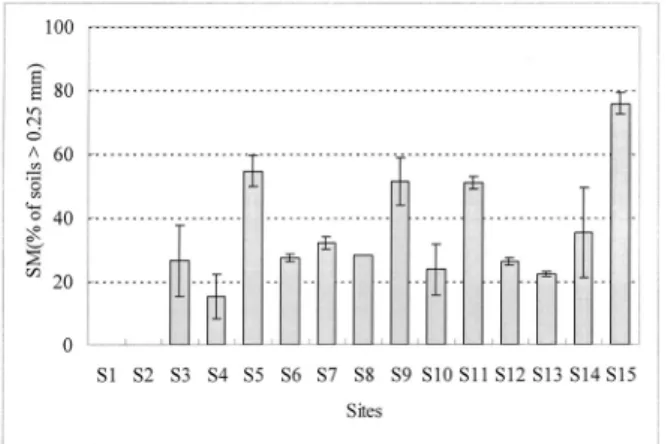
The contents of stable macro-aggregate in wet sieving (SM) were shown in Figure 1. S1 and S2 with very low clay content, less than 2%, had about 0% of SM, which is probably due to little soil colloid to require for soil aggregate formation (Mclaren and Cameron, 1996). Soils with annual upland crops had SM of 27~35%. Orchard soils, S9 and S11, had about 51% of SM. S5 of alpine soil had SM slightly more than orchard soil. S15 with clay loam and growing grass had highest SM of 75%. In case of S13, bare soil with few plant, its SM was 22%, in spite of its high clay content, S3 of greenhouse soil with loamy sand had similar SM with vegetable-cultivated soil. The results showed that stable macro-aggregate in wet-sieving need colloidal clay and that mainly depend on land uses in soils with some clay content.
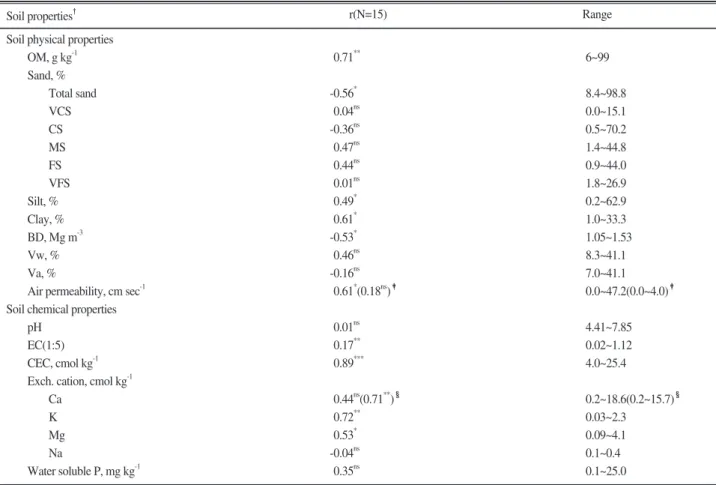
Clay, Silt, and Sand, determining soil textures, had significant correlation with SM (Table 5), which was clay and silt with positive relation but sand with negative relation. SM was positively correlated with cation exchange capacity, organic matter content, clay, silt, and exchangeable K and Mg as reported in Hyun et al.
Sites
"
CEC: Cation exchange capacity S1
S2 S3 S4 S5 S6 S7 S8 S9 S10 S11 S12 S13 S14 S15
0.7 0.1 24.9 18.3 1.4 6.4 1.0 2.1 25.0 7.7 11.1 1.3 0.3 0.5 16.0 6
60 105 76 22 56 47 120 84 178 71 67 40 57 77 3
43 65 49 17 37 28 103 62 143 51 42 30 40 49 7.8
4.0 12.1 10.0 21.6 15.4 11.6 12.0 25.4 13.0 15.8 14.2 15.0 13.2 23.2 0.10
0.11 0.42 0.18 0.10 0.19 0.22 0.10 0.14 0.14 0.12 0.18 0.30 0.20 0.17 0.09
0.47 3.18 1.50 0.37 1.60 1.10 1.63 4.02 3.64 1.95 2.69 1.00 1.70 4.05 0.03
0.09 1.25 1.05 0.57 1.17 0.78 0.29 1.43 0.79 1.04 0.77 0.27 0.36 2.30 0.2
1.7 7.8 4.9 .7 5.7 3.3 12.3 15.7 18.6 8.0 5.9 4.5 5.3 11.3 0.03
0.02 1.12 0.17 0.10 0.05 0.61 0.11 0.34 0.25 0.12 0.15 0.11 0.17 0.36 6.0
6.2 6.5 6.6 5.4 5.2 4.4 7.8 6.6 7.9 6.6 5.5 5.9 5.1 6.5
Water soluble P Base
Saturation Ca
Saturation CEC"
Na Mg
K Ca
Exchangeable Cations EC
(1:5)
--- cmolckg-1---
dS m-1 --- % --- mg kg-1
pH (1:5, H2O)
Table 4. Soil chemical properties of soils used.
Fig. 1. The contents of stable macro-aggregate in wet sieving (SM) in soil samples used. Vertical bars mean standard deviation.
(2007), but did not have significant relation with exchangeable Ca. Table 4 showed Ca oversaturation in S8 and S10, probably due to lime application. Except S8 and S10, correlation analysis with the other 13 soil samples between SM and exchangeable Ca resulted in significant correlation. In case of air permeability, maximum value, 47.2 cm sec
-1had large difference with secondary maximum value, 4.0 cm sec
-1. Except maximum value, air permeability did not have significant relation with SM (Table 5). pH, EC, and water soluble phosphorus, fluctuating properties with fertilization, had no significant relation with SM. The relation between SM and soil physical properties was different with different soil textures. SM and air permeability was positively related in clay loam, weakly positively in loam, but did not in sandy loam. In case of bulk density, the correlation with SM was observed only in clay loam.
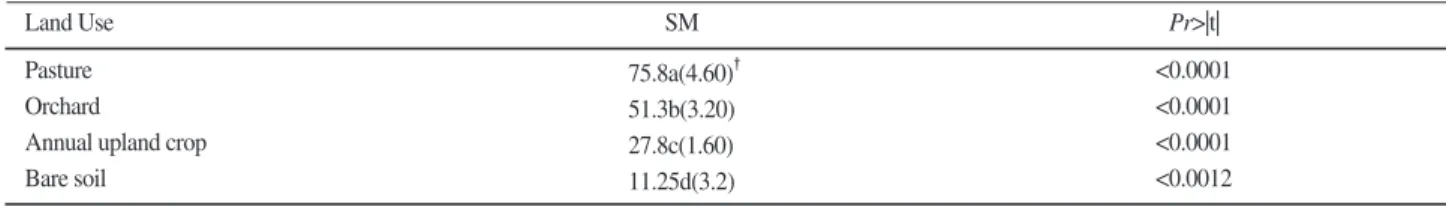
In view of land use, SM was highest in grass (S15) and decreased in the order of orchard (S9, S11), annual
upland crops. The significant differences between land uses were shown in Table 6. This is presumably in reverse order of cultivating intensity such as tillage. It has been reported that stable macro-aggregate in wet sieving of tilled soils is lower than that of no-tilled soils (Pagliai et al., 2004; Greenland, 1981; Kay, 1989; Dalal and Bridge, 1996), due to aggregate breakdown in tillage process. WSA of bare soils with little impact of human, however, was lower than upland crop-cultivated soil.
Actually, organic amendments like compost in cultivating practices have been associated with the increase of aggregate stability (Pagliai et al., 2004). This indicated that the cultivation of bare soil with few plant could enhance soil aggregation. In soils with annual upland crops, significant differences of SM between different groups of textures were not shown (Table 7). Actually, cultivation practices of annual upland crops is very diverse, including different crops, mulching, and fertilization. That means that SM could not discriminate
Range r(N=15)
Soil properties"
"
CEC: Cation exchange capacity; OM: Organic matter content; VCS: Very coarse sand; CS: Coarse sand; MS: Medium sand; FS: Fine sand; VFS: Very fine sand; BD: Bulk density; Vw: Volume ratio of liquid phase; Va: Volume ratio of gaseous phase; ns: not significant at P<0.05.
‡Parenthesis indicates correlation analysis using the others (N=14) except the maximum value.
Parenthesis indicates correlation analysis using the others (N=13) except soil samples with Ca oversaturation (S8, S10) Soil physical properties
OM, g kg-1 Sand, %
Total sand VCS CS MS FS VFS Silt, % Clay, % BD, Mg m-3 Vw, % Va, %
Air permeability, cm sec-1 Soil chemical properties
pH EC(1:5) CEC, cmol kg-1 Exch. cation, cmol kg-1
Ca K Mg Na
Water soluble P, mg kg-1
0.71**
-0.56* 0.04ns -0.36ns 0.47ns 0.44ns 0.01ns 0.49* 0.61* -0.53* 0.46ns -0.16ns
0.61*(0.18ns)‡
0.01ns 0.17**
0.89***
0.44ns(0.71**) 0.72**
0.53* -0.04ns 0.35ns
6~99
8.4~98.8 0.0~15.1 0.5~70.2 1.4~44.8 0.9~44.0 1.8~26.9 0.2~62.9 1.0~33.3 1.05~1.53 8.3~41.1 7.0~41.1 0.0~47.2(0.0~4.0)‡
4.41~7.85 0.02~1.12 4.0~25.4
0.2~18.6(0.2~15.7) 0.03~2.3 0.09~4.1 0.1~0.4 0.1~25.0
Table 5. Correlation coefficient (r) between stable macro-aggregate in wet sieving content and soil physico-chemical properties in soil samples used.
the effect of texture from mixed effect of crops, climate, textures, and artificial management practices. The little SM of sand texture (S1 and S2), however, indicates the importance of colloidal clay for soil aggregate formation.
This study, therefore, suggested that SM could perceive different land uses and the change of soil properties in soils, necessarily considering soil textures and Ca over- saturation.
References
Bronick, C. J. and R. Lal. 2005. Soil structure and management: a review. Geoderma 124: 3-22.
Cater, M. R. 2002. Soil quality for sustainable land management:
Organic matter and aggregation interactions that maintain soil functions. Agron. J. 94:38-47.
Dalal, R. C., and B. J. Bridge. 1996. Aggregation and organic matter storage in sub-humid and semi-arid soils. In: Carter, M. R., and B.
A. Stewart, Structure and Orgainc Matter Storage in Agricultural Soils. CRC Press, Boca Raton, FL, pp. 263-307.
Greenland, D. J. 1981. Soil management and soil degradation. J.
Soil Sci. 32:301-148.
Hyun, B. K., S. J. Jung, K. C. Song, Y. K. Sonn, and W. K. Jung.
2007. Relationship between soil water-stable aggregate and physico-chemical soil properties. Korean J. Soil Sci. Fert. 40(1):
57-63.
Kay, B. D. 1989. Rates of change of soil structure different cropping
system. Adv. Soil Sci. 12: 1-52.
Kemper, W. D., and E. J. Koch. 1966. Aggregate stability of soils form the western portions of the United States and Canada. U. S.
Dep. Agric. Tech. Bull. 1355.
Klute, A. 1986. Method of soil analysis. part 1. Physical and mineralogical methods, 2nd edn. ASA and SSSA, Madison, WI.
McLaren, R. G. and K. C. Cameron. 1996. Soil Science. 2nd edition. Oxford University Press.
NIAST. 2000. Method of soil and plant analysis. Published by National Institute of Agricultural Science & Technology. Suwon, Korea.
Pagliai, M., N. Vignozzi, S. Pellegrini. 2004. Soil structure and the effect of management practices. Soil & Tillage Research 79:131- 143.
SAS Institute Inc. 2004. SAS Enterprid. SAS Institute Inc., Cary, NC, USA.
Six, J., H. Bossuyt, S. Degryze, and K. Denef. 2004. A history of research on the link between (micro)aggregates, soil biota, and soil organic matter dynamics. Soil & Tillage Research 79:7-31.
Sparks, D. L. 1996. Method of soil analysis. part 3. Chemical methods, 3rd edn. ASA and SSSA, Madison, WI.
Tisdall, J. M. and J. M. Oades. 1982. Organic matter and water- stable aggregates. J. Soil Sci. 62:141-163.
USDA. 1999. Soil quality test kit guide. USDA-ARS, Washington, DC, USA.
Yoder, R. E. 1936. A direct method of aggregate analysis of soils and a study of the physical nature of erosion losses. J. Am. Soc.
Agron. 28: 337-351.
Land Use
"
Figures with a row with the same letter are statistically similar(P=0.05), Numbers in parentheses are standard error.
Pasture Orchard
Annual upland crop Bare soil
75.8a(4.60)"
51.3b(3.20) 27.8c(1.60) 11.25d(3.2)
<0.0001
<0.0001
<0.0001
<0.0012 Pr>|t|
SM
Table 6. Stable macro-aggregate in wet sieving (SM) of soils as affected by different land uses.
Texture group‡
"
Figures with a row with the same letter are statistically similar(P=0.05), Numbers in parentheses are standard error.
‡The each group of textures includes USDA textural classes as followings; Fine: clay loam, silt clay loam; Medium: loam, silt loam; Coarse: sandy loam, loamy sand.
Fine Medium Coarse
30.75a(3.12)"
27.88a(2.56) 25.69a(2.56)
<0.0001
<0.0001
<0.0001 Pr>|t|
SM
Table 7. Stable macro-aggregate in wet sieving (SM) of soils with cultivating annual upland crops as affected by different groups of textures.
토양입단은 물리화학, 생물학적 인자의 종합적 결과로 토양 중 탄소행동과 물질이동 해석에 중요하다. 본 연구 에서는 습식체별에 안정한 대입단(>지름 0.25mm)과 토양특성과의 관계를 15개 토양을 대상으로 살펴보았다.
토양은 먼저 깊이 0-10cm에서 통기성을 현장측정한 후 3인치 코아 5반복으로 채취하여 습식체별에 안정한 대 입단과 토양이화학성을 분석하였다. 대상토양의 점토함량은 1~33%범위였고 토지이용은 과수, 일년생 밭작물 (채소, 옥수수), 초지를 비롯하여 도로변 나지 등이었다. 습식체별에 안정한 대입단은 점토함량 2%이하의 사토 에서 함량이 0%로 낮고, 사토를 제외한 토양에서 일년생 작물을 재배하는 밭이 27~35%, 과수원 51%, 초지 75%의 순으로 나타났다. 이는 경운 등의 토양교란정도와 연관이 깊은 것으로 보인다. 습식체별에 안정한 대입 단은 양이온치환용량, 유기물함량, 모래, 점토, 미사, 용적밀도, 그리고 교환성 K, Mg와 유의한 상관을 나타내었 으나 pH, EC 및 수용성 인 등의 토양특성은 상관이 유의하지 않았다. 특히 교환성 칼슘의 경우, 칼슘 과포화 토양을 제외하였을 때 내수성입단함량과 유의한 상관을 보였다. 따라서, 본 연구는 습식체별에 안정한 대입단 은 토지이용과 토양특성을 반영하나 칼슘 과포화도 및 토성간의 차이를 고려해서 파악해야 함을 제안한다 하 겠다.
습식체별에 안정한 대입단과 토양특성과의 관계
한경화*·조현준·이협성·오동식·김이열 농촌진흥청 농업과학기술원