Soil Organic Carbon of Soil Series from 2003 to 2010 in Korea
Yoo Hak Kim*, Seong Soo Kang, Myung Sook Kim, Myung Suk Kong, Soon Kun Choi, and Taek Keun Oh
Division of Soil and Fertilizer, NAAS, RDA, Suwon, 441-707, Korea (Received: November 15 2013, Accepted: December 5 2013)
Soil organic carbon (SOC) of soil series is necessary to calculate soil C sequestration due to IPCC default categorized by climate regions and by soil types. The 3,400 thousand data were downloaded from agricultural soil information system and analyzed to get averages of soil order, soil series, and textual family for the three different soil management practices in Korea. The SOC content was 13.3±5.38 g kg-1 in paddy field, 13.7±7.19 g kg-1 in upland field, and 15.2±8.22 g kg-1 in orchard soil, respectively. As SOC in orchard was 10% greater than that in upland, orchard must be managed with applying compost. The SOCs of inceptisols, which was largely distributed in Korea, were 13.6±5.48 g kg-1 in paddy field, 14.1±7.38 g kg-1 in upland field, and 15.3±8.20 g kg-1 in orchard soil, respectively. The SOCs of alfisols were 13.6±4.96 g kg-1 in paddy field, 13.7±6.99 g kg-1 in upland field, and 15.6±8.59 g kg-1 in orchard soil, respectively. The SOCs of entisols were 11.7±5.16 g kg-1 in paddy field, 12.8±7.05 g kg-1 in upland field, and 13.7±7.81 g kg-1 in orchard soil, respectively. The SOCs of ultisols were 12.7±4.79 g kg-1 in paddy field, 12.7±6.22 g kg-1 in upland field, and 16.3±8.49 g kg-1 in orchard soil, respectively. The fact that soils containing greater clay content in textual family had also more SOC content revealed that SOC could be also dependent on some soil properties as well as soil order. Because SOC differences among soil series representing same textual family were greater than those among textual family, SOC differences should be mainly affected by management practices such as compost application.
Key words: Soil organic carbon (SOC), Soil order, Soil series, Textual family SOC contents of soil order categorized by management practices
Soil order Paddy soil Upland soil Orchard soil
SOC (g kg-1) Samples SOC (g kg-1) Samples SOC (g kg-1) Samples
Alfisols 13.6±4.96 195,946 13.7±6.99 88,514 15.6±8.59 37,242
Entisols 11.7±5.16 171,568 12.8±7.05 50,379 13.7±7.81 17,748
Histosols 17.5±10.00 1,274 - - - -
Inceptisols 13.6±5.48 1,670,615 14.1±7.38 478,150 15.3±8.20 205,966
Mollisols - - 16.6±8.24 4,514 16.1±8.37 368
Ultisols 12.7±4.79 30,463 12.7±6.22 86,991 16.3±8.49 23,184
All soils 13.3±5.38 2,071,822 13.7±7.19 708,548 15.2±8.22 284,508
1)
*Corresponding author : Phone: +82312900328, Fax: +82312900208, E-mail: [email protected]
§Acknowledgement: This study was supported financially by a grant from the research project (No. PJ009348) of National Academy of Agricultural Science, RDA, Korea.
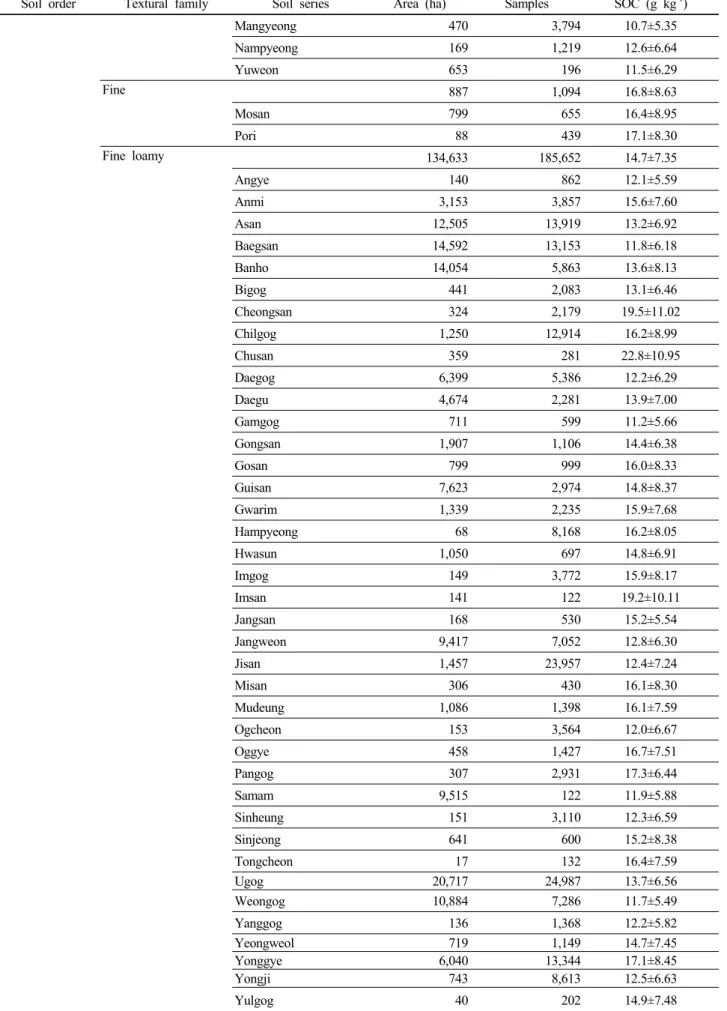
(a) (b) Fig. 1. Frequency patterns of (a) all the soils and (b) gagok series.
Introduction
대기 중의 CO2 농도는 화석연료의 사용과 경작에 따른 토양에 축적된 유기탄소 (SOC)의 분해로 증가하여 온도상 승에 따른 기후변화에 영향을 주는 것으로 알려져 있고, 토 양에 축적된 SOC의 분해는 농경지 관리체계에 따라 변하는 정도가 결정된다 (Paustian et al., 1997; Bruce et al., 1999;
Ogle et al., 2005; IPCC, 2006). 세계 각국에서는 기후변화 에 영향을 미치는 대기 중의 CO2의 양을 줄이기 위하여 Intergovernmental Panel on Climate Change (IPCC)와 같 은 범국가적인 협의체를 만들어 공동으로 대응하고 있다.
IPCC (2006)에서는 토양탄소 흡수·배출원의 기본계수를 각 종 기상과 토양요인 및 관리방법과 관련된 변수에 따른 조 견표를 제시하여 자료가 없을 경우에 기본계수를 활용하도 록 하고 있지만, 각국의 실정에 맞는 계수를 설정하고 나아 가 토양탄소에 대한 모델을 설정하여 산정하도록 권장하고 있다. 토양의 특성에 따라 탄소저장능력이 달라지는 것을 다 음과 같이 기후대별 토양형에 따른 SOC 기본계수 (SOCREF) 로 설정하였는데 토양형은 점토광물에 따라 high activity clay (HAC)와 low activity clay (LAC), 점토 8%미만이면서 모래가 70%이상인 Sandy soils, 강한 포드졸화 작용을 받은 Spodic soils, Volcanic soil, 그리고 토양분류상 Aquic 아목 의 Wetland soils로 구분하여 제시하고 있다. 또한 토양의 점토광물 종류가 1:1형이면 LAC이고 2:1형일 경우에는 토양 분류단위의 목 (soil order)을 기준으로 HAC와 LAC로 구분 하고 있다. 우리나라 토양에 대한 최소분류단위인 토양통별 SOC 산정은 토양통의 여러 가지 속성에 따른 유기탄소의 변화를 지목별로 구분할 수 있게 한다. 본 연구는 토양환경 정보시스템인 ‘흙토람’의 토양검정 데이터베이스 (DB)에 입 력되어 있는 토양검정자료를 바탕으로 토양통에 따른 SOC 의 분포를 파악하여 토양목과 토양속성에 대한 영향을 검토 하는데 그 목적이 있다.
Materials and Methods
SOC 자료 농업환경정보시스템 (흙토람)의 토양비옥도 DB는 농경지의 토양도 자료와 토양검정자료로 이루어져 있 다. 토양검정자료 중의 토양유기물은 표토의 총 탄소를 분 석하여 1.724를 곱한 값이다 (NAAS, 2010). 흙토람의 토양 검정 DB를 다운로드하여 분석에 대한 정도관리가 실시된 2003년부터 2010년까지의 논, 밭, 과수 토양에 대한 340만 점의 자료를 취하여 분석에 이용하였다.
토양통 선정 한가지 토양통의 SOC함량에 대한 도수분 포를 보면 토양분석 점수가 100점 이상인 경우에 Fig. 1과 같이 정규분포를 나타내는 것으로 나타났다. 본 연구에서는 Fig. 1의 결과를 바탕으로 지목별로 분포면적이 10 ha이상 이고 토양분석점수가 100점 이상인 토양통을 대상으로 분 석하였다. 토양분석 점수가 100점 미만인 토양통은 분포면 적이 적은 원인도 있었지만, 정규분포를 나타내지 않아 포 함하지 않았다.
자료분석 토양통별 SOC의 평균과 표준편차를 토지이 용형태별로 구하였다. 토양통의 면적은 한국의 토양분류 및 해설 (NAAS, 2011) 자료를 이용하였으며, 토양통과 관련된 여러 가지 속성 중에서 SOC함량에 영향을 주는 속성과 토 양분류와 관련이 있는 속성에 대하여 토지이용 형태별로 구 하였다.
Results and Discussion
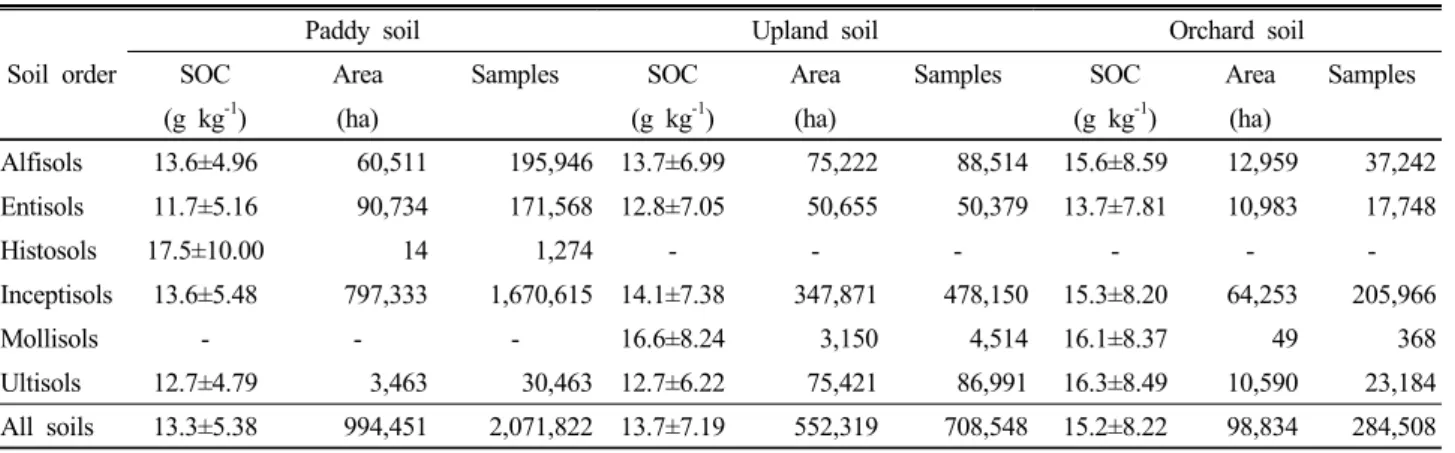
토양목별 SOC 분포 토양검정자료를 토양관리방법별 로 구분하여 토양목의 평균 SOC함량을 구한 결과는 Table 1 과 같았다. Table 1에서와 같이 논 토양은 994,451 ha에서 2,071,822점이 분석되어 0.48 ha에서 1점을 분석한 것으로 나타났다. 토양분류의 Inceptisols 목에 해당되는 토양통은 논 전체면적의 80% (797,333 ha)로 가장 넓게 분포하고 있
Table 1. SOC contents of soil order categorized by management practices.
Soil order
Paddy soil Upland soil Orchard soil
SOC Area Samples SOC Area Samples SOC Area Samples
(g kg-1) (ha) (g kg-1) (ha) (g kg-1) (ha)
Alfisols 13.6±4.96 60,511 195,946 13.7±6.99 75,222 88,514 15.6±8.59 12,959 37,242 Entisols 11.7±5.16 90,734 171,568 12.8±7.05 50,655 50,379 13.7±7.81 10,983 17,748
Histosols 17.5±10.00 14 1,274 - - - - - -
Inceptisols 13.6±5.48 797,333 1,670,615 14.1±7.38 347,871 478,150 15.3±8.20 64,253 205,966
Mollisols - - - 16.6±8.24 3,150 4,514 16.1±8.37 49 368
Ultisols 12.7±4.79 3,463 30,463 12.7±6.22 75,421 86,991 16.3±8.49 10,590 23,184 All soils 13.3±5.38 994,451 2,071,822 13.7±7.19 552,319 708,548 15.2±8.22 98,834 284,508
었으며 1,670,615점의 분석 결과, SOC 함량은 13.6±5.48 g kg-1인 것으로 나타났다. 논의 9.1%인 90,734 ha에 분포하 고 있는 Entisols에서 171,568점을 분석한 결과, SOC 함량은 11.7±5.16 g kg-1으로 토양목 중에서 가장 낮았다. Alfisols 과 Ultisols에서는 각각 60,511 ha (195,946점)과 3,463 ha (30,463점)를 차지하고 있었으며, SOC함량은 13.6±4.96 g kg-1, 12.7±4.79 g kg-1으로 나타났다. 신토양 분류법에서 유기질 토양으로 분류되는 Histosols은 14 ha로 분포면적이 매우 적지만 17.5 g kg-1의 가장 높은 SOC 함량을 나타내었 고, 토층 분화가 없거나 미약하여 단면 발달이 거의 없는 토 양인 Entisols에서 가장 낮은 SOC함량을 나타내었다. 논 토 양에서는 Histosols와 같이 유기물과 관련이 있는 토양목이 아니면 큰 차이는 나타나지 않았다.
다음으로 밭 토양의 총 조사면적은 552,319 ha로 2010년 통계량 477,999 ha보다 많았는데 이는 임지 등도 포함된 것 으로 보이며 총 708,548점이 분석되어 0.78 ha에서 1점을 분석한 것으로 나타났다. 논 토양과 마찬가지로 밭의 63.0%
(347,871 ha)를 차지하는 Inceptisols에서 478,150점의 토양을 분석한 결과, SOC함량은 14.1±7.38 g kg-1인 것으로 나타났 다. 다음으로 Ultisols (75,421 ha, 13.7%)과 Alfisols (75,222 ha, 13.6%)에서 SOC함량은 각각 12.7±6.22 g kg-1, 13.7±6.99 g kg-1 이었으며, Entisols은 50,655 ha에서 50,739점을 조 사한 결과, SOC함량은 12.8±7.05 g kg-1인 것으로 나타났 다. 밭 토양 역시 비옥한 초원 등의 부드러운 토양으로 알려 져 있는 Mollisols (마지통)을 제외하면 12.7 g kg-1에서 14.1 g kg-1의 범위였으며 토양목간에는 차이가 1.3 g kg-1로 다 소 적은 것으로 나타났다.
과수원 토양은 98,834 ha에서 총 284,508점을 분석한 결 과 Inceptisols은 논과 밭 토양과 같이 64,253 ha (65%)의 가장 많은 면적에 분포하고 있었고, 205,966점을 분석한 결 과, SOC함량은 15.3±8.20 g kg-1으로 논과 밭 토양보다 높 았다. Alfisols은 12,959 ha에서 37,242점을 분석한 결과, SOC함량은 15.6±8.59 g kg-1으로 Inceptisols과 비슷하였
다. Entisols은 10,983 ha에 분포하고 있었는데 17,748점을 분석한 결과, SOC함량은 13.7±7.81 g kg-1으로 토양목 중에 서 가장 낮은 것으로 나타났다. Ultisols은 10,590 ha에 분 포하고 있었고, 23,184점을 분석한 결과, 16.3±8.49 g kg-1 으로 가장 높게 나타났다. 과수원 토양에서는 Entisols을 제 외한 모든 토양목에서 15.3 g kg-1 이상의 높은 SOC함량을 나타내었으며, 특히 논 토양과 밭 토양에서 낮은 SOC를 포 함하고 있던 Ultisols에서 가장 높은 16.3 g kg-1의 높은 함 량을 나타내었는데, 이것은 인위적인 유기물 투입에 의해 SOC가 증가한 것으로 판단된다. 이상의 결과에서 논과 밭 토양보다 과수원 토양에서 SOC함량이 높아 Mann (1896)의 보고와 같이 경작에 의한 영향이 큰 것으로 나타났고, 다른 연구자들 (Paustian et al., 1997; Ogle et al., 2004)의 결과 와 같이 토양의 종류보다는 토양에 투입된 유기물의 양에 따라 SOC함량이 크게 달라지는 것을 알 수 있었다.
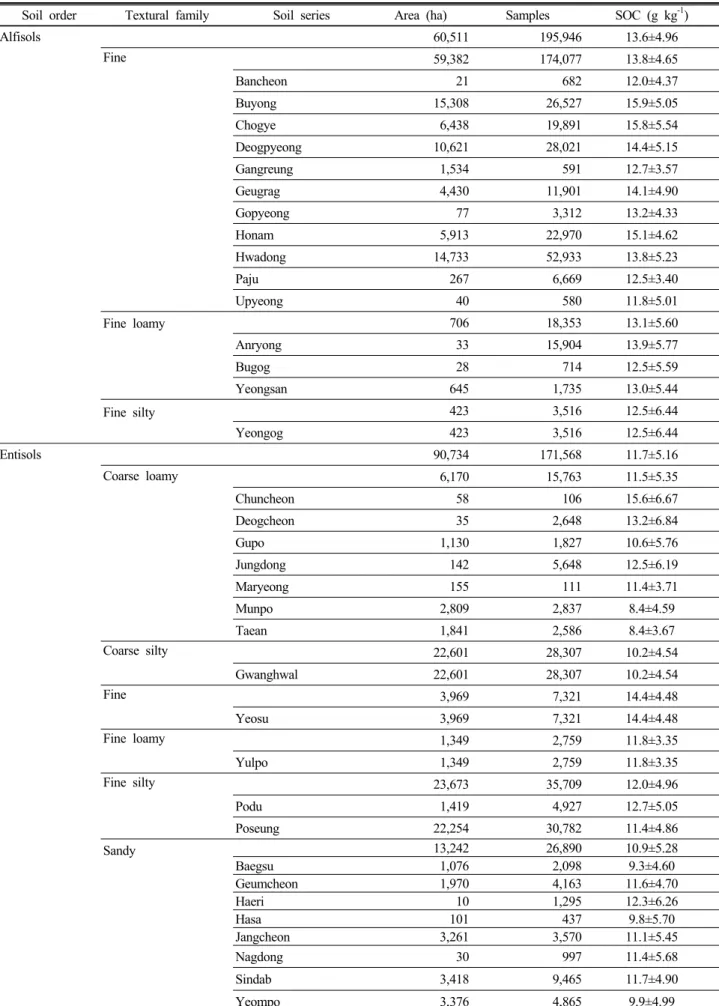
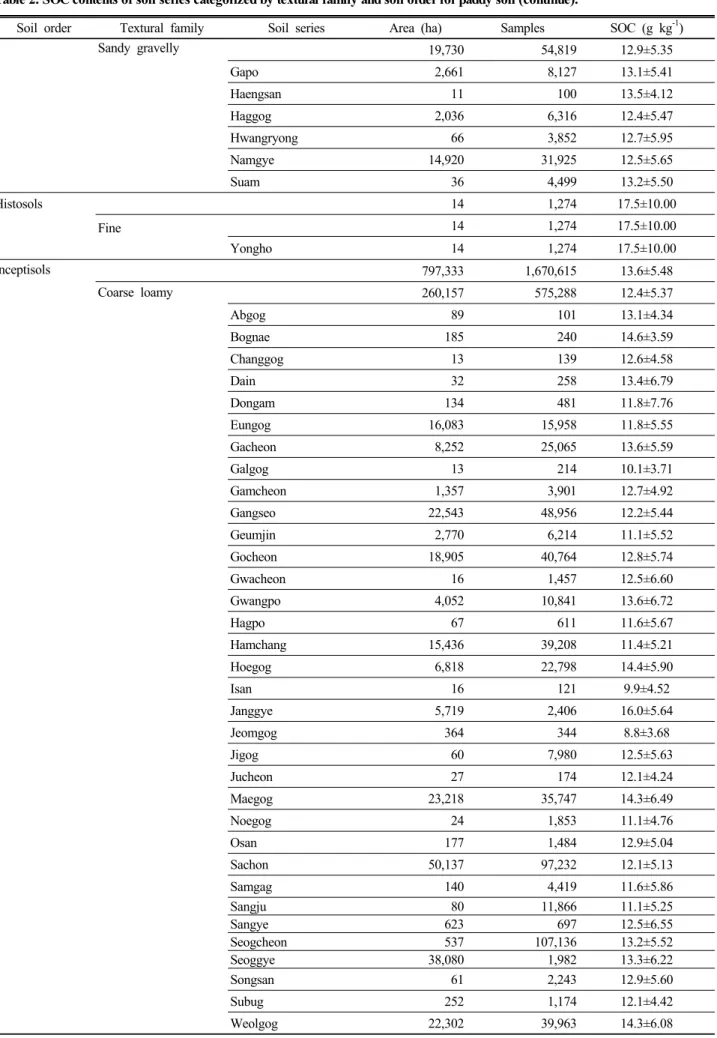
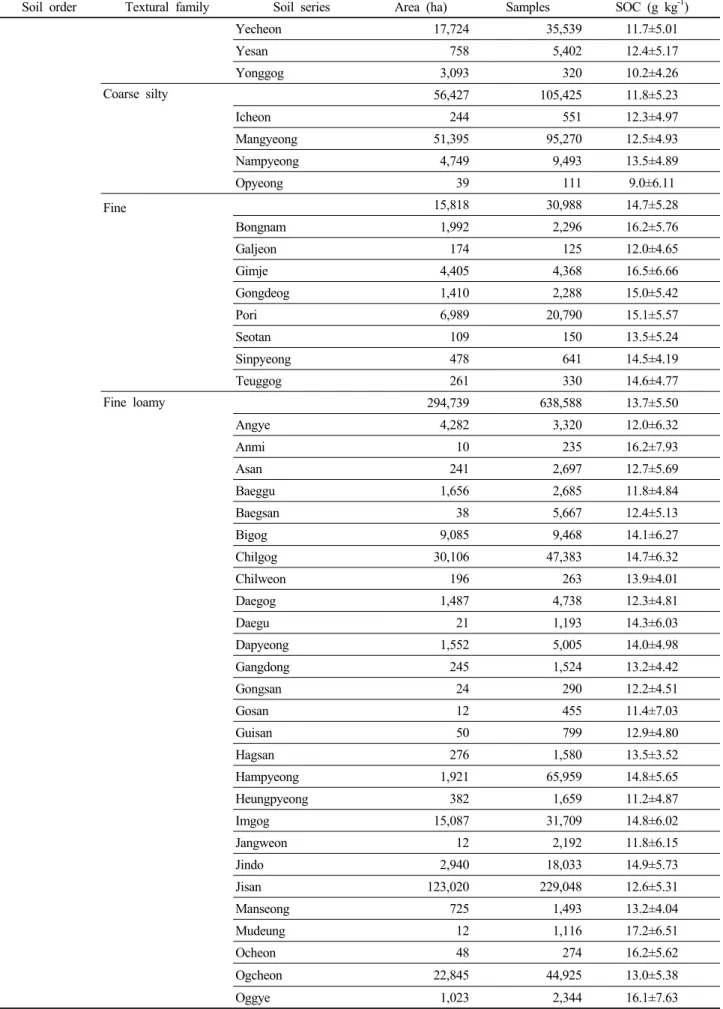
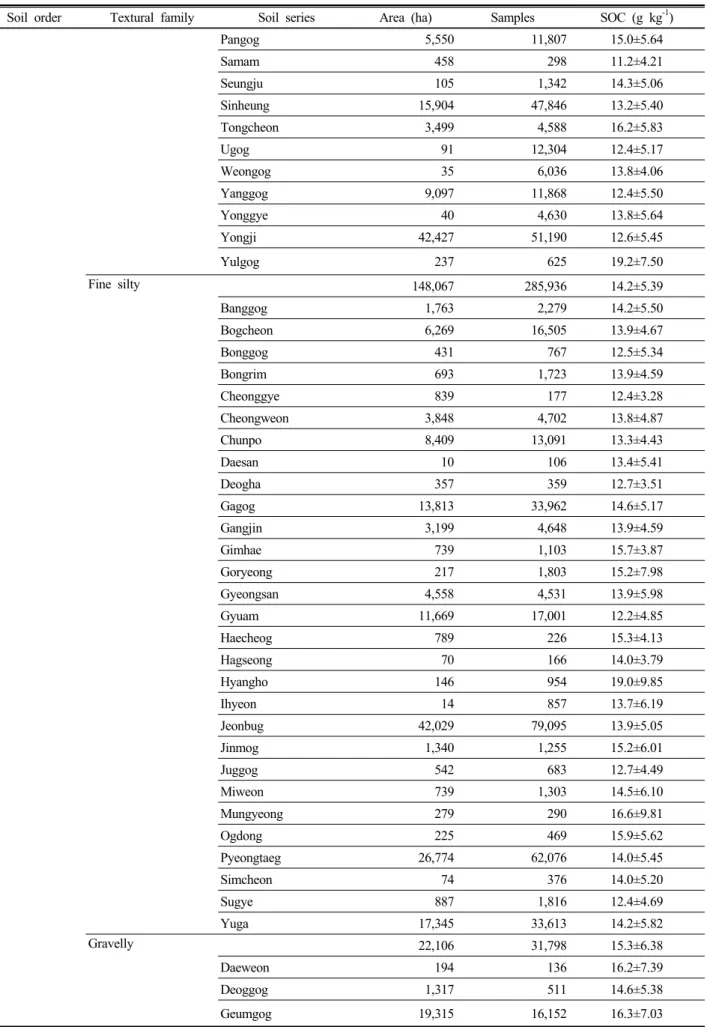
동일 토양목의 토양통별 SOC 분포 우리나라의 SOC 함량을 토양통별 분포를 토양목별로 구분한 후 다시 토성속 에 따라 논 (Table 2), 밭 (Table 3), 과수원 (Table 4) 토양 으로 구분하여 살펴 보았다.
논 토양의 경우 Table 2와 같이, Alfisols에서 반천통과 우평통은 각각 12.0과 11.8 g C kg-1의 낮은 SOC함량을 나 타내었고, 부용통은 15.9 g C kg-1의 높은 SOC를 포함하고 있었다. 특히 미숙답인 초계통도 15.8 g C kg-1의 높은 SOC 함량을 나타내어 미숙답도 많은 유기물을 보유할 수 있는 것으로 나타났다. Entisols의 경우 문포통과 태안통에서 가 장 낮은 8.4 g C kg-1의 SOC를 포함하고 있었고, 춘천통에 서 가장 높은 15.6 g C kg-1의 SOC 함량을 나타내었다. 토 양의 발달 정도가 낮은 토양으로 분류되는 Inceptisols에서 는 많은 토양통이 포함되어 있었는데, 점곡통에서 가장 낮 은 8.8 g C kg-1의 SOC와 율곡통에서 가장 높은 19.2g C kg-1까지 다양한 SOC함량 분포를 나타내고 있었다. 이와 같 이 토양목이 같아도 토양통에 따라 SOC는 큰 차이가 나타
Table 2. SOC contents of soil series categorized by textural family and soil order for paddy soil (continue).
Soil order Textural family Soil series Area (ha) Samples SOC (g kg-1)
Alfisols 60,511 195,946 13.6±4.96
Fine 59,382 174,077 13.8±4.65
Bancheon 21 682 12.0±4.37
Buyong 15,308 26,527 15.9±5.05
Chogye 6,438 19,891 15.8±5.54
Deogpyeong 10,621 28,021 14.4±5.15
Gangreung 1,534 591 12.7±3.57
Geugrag 4,430 11,901 14.1±4.90
Gopyeong 77 3,312 13.2±4.33
Honam 5,913 22,970 15.1±4.62
Hwadong 14,733 52,933 13.8±5.23
Paju 267 6,669 12.5±3.40
Upyeong 40 580 11.8±5.01
Fine loamy 706 18,353 13.1±5.60
Anryong 33 15,904 13.9±5.77
Bugog 28 714 12.5±5.59
Yeongsan 645 1,735 13.0±5.44
Fine silty 423 3,516 12.5±6.44
Yeongog 423 3,516 12.5±6.44
Entisols 90,734 171,568 11.7±5.16
Coarse loamy 6,170 15,763 11.5±5.35
Chuncheon 58 106 15.6±6.67
Deogcheon 35 2,648 13.2±6.84
Gupo 1,130 1,827 10.6±5.76
Jungdong 142 5,648 12.5±6.19
Maryeong 155 111 11.4±3.71
Munpo 2,809 2,837 8.4±4.59
Taean 1,841 2,586 8.4±3.67
Coarse silty 22,601 28,307 10.2±4.54
Gwanghwal 22,601 28,307 10.2±4.54
Fine 3,969 7,321 14.4±4.48
Yeosu 3,969 7,321 14.4±4.48
Fine loamy 1,349 2,759 11.8±3.35
Yulpo 1,349 2,759 11.8±3.35
Fine silty 23,673 35,709 12.0±4.96
Podu 1,419 4,927 12.7±5.05
Poseung 22,254 30,782 11.4±4.86
Sandy 13,242 26,890 10.9±5.28
Baegsu 1,076 2,098 9.3±4.60
Geumcheon 1,970 4,163 11.6±4.70
Haeri 10 1,295 12.3±6.26
Hasa 101 437 9.8±5.70
Jangcheon 3,261 3,570 11.1±5.45
Nagdong 30 997 11.4±5.68
Sindab 3,418 9,465 11.7±4.90
Yeompo 3,376 4,865 9.9±4.99
Table 2. SOC contents of soil series categorized by textural family and soil order for paddy soil (continue).
Soil order Textural family Soil series Area (ha) Samples SOC (g kg-1)
Sandy gravelly 19,730 54,819 12.9±5.35
Gapo 2,661 8,127 13.1±5.41
Haengsan 11 100 13.5±4.12
Haggog 2,036 6,316 12.4±5.47
Hwangryong 66 3,852 12.7±5.95
Namgye 14,920 31,925 12.5±5.65
Suam 36 4,499 13.2±5.50
Histosols 14 1,274 17.5±10.00
Fine 14 1,274 17.5±10.00
Yongho 14 1,274 17.5±10.00
Inceptisols 797,333 1,670,615 13.6±5.48
Coarse loamy 260,157 575,288 12.4±5.37
Abgog 89 101 13.1±4.34
Bognae 185 240 14.6±3.59
Changgog 13 139 12.6±4.58
Dain 32 258 13.4±6.79
Dongam 134 481 11.8±7.76
Eungog 16,083 15,958 11.8±5.55
Gacheon 8,252 25,065 13.6±5.59
Galgog 13 214 10.1±3.71
Gamcheon 1,357 3,901 12.7±4.92
Gangseo 22,543 48,956 12.2±5.44
Geumjin 2,770 6,214 11.1±5.52
Gocheon 18,905 40,764 12.8±5.74
Gwacheon 16 1,457 12.5±6.60
Gwangpo 4,052 10,841 13.6±6.72
Hagpo 67 611 11.6±5.67
Hamchang 15,436 39,208 11.4±5.21
Hoegog 6,818 22,798 14.4±5.90
Isan 16 121 9.9±4.52
Janggye 5,719 2,406 16.0±5.64
Jeomgog 364 344 8.8±3.68
Jigog 60 7,980 12.5±5.63
Jucheon 27 174 12.1±4.24
Maegog 23,218 35,747 14.3±6.49
Noegog 24 1,853 11.1±4.76
Osan 177 1,484 12.9±5.04
Sachon 50,137 97,232 12.1±5.13
Samgag 140 4,419 11.6±5.86
Sangju 80 11,866 11.1±5.25
Sangye 623 697 12.5±6.55
Seogcheon 537 107,136 13.2±5.52
Seoggye 38,080 1,982 13.3±6.22
Songsan 61 2,243 12.9±5.60
Subug 252 1,174 12.1±4.42
Weolgog 22,302 39,963 14.3±6.08
Table 2. SOC contents of soil series categorized by textural family and soil order for paddy soil (continue).
Soil order Textural family Soil series Area (ha) Samples SOC (g kg-1)
Yecheon 17,724 35,539 11.7±5.01
Yesan 758 5,402 12.4±5.17
Yonggog 3,093 320 10.2±4.26
Coarse silty 56,427 105,425 11.8±5.23
Icheon 244 551 12.3±4.97
Mangyeong 51,395 95,270 12.5±4.93
Nampyeong 4,749 9,493 13.5±4.89
Opyeong 39 111 9.0±6.11
Fine 15,818 30,988 14.7±5.28
Bongnam 1,992 2,296 16.2±5.76
Galjeon 174 125 12.0±4.65
Gimje 4,405 4,368 16.5±6.66
Gongdeog 1,410 2,288 15.0±5.42
Pori 6,989 20,790 15.1±5.57
Seotan 109 150 13.5±5.24
Sinpyeong 478 641 14.5±4.19
Teuggog 261 330 14.6±4.77
Fine loamy 294,739 638,588 13.7±5.50
Angye 4,282 3,320 12.0±6.32
Anmi 10 235 16.2±7.93
Asan 241 2,697 12.7±5.69
Baeggu 1,656 2,685 11.8±4.84
Baegsan 38 5,667 12.4±5.13
Bigog 9,085 9,468 14.1±6.27
Chilgog 30,106 47,383 14.7±6.32
Chilweon 196 263 13.9±4.01
Daegog 1,487 4,738 12.3±4.81
Daegu 21 1,193 14.3±6.03
Dapyeong 1,552 5,005 14.0±4.98
Gangdong 245 1,524 13.2±4.42
Gongsan 24 290 12.2±4.51
Gosan 12 455 11.4±7.03
Guisan 50 799 12.9±4.80
Hagsan 276 1,580 13.5±3.52
Hampyeong 1,921 65,959 14.8±5.65
Heungpyeong 382 1,659 11.2±4.87
Imgog 15,087 31,709 14.8±6.02
Jangweon 12 2,192 11.8±6.15
Jindo 2,940 18,033 14.9±5.73
Jisan 123,020 229,048 12.6±5.31
Manseong 725 1,493 13.2±4.04
Mudeung 12 1,116 17.2±6.51
Ocheon 48 274 16.2±5.62
Ogcheon 22,845 44,925 13.0±5.38
Oggye 1,023 2,344 16.1±7.63
Table 2. SOC contents of soil series categorized by textural family and soil order for paddy soil (continue).
Soil order Textural family Soil series Area (ha) Samples SOC (g kg-1)
Pangog 5,550 11,807 15.0±5.64
Samam 458 298 11.2±4.21
Seungju 105 1,342 14.3±5.06
Sinheung 15,904 47,846 13.2±5.40
Tongcheon 3,499 4,588 16.2±5.83
Ugog 91 12,304 12.4±5.17
Weongog 35 6,036 13.8±4.06
Yanggog 9,097 11,868 12.4±5.50
Yonggye 40 4,630 13.8±5.64
Yongji 42,427 51,190 12.6±5.45
Yulgog 237 625 19.2±7.50
Fine silty 148,067 285,936 14.2±5.39
Banggog 1,763 2,279 14.2±5.50
Bogcheon 6,269 16,505 13.9±4.67
Bonggog 431 767 12.5±5.34
Bongrim 693 1,723 13.9±4.59
Cheonggye 839 177 12.4±3.28
Cheongweon 3,848 4,702 13.8±4.87
Chunpo 8,409 13,091 13.3±4.43
Daesan 10 106 13.4±5.41
Deogha 357 359 12.7±3.51
Gagog 13,813 33,962 14.6±5.17
Gangjin 3,199 4,648 13.9±4.59
Gimhae 739 1,103 15.7±3.87
Goryeong 217 1,803 15.2±7.98
Gyeongsan 4,558 4,531 13.9±5.98
Gyuam 11,669 17,001 12.2±4.85
Haecheog 789 226 15.3±4.13
Hagseong 70 166 14.0±3.79
Hyangho 146 954 19.0±9.85
Ihyeon 14 857 13.7±6.19
Jeonbug 42,029 79,095 13.9±5.05
Jinmog 1,340 1,255 15.2±6.01
Juggog 542 683 12.7±4.49
Miweon 739 1,303 14.5±6.10
Mungyeong 279 290 16.6±9.81
Ogdong 225 469 15.9±5.62
Pyeongtaeg 26,774 62,076 14.0±5.45
Simcheon 74 376 14.0±5.20
Sugye 887 1,816 12.4±4.69
Yuga 17,345 33,613 14.2±5.82
Gravelly 22,106 31,798 15.3±6.38
Daeweon 194 136 16.2±7.39
Deoggog 1,317 511 14.6±5.38
Geumgog 19,315 16,152 16.3±7.03
Table 2. SOC contents of soil series categorized by textural family and soil order for paddy soil.
Soil order Textural family Soil series Area (ha) Samples SOC (g kg-1)
Gugog 437 1,401 17.6±8.48
Hogye 91 5,635 14.3±5.72
Jangyu 626 1,148 16.1±5.43
Masan 75 1,526 12.7±4.50
Seogto 40 5,153 15.0±6.92
Sinbul 11 136 15.2±6.56
Sandy gravelly 19 2,592 13.7±5.55
Pungcheon 19 2,592 13.7±5.55
Ultisols 3,463 30,463 12.7±4.79
Fine 523 9,274 12.7±5.02
Bansan 11 454 12.7±4.39
Bonggye 108 2,780 11.6±4.41
Gaghwa 18 4,369 14.4±6.73
Jeonnam 386 1,671 12.2±4.56
Fine loamy 2,940 21,189 12.8±4.64
Bongsan 182 8,623 13.2±3.97
Daeheung 384 282 14.6±3.77
Nasan 11 1,177 11.2±4.38
Songjeong 2,302 10,208 12.6±4.69
Taehwa 30 431 13.1±5.42
Wansan 31 468 12.0±5.59
All paddy soils 994,451 2,071,822 13.3±5.38
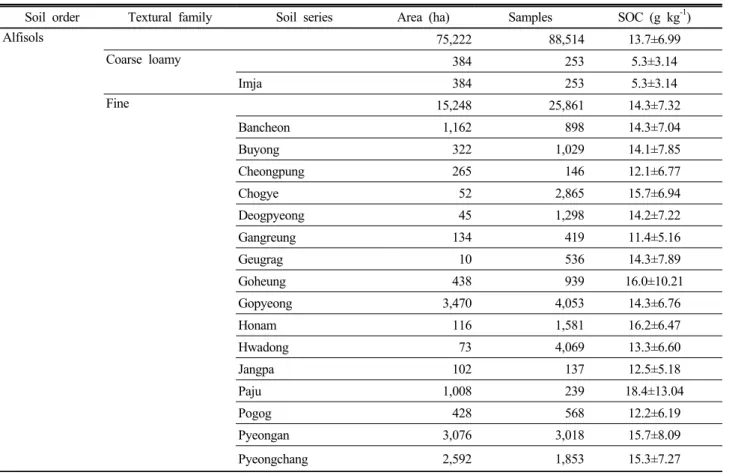
Table 3. SOC contents of soil series categorized by textural family and soil order for upland soil (continue).
Soil order Textural family Soil series Area (ha) Samples SOC (g kg-1)
Alfisols 75,222 88,514 13.7±6.99
Coarse loamy 384 253 5.3±3.14
Imja 384 253 5.3±3.14
Fine 15,248 25,861 14.3±7.32
Bancheon 1,162 898 14.3±7.04
Buyong 322 1,029 14.1±7.85
Cheongpung 265 146 12.1±6.77
Chogye 52 2,865 15.7±6.94
Deogpyeong 45 1,298 14.2±7.22
Gangreung 134 419 11.4±5.16
Geugrag 10 536 14.3±7.89
Goheung 438 939 16.0±10.21
Gopyeong 3,470 4,053 14.3±6.76
Honam 116 1,581 16.2±6.47
Hwadong 73 4,069 13.3±6.60
Jangpa 102 137 12.5±5.18
Paju 1,008 239 18.4±13.04
Pogog 428 568 12.2±6.19
Pyeongan 3,076 3,018 15.7±8.09
Pyeongchang 2,592 1,853 15.3±7.27
Table 3. SOC contents of soil series categorized by textural family and soil order for upland soil (continue).
Soil order Textural family Soil series Area (ha) Samples SOC (g kg-1)
Pyeongjeon 832 1,394 13.3±6.38
Sirye 211 123 15.4±8.04
Upyeong 912 696 13.0±5.95
Fine loamy 48,315 54,308 13.6±6.64
Anryong 45,023 51,490 14.8±7.63
Bugog 2,211 1,866 13.1±7.00
Buyeo 328 151 12.0±4.99
Dojeon 753 801 14.5±6.95
Fine silty 11,275 8,092 12.0±6.00
Yeongog 11,275 8,092 12.0±6.00
Entisols 50,655 50,379 12.8±7.05
Coarse loamy 16,882 13,512 14.1±7.72
Deogcheon 3,813 4,697 13.6±8.15
Deogsan 456 466 17.9±9.59
Docheon 971 559 11.2±6.12
Gwanag 23 153 15.7±7.65
Jungdong 11,619 7,637 12.1±7.10
Coarse silty 2,096 1,094 9.7±5.58
Gwanghwal 2,096 1,094 9.7±5.58
Fine loamy 1,264 1,210 14.5±6.73
Goesan 948 356 12.8±5.86
Jangseong 316 854 16.2±7.60
Fine silty 150 938 11.6±5.17
Poseung 150 938 11.6±5.17
Gravelly 57 104 20.5±12.81
Nogjeon 57 104 20.5±12.81
Sandy 7,112 6,617 10.7±5.93
Bicheon 146 121 12.0±5.56
Geumcheon 27 315 12.5±6.03
Haeri 658 1,398 10.2±5.97
Hasa 482 462 6.0±4.54
Hwabong 530 367 12.8±5.54
Jangcheon 254 937 10.4±5.74
Nagdong 4,146 1,813 10.2±6.24
Sadu 88 184 9.0±6.10
Sindab 21 312 11.8±6.02
Togye 729 468 12.4±6.69
Yeompo 31 240 10.8±6.76
Sandy gravelly 23,094 26,904 14.2±8.10
Gapo 14 330 12.2±6.12
Haengsan 592 381 17.7±10.51
Haggog 238 1,611 15.5±8.25
Hwangryong 4,106 3,706 13.6±8.15
Ibseog 591 444 12.5±7.45
Namgye 604 4,395 13.5±7.87
Suam 16,949 16,037 14.8±8.33
Table 3. SOC contents of soil series categorized by textural family and soil order for upland soil (continue).
Soil order Textural family Soil series Area (ha) Samples SOC (g kg-1)
Inceptisols 347,871 478,150 14.1±7.38
Coarse loamy 141,473 203,580 13.5±7.79
Abgog 144 101 22.0±12.67
Changgog 404 438 14.4±8.02
Cheongsim 694 263 17.1±9.55
Chugye 130 111 14.5±8.18
Dain 837 574 9.8±5.55
Danbug 638 252 9.9±3.98
Eungog 601 3,884 12.1±6.79
Gacheon 91 2,483 13.1±7.25
Galgog 1,714 665 11.1±6.49
Gamcheon 22 133 13.5±7.98
Gangseo 1,244 7,391 12.0±7.28
Geumjin 11 407 13.0±10.97
Gocheon 904 6,151 12.9±7.62
Gwacheon 2,298 3,669 13.6±7.20
Gwangpo 195 1,164 12.1±8.75
Habin 669 236 10.3±4.97
Hamchang 508 3,394 11.4±8.39
Hoegog 213 5,313 14.4±7.36
Imog 588 512 12.3±6.94
Isan 536 405 13.2±8.71
Jigog 32,192 30,559 13.2±7.41
Jucheon 133 156 15.6±7.46
Jugog 356 387 22.4±9.14
Maegog 1,173 10,235 14.8±8.26
Mui 2,850 3,519 13.9±8.51
Nagsan 280 109 14.6±5.62
Noegog 5,043 5,678 11.4±5.81
Odae 121 276 13.8±10.27
Oesan 704 779 18.5±10.31
Osan 7,412 8,314 13.5±7.45
Sachon 2,073 13,103 12.0±7.14
Samgag 12,615 14,304 11.4±6.77
Sangju 37,965 31,700 11.2±6.41
Sangye 1,598 711 15.2±7.87
Seogcheon 11 9,177 13.1±7.63
Seoggye 550 192 12.9±7.45
Songsan 4,922 7,190 15.0±9.58
Weolgog 963 11,515 15.1±8.05
Weolsan 238 164 9.2±5.78
Yecheon 264 3,607 11.6±7.41
Yeongil 157 155 16.0±12.34
Yesan 17,412 14,204 11.2±5.88
Coarse silty 1,292 5,209 11.6±6.09
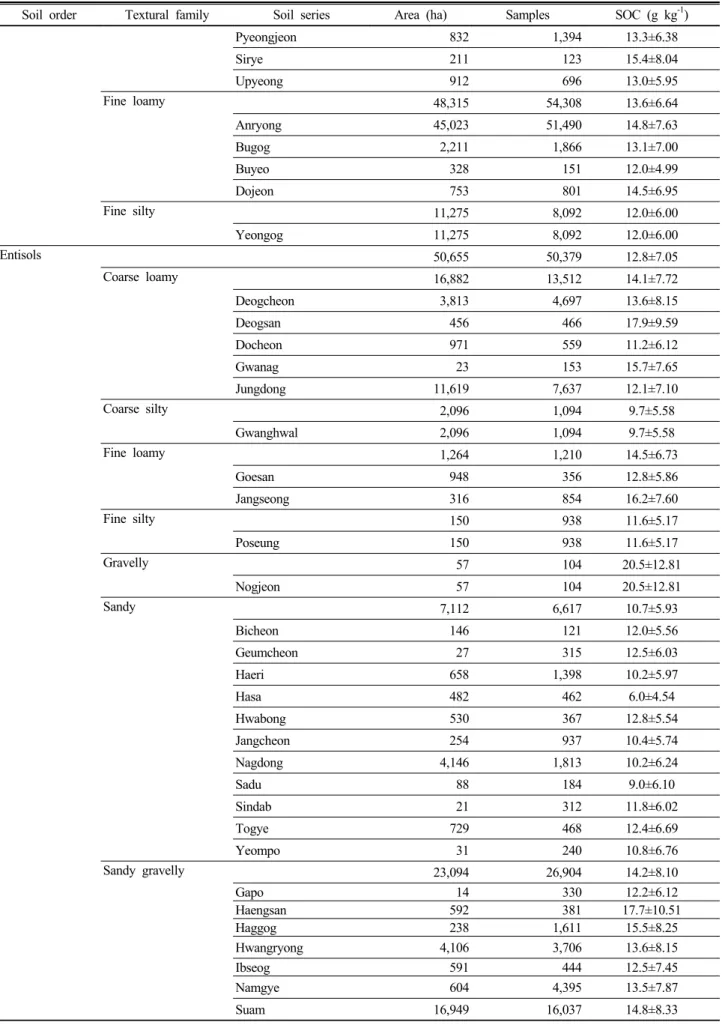
Table 3. SOC contents of soil series categorized by textural family and soil order for upland soil (continue).
Soil order Textural family Soil series Area (ha) Samples SOC (g kg-1)
Mangyeong 470 3,794 10.7±5.35
Nampyeong 169 1,219 12.6±6.64
Yuweon 653 196 11.5±6.29
Fine 887 1,094 16.8±8.63
Mosan 799 655 16.4±8.95
Pori 88 439 17.1±8.30
Fine loamy 134,633 185,652 14.7±7.35
Angye 140 862 12.1±5.59
Anmi 3,153 3,857 15.6±7.60
Asan 12,505 13,919 13.2±6.92
Baegsan 14,592 13,153 11.8±6.18
Banho 14,054 5,863 13.6±8.13
Bigog 441 2,083 13.1±6.46
Cheongsan 324 2,179 19.5±11.02
Chilgog 1,250 12,914 16.2±8.99
Chusan 359 281 22.8±10.95
Daegog 6,399 5,386 12.2±6.29
Daegu 4,674 2,281 13.9±7.00
Gamgog 711 599 11.2±5.66
Gongsan 1,907 1,106 14.4±6.38
Gosan 799 999 16.0±8.33
Guisan 7,623 2,974 14.8±8.37
Gwarim 1,339 2,235 15.9±7.68
Hampyeong 68 8,168 16.2±8.05
Hwasun 1,050 697 14.8±6.91
Imgog 149 3,772 15.9±8.17
Imsan 141 122 19.2±10.11
Jangsan 168 530 15.2±5.54
Jangweon 9,417 7,052 12.8±6.30
Jisan 1,457 23,957 12.4±7.24
Misan 306 430 16.1±8.30
Mudeung 1,086 1,398 16.1±7.59
Ogcheon 153 3,564 12.0±6.67
Oggye 458 1,427 16.7±7.51
Pangog 307 2,931 17.3±6.44
Samam 9,515 122 11.9±5.88
Sinheung 151 3,110 12.3±6.59
Sinjeong 641 600 15.2±8.38
Tongcheon 17 132 16.4±7.59
Ugog 20,717 24,987 13.7±6.56
Weongog 10,884 7,286 11.7±5.49
Yanggog 136 1,368 12.2±5.82
Yeongweol 719 1,149 14.7±7.45
Yonggye 6,040 13,344 17.1±8.45
Yongji 743 8,613 12.5±6.63
Yulgog 40 202 14.9±7.48
Table 3. SOC contents of soil series categorized by textural family and soil order for upland soil (continue).
Soil order Textural family Soil series Area (ha) Samples SOC (g kg-1)
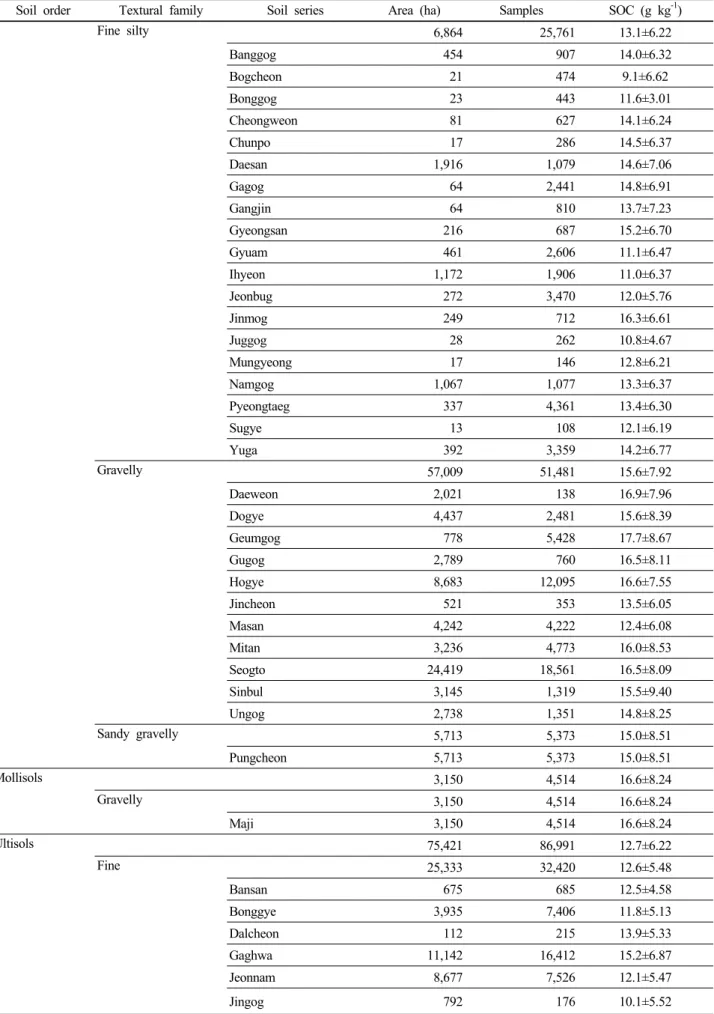
Fine silty 6,864 25,761 13.1±6.22
Banggog 454 907 14.0±6.32
Bogcheon 21 474 9.1±6.62
Bonggog 23 443 11.6±3.01
Cheongweon 81 627 14.1±6.24
Chunpo 17 286 14.5±6.37
Daesan 1,916 1,079 14.6±7.06
Gagog 64 2,441 14.8±6.91
Gangjin 64 810 13.7±7.23
Gyeongsan 216 687 15.2±6.70
Gyuam 461 2,606 11.1±6.47
Ihyeon 1,172 1,906 11.0±6.37
Jeonbug 272 3,470 12.0±5.76
Jinmog 249 712 16.3±6.61
Juggog 28 262 10.8±4.67
Mungyeong 17 146 12.8±6.21
Namgog 1,067 1,077 13.3±6.37
Pyeongtaeg 337 4,361 13.4±6.30
Sugye 13 108 12.1±6.19
Yuga 392 3,359 14.2±6.77
Gravelly 57,009 51,481 15.6±7.92
Daeweon 2,021 138 16.9±7.96
Dogye 4,437 2,481 15.6±8.39
Geumgog 778 5,428 17.7±8.67
Gugog 2,789 760 16.5±8.11
Hogye 8,683 12,095 16.6±7.55
Jincheon 521 353 13.5±6.05
Masan 4,242 4,222 12.4±6.08
Mitan 3,236 4,773 16.0±8.53
Seogto 24,419 18,561 16.5±8.09
Sinbul 3,145 1,319 15.5±9.40
Ungog 2,738 1,351 14.8±8.25
Sandy gravelly 5,713 5,373 15.0±8.51
Pungcheon 5,713 5,373 15.0±8.51
Mollisols 3,150 4,514 16.6±8.24
Gravelly 3,150 4,514 16.6±8.24
Maji 3,150 4,514 16.6±8.24
Ultisols 75,421 86,991 12.7±6.22
Fine 25,333 32,420 12.6±5.48
Bansan 675 685 12.5±4.58
Bonggye 3,935 7,406 11.8±5.13
Dalcheon 112 215 13.9±5.33
Gaghwa 11,142 16,412 15.2±6.87
Jeonnam 8,677 7,526 12.1±5.47
Jingog 792 176 10.1±5.52
Table 3. SOC contents of soil series categorized by textural family and soil order for upland soil.
Soil order Textural family Soil series Area (ha) Samples SOC (g kg-1)
Fine loamy 50,088 54,571 12.7±6.72
Bongsan 14,039 18,492 13.9±6.11
Daeheung 444 341 15.7±5.12
Geunsan 46 142 14.1±7.59
Nasan 1,548 3,942 10.9±5.09
Nonsan 235 136 10.0±7.05
Songjeong 28,851 26,784 11.4±5.46
Taehwa 3,612 3,564 14.2±6.59
Unbong 752 901 11.6±8.01
Wansan 561 269 12.6±9.47
All upland soils 552,319 708,548 13.7±7.19
Table 4. SOC contents of soil series categorized by textural family and soil order in orchard soil (continue).
Soil order Textural family Soil series Area (ha) Samples SOC (g kg-1)
Alfisols 12,959 37,242 15.6±8.59
Fine 3,927 15,460 15.7±8.50
Bancheon 276 398 16.4±8.84
Buyong 19 240 14.6±9.22
Chogye 64 2,110 16.9±8.42
Deogpyeong 787 1,777 17.9±9.41
Geugrag 605 2,101 12.8±7.07
Gopyeong 424 1,193 16.1±7.85
Honam 98 438 15.8±9.26
Hwadong 390 3,506 16.3±8.89
Pogog 168 334 14.1±8.55
Pyeongan 66 101 15.4±8.38
Pyeongchang 114 681 13.6±7.46
Pyeongjeon 125 1,257 15.2±7.61
Sirye 201 561 16.1±8.82
Upyeong 590 763 18.3±9.20
Fine loamy 5,214 16,374 15.7±9.12
Anryong 5,000 15,954 16.7±8.77
Bugog 177 254 15.1±10.45
Dojeon 37 166 15.4±8.13
Fine silty 3,818 5,408 14.3±8.22
Yeongog 3,818 5,408 14.3±8.22
Entisols 10,983 17,748 13.7±7.81
Coarse loamy 6,365 6,337 13.5±7.89
Deogcheon 4,058 3,935 14.4±8.82
Deogsan 45 167 15.3±8.03
Docheon 252 211 13.9±8.81
Euiseong 111 287 11.7±6.20
Jungdong 1,899 1,737 12.2±7.60
Fine loamy 87 113 13.1±7.17
Goesan 87 113 13.1±7.17
Table 4. SOC contents of soil series categorized by textural family and soil order in orchard soil (continue).
Soil order Textural family Soil series Area (ha) Samples SOC (g kg-1)
Fine silty 88 367 10.2±6.54
Poseung 88 367 10.2±6.54
Sandy 1,078 1,840 12.6±6.93
Geumcheon 40 121 11.5±6.83
Hwabong 204 193 14.0±7.35
Jangcheon 106 285 11.4±6.43
Nagdong 425 399 11.8±6.45
Sindab 91 160 9.8±6.01
Togye 212 682 16.8±8.51
Sandy gravelly 3,365 9,091 15.3±8.79
Dosan 32 152 9.7±5.07
Haengsan 11 408 18.5±9.99
Haggog 34 317 18.8±11.90
Hwangryong 1,972 2,315 14.1±8.29
Ibseog 237 182 13.3±7.97
Namgye 554 2,093 15.9±9.08
Suam 525 3,624 16.6±9.25
Inceptisols 64,253 205,966 15.3±8.20
Coarse loamy 25,465 81,504 14.0±8.02
Cheongsim 48 485 13.9±7.96
Dain 190 197 10.9±5.40
Danbug 222 276 10.5±5.19
Dongam 15 129 12.8±7.60
Eungog 942 4,046 15.3±8.60
Gacheon 63 711 16.3±8.40
Galgog 66 136 11.5±7.63
Gamcheon 17 222 14.1±9.08
Gangseo 384 2,210 14.6±8.99
Gocheon 1,033 4,396 14.9±7.68
Gwacheon 345 1,780 15.1±8.48
Habin 92 146 13.1±6.18
Hamchang 227 2,414 14.5±10.41
Hoegog 20 2,348 15.7±9.22
Imdong 18 108 11.5±4.88
Isan 145 254 12.5±7.40
Jigog 2,565 8,619 15.0±8.64
Maegog 592 4,800 16.1±8.68
Noegog 742 1,786 14.6±8.76
Oesan 37 344 19.6±10.08
Osan 1,446 4,954 12.9±8.24
Sachon 948 4,968 13.6±8.02
Samgag 2,681 7,522 13.8±8.36
Sangju 5,724 12,626 13.3±8.08
Seoggye 376 101 13.7±8.15
Songsan 551 3,797 16.9±10.60
Table 4. SOC contents of soil series categorized by textural family and soil order in orchard soil (continue).
Soil order Textural family Soil series Area (ha) Samples SOC (g kg-1)
Weolgog 470 4,551 16.3±8.50
Yecheon 125 1,063 12.9±7.56
Yesan 5,305 6,364 12.8±8.68
Yonggog 76 151 10.7±5.11
Coarse silty 47 886 14.6±7.85
Mangyeong 13 430 13.6±7.51
Nampyeong 34 456 15.6±8.19
Fine loamy 25,016 90,903 15.9±8.38
Angye 268 952 12.5±7.05
Anmi 112 557 15.7±8.00
Asan 1,057 5,190 16.3±9.43
Baegsan 1,265 3,725 14.5±7.87
Banho 2,811 3,902 14.2±7.56
Bigog 579 1,506 15.0±7.14
Cheongsan 16 2,714 20.7±10.95
Chilgog 1,495 11,409 16.9±8.69
Chusan 245 623 19.3±8.92
Daegog 684 1,405 13.7±7.68
Daegu 2,211 2,771 15.4±8.16
Gamgog 77 194 14.4±8.41
Gongsan 30 515 14.9±8.88
Gosan 328 476 16.6±9.76
Guisan 2,229 2,246 14.4±8.15
Gwarim 46 258 14.8±7.65
Hampyeong 50 3,639 16.6±8.64
Heungpyeong 15 263 15.9±10.25
Imgog 192 1,970 19.2±9.35
Jangweon 2,725 4,508 15.4±8.52
Jisan 1,789 14,186 15.0±8.83
Misan 26 611 16.6±8.43
Mudeung 84 610 19.3±10.61
Ogcheon 73 1,286 13.3±7.71
Oggye 39 422 16.0±8.55
Pangog 577 1,270 16.6±7.69
Sinheung 252 2,330 14.0±8.11
Sinjeong 248 610 13.6±6.76
Tongcheon 199 560 19.5±8.66
Ugog 1,640 4,886 15.6±7.88
Weongog 781 2,580 14.4±7.89
Yanggog 533 2,176 13.0±6.66
Yongdang 83 160 20.8±8.21
Yonggye 947 3,429 16.5±8.52
Yongji 1,300 6,754 15.1±8.61
Yulgog 10 210 15.7±7.52
Fine silty 3,934 10,926 15.6±7.95