INTRODUCTION
Soil erosion causes a serious problem that stems from a combination of environmental impacts
1)and crop productivity loss,
2,3)which makes the understanding of the erosion process important to guarantee food security
4)and environmental safety.
5)Erosion is considered to have the greatest impact among surface hydrologic processes and in the future, it may be exacerbated in the future in many parts of the world because of climate change towards a more vigorous hydrologic cycle.
6)Therefore, it has a great deal of importance in optimizing policies for management of water resources.
7)In recent decades, empirically, conceptually, or physically
based models have been built in order to represent and quantify the processes of detachment, transport, and deposition of eroded soil, with the aim of implementing assessment tools for educational, planning, and legislative purposes.
8)Calibration of models is different since the phenomena are complex and depend on many parameters, especially because filed data are usually not sufficient and relate to small spatial and temporal contexts.
Empirical models are still used because of their simple structure and ease of application, but they cannot describe nor simulate the erosion process as a set of physical phenomena because they are based on coefficients computed or calibrated on the basis of measurement and/or observation. Contrary to empirical models, physically based models simulate the individual components of the entire erosion process by solving the corresponding equations and so it is argued that
Region-Scaled Soil Erosion Assessment using USLE and WEPP in Korea
Min-Kyeong Kim
1), Kang-Ho Jung
1), Sun-Gang Yun
1), and Chul-Soo Kim
2)*1)
Department of Agricultural Environment, National Academy of Agricultural Science, RDA, Suwon 441-707, Korea
2)
Department of Civil Engineering, Kyungbuk National University, Sangju 742-711, Korea (Received November 11, 2008, Accepted December 23, 2008)
ABSTRACT: During the summer season, more than half of the annual precipitation in Korea occurs during the summer season due to the geographical location in the Asian monsoon belt. So, this causes severe soil erosion from croplands, which is directly linked to the deterioration of crop/land productivity and surface water quality. Therefore, much attention has been given to develop accurate estimation tools of soil erosion.
The aim of this study is to assess the performance of using the empirical Universal Soil Loss Equation (USLE) and the physical-based model of the Water Erosion Prediction Project (WEPP) to quantify eroded amount of soil from agricultural fields. Input data files, including climate, soil, slope, and cropping management, were modified to fit into Korean conditions. Chuncheon (forest) and Jeonju (level-plain) were selected as two Korean cities with different topographic characteristics for model analysis. The results of this current study indicated that better soil erosion prediction can be achieved using the WEPP model since it has better power to illustrate a higher degree of spatial variability than USLE in topography, precipitation, soils, and crop management practices. These present findings are expected to contribute to the development of the environmental assessment program as well as the conservation of the agricultural environment in Korea.
Key Words: Soil erosion, Universal Soil Loss Equation (USLE), Water Erosion Prediction Project (WEPP)
*
Corresponding author:
Tel: +82-54-530-1259 Fax: +82-54-530-1419 E-mail: [email protected]
314
they tend to have a wider range of applicability.
Generally, models are also better in terms of their capability to assess both the spatial and temporal variability of the natural erosion processes.
The Universal Soil Loss Equation (USLE) is the most widely used empirical erosion model.
9)It estimates soil erosion from an area simply as the product of empirical coefficients, which must therefore be accurately evaluated. While the USLE was used extensively to predict long-term average annual soil loss, it was a mature technology that could not easily be expanded to meet the ever increasing needs of conservationists and environmental managers, e.g., a limitation to apply only detaching regions of a hillslope and to estimate sediment deposition or sediment delivery from fields to off-site channels or streams. No capabilities to estimate runoff, spatial locations of soil loss on a hillslope profile or within a small watershed, channel erosion, effects of impound- ments, recurrence probabilities of erosion events, or watershed sediment yields.
10)The Water Erosion Prediction Project (WEPP) was developed to address all of these needs which USLE cannot deal with, and to serve as a replacement for empirically based erosion prediction technologies like USLE. WEPP is one of the well-known physically based model that predicts soil loss and deposition using a spatially and temporally distributed approach.
11,12,13)Most current erosion and runoff modeling are typically limited in spatial and temporal extent due to the use of field measurements for prediction data and/or use of long-term average prediction data to estimate probable soil erosion rates. Long-term average are the basis for estimating rainfall erosivity characteristics used in empirically based soil erosion models such as the USLE
9)and it derivatives. These estimates may be suitable for planning management and conservation practices to meet government com- pliance requirements. However, the impacts of highly variable and extreme precipitation events cannot be estimated with long-term averages. The extreme precipitation causes the majority of damage in most locations and situations.
14)Furthermore, the result of soil loss using the USLE used to apply with political practice in Korea. However, it is more necessary for opportunities to target degradation require location specific information.
Therefore, the objectives of this study were: 1) to adopt and modify WEPP model to fit into Korea con- ditions, 2) to apply WEPP and USLE to agricultural fields in Chuncheon and Jeonju, and 3) to evaluate their performance to predict soil erosion due to precipitation and runoff.
MATERIALS AND METHODS
Description of the study sites
Chuncheon is located in northeastern Korea (N 37°54 and E 127°44 ) covering an agricultural area of ′ ′ 124.7 km
2, while Jeonju with an agricultural area of 50.0 km
2is located in southwestern Korea (N 35°49′
and E 127°09 ) (Fig. 1). The topography of both sites ′ varies from steep forests to nearly level plains.
Chuncheon is at a higher altitude (76.8 m, base MSL) and has more forests than Jeonju (53.5 m, base MSL).
For its agricultural land, Chuncheon consists of 33.6%
paddy fields and 57.2% uplands, while Jeonju has 32.9% paddy fields and 11.6% uplands.
The drainage areas of the study areas have 4,427 ha with 22 hillslopes in Chuncheon and 654 ha with 10 hillslopes in Jeonju while the longitudinal slopes are averages of 11.0 and 9.0%, respectively (Table 1).
At Chuncheon, the soil is a sandy loam with an average of 17.0% clay and 2.0% organic matter.
While, at Jeonju, the soil is a silty loam with 13.8%
clay and 2.0% organic matter. For soil type, Chuncheon have 15 kinds of soil series such as Anryong, Asan, Baegsan, Deogcheon, Gupyeong, Hwangryong, Ihyeon, Neogog, Pungcheon, Sangju, Seogto, Seongsan, Suam, Yeongog, and Yesan. In addition, Jeonju has 7 kinds of soil series with Deogcheon, Ihyeon, Pungcheon,
Year
1965 1970 1975 1980 1985 1990 1995 2000 2005
Annual rainfall (mm)
0 500 1000 1500 2000 2500
Chun-Cheon Jeon-Ju
Fig. 1. Time series of rainfall for Chuncheon and Jeonju
constructed from daily observations from 1966 to 2005.
Seogto, Suam, Yeongog, and Yesan. However, the same crop with corn and soybean are cultivated at both sites with the same conservation tillage.
Model implementation I: Universal Soil Loss Equation (USLE)
The USLE model is an empirical model that was originally developed in 1954 from over 10,000 plot years of data from both natural rainfall and rainfall simulator plots data.
15)This allows one to estimate average annual soil loss for given natural and anthropogenic condition. It is a simple equation of the form:
A = R
・K
・L
・S
・C
・P
Where, A is the computed soil erosion rate per unit basin area commonly expressed in ton ha
-1yr
-1. R is a rainfall erosivity factor calculated by the summation of the erosion index over the period of evaluation (30-min maximum intensity). K is a soil erodibility factor, which is expressed as the average soil loss per unit of the R factor. L is an index of slope length, expressed as the ratio of the expected soil loss to that observed for a field of 22.6-m in length. S is a slope steepness index, the ratio of the expected soil loss to that observed for a field of specified slope (9%). C is a dimensionless cover management factor that is measured as the ratio of soil loss from land cropped under varying cover management conditions. P is a dimensionless conservation practice factor that is expressed as the ratio of soil loss with a specific support practice to the corresponding loss with up- and down- slope culture.
The average R factors of the study sites were calculated using the inverse distance weight method based on 1 km spatial unit TM coordinates from ∑ EI
30of Park.
16)Where E was the total kinetic energy of rainfall and I
30was the 30-minute maximum rainfall intensity. The former was analyzed using the rainfall data in 69 observation stations of Korea Meteorological
Administration (KMA) from 1969 to 1978 and the latter was done in 53 sites from 1973 to 1996 to calculate ∑ EI
30is the MJ mm ha
-1yr
-1hr
-1. The K factors were calculated with the equation modified by Box
17)and this K factor was originally developed by Wischmeier and Smith in 1978. For LS factor, the median value (%) of slope grade of soil phase was converted into slope angle and slope length was determined as the representative value with land use type using soil map (1:25,000). The evaluate the C factor with covered crop, the experimental results from 1977 to 2001 conducted by the Soil Conservation Laboratory in the National Academy of Agricultural Science (NAAS) on field lysimeter plots were collected. The C factor was calculated and it was applied on a national scale to yield estimation. The average C factor for a province was estimated by average over cultivated area and C factor of major crops. The P factors for croplands were determined using the results of NAAS from 1976 to 1999 by lysimeter studies.
Model implementation II: Water Erosion Prediction Project (WEPP) model
The WEPP model for estimating soil erosion and water runoff has been a good predictor of soil erosion at time scales ranging from individual events to long-term average annual.
13,18)The model is composed of several components taking into account climate, hydrology and water balance, plant growth with residue decomposition and agricultural practices, in addition to soil composition and consolidation.
WEPP is a physical-based, continuous daily simulation computer software program for estimating sheet and rill erosion by water. Many examples of WEPP application could be found in the scientific literature, including: the influence of different soil uses on model results (Lindstrom et al., 1999); the calibration of some variable sin situations different than those initially provided with the model, such as transport Table 1. Description of the soil and crop management used in this study
Location Total area (ha) Average slope (%) Soil texture
1)Crop / Management
1)Chuncheon 4,427 11.0 Sandy loam Corn, soybean / conservation tillage
Jeonju 654 9.0 Silty loam Corn, soybean / conservation tillage
1)
Based on county soil surveys from National Institute of Agricultural Science & Technology of Korea, soils on which
crops are successfully grown.
capacity in rill shallow water
19)and erodibility parameters in rangeland;
18)and the calibration of parameters regarding infiltration and runoff processes.
19)Runoff and soil loss resulting from individual storm events are calculated and accumulated, and also the outputs by day, month, and year over the entire simulation period are available. Both temporal and spatial soil detachment and/or deposition are predicted.
13)The Hillslope version (v2006.5) of the WEPP model
13)with its Windows-based Graphical User Interface was used in this study. In order to run the model, it was necessary to prepare four different input files for climate, soil, slope, and crop manage- ment. The Meteorological Information Web Service System-Disaster Prevention (MISS-DP) of KMA was able to provide the needed daily information such as precipitation, temperature, solar radiation, and wind data required to drive the hydrology and plant growth components of the WEPP model. The NAAS of Korea is the source of publicly available soil, slope, and cropping management input data required for this study.
20)A summary of the two selected models, USLE and WEPP, is listed in Table 2.
RESULTS AND DISCUSSION
Patterns of annual precipitation
Baseline climate was determined using measured daily precipitation, maximum temperature, and minimum temperature at the Chuncheon and Jeonju weather stations between 1966 and 2005. Mean annual precipi- tation in Chuncheon and Jeonju was 1,305 and 1,291 mm from 1966 to 2005, respectively. The annual pre- cipitation at Chuncheon was similar to Jeonju except for a few years (Fig. 1).
The change of precipitation in winter (October-March) on a monthly basis was uniform for both sites (Fig.
2), and the mean precipitation in Jeonju was slightly
higher than that in Chuncheon. However, the precipitation change was not uniform in the summer months (April-September), while in July and August, the mean precipitation at Chuncheon was much higher than that in Jeonju in July and August. The overall pattern is quite similar to that of monthly total precipitation for the sites. In fact, the overall increase of summer precipitation in Chuncheon and Jeonju can be attributed to an increase in precipi- tation amount on wet days and an increase in the number of wet days on average during the summer season. However, the average precipitation on wet days for the winter season in Jeonju was a little higher than that in Chuncheon. This indicates a higher soil loss potential for hillslopes in Jeonju during the winter season.
Comparison of USLE and WEPP average annual soil erosion predictions
Soil loss estimates were computed for each hillslopes in Chuncheon and Jeonju for comparisons of the USLE and WEPP on average annual soil erosion. Table 3 shows a comparison of average annual soil erosion in Chuncheon and Jeonju as predicted by the USLE with WEPP. The average annual soil
Table 2. Main properties of both erosion prediction models used in this study Model Model type Scale of
application Hydrology
processes Erosion
processes Level of data
input Use in Korean institute
USLE Empirical Hillslope Infiltration excess
(Hortonian) Sheet and rill Low Basis for erosion assessment from 1993
to 1997 WEPP Physical based ‐ Hillslope to
small catchment Infiltration
excess Sheet and rill High Not used
Month
Jan Feb Mar Apr May Jun Jul Aug Sep Oct Nov Dec
Precipittion (mm)
0 50 100 150 200 250 300 350 400
Days/Month with precipitation
0 2 4 6 8 10 12 14 16 18 20 Prec. of Chun-Cheon
Prec.of Jeon-Ju Days woth prec. of Chun-Cheon Days with prec. of Jeon-Ju
Fig. 2. Mean monthly precipitation, monthly means of
precipitation, and number of days with precipitation in
Chuncheon and Jeonju for 1966 2005. ‐
erosion predicted by the USLE over all hillslopes in Chuncheon was 24.8 ton ha
-1yr
-1(ranging from 1.8 to 63.1 ton ha
-1yr
-1) while WEPP predicted average annual soil erosion was 16.5 ton ha
-1yr
-1(ranging from 2.0 to 35.3 ton ha
-1yr
-1). In Jeonju, the average annual soil erosion predicted by the USLE was 23.5 ton ha
-1yr
-1(ranging from 2.4 to 59.1 ton ha
-1yr
-1), while WEPP predicted average annual soil erosion was 23.4 ton ha
-1yr
-1(ranging from 5.1 to 58.6 ton ha
-1yr
-1).
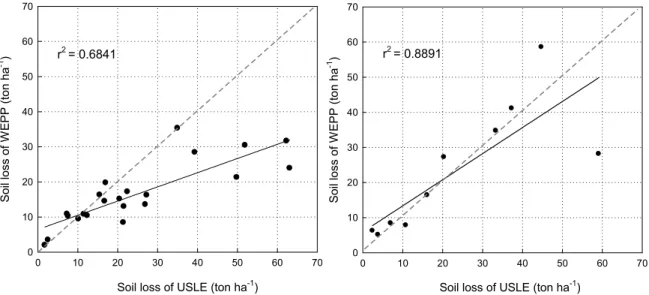
Figure 3 shows a comparison of USLE soil erosion estimates and WEPP predicted average annual soil erosion over all study sites in Chuncheon and Jeonju.
There was a little variability between the estimates in Chuncheon (r
2=0.6841) and Jeonju (r
2=0.8891). There are a number of factors that could cause these differences. WEPP uses a much different prediction approach, and hence uses far different characteristics of the soil and slope for estimating soil erosion.
Especially, the range of management systems and the
selection method of management systems while based on the USLE, would not always produce the same management system used in the USLE, and hence would contribute to the variability shown in Fig. 3.
CONCLUSIONS
Accurate estimation of soil erosion due to water is very significant in several environmental contexts, such as the assessment of potential soil loss from cultivated lands and the evaluation of the loss of crop productivity and soil quality. However, reliable prediction of the quantity and rate of water-induced erosion from land surface into streams and rivers is difficult, expensive and time consuming, particularly in Korea because of very complex land-use and cover types exist within small scale of lands. On top of the wide usage of USLE, WEPP model has been exten- sively used recently in Korea as a very powerful tool to predict estimation of soil loss. However, the WEPP Table 3. Average annual soil erosion in Chuncheon and Jeonju as given in the USLE with WEPP predicted average annual soil erosion
Location Mean soil loss by USLE
(ton ha
‐1yr
‐1) Mean soil loss by WEPP (ton ha
‐1yr
‐1)
Chuncheon 24.8
(1.8 ~ 63.1) 16.5
(2.0 ~ 35.3)
Jeonju 23.5
(2.4 ~ 59.1) 23.4
(5.1 ~ 58.6)
Soil loss of USLE (ton ha-1)
0 10 20 30 40 50 60 70
Soil los s of W EPP (t on ha
-1)
0 10 20 30 40 50 60 70
r
2= 0.6841
0 10 20 30 40 50 60 70
0 10 20 30 40 50 60 70
Soil los s of W EPP (ton ha
-1)
Soil loss of USLE (ton ha-1)