Comparative Study and Simulation of P&O Algorithm using Boost Converter for a Photovoltaic System
Batdelger Ganzorig1, Han-Jung Song1*
<Abstract>
The excessive need of power is creating an unbalance situation in power sector, where solar energy is one of the best solutions among other energy sources to mitigate this demand. It is globally accepted because of its flexibility and long life compared to others. A lot research is going on to enhance the energy efficiency by introducing photovoltaic (PV) power generation technology, but still irradiation of PV power is the major problem. In this manuscript, we have designed PV module using single diode methodology and also the solar conversion efficiency was boosted with maximum power point tracking (MPPT) by using perturb and observe (P&O) algorithm.
The simulation was done for 1000W/m2 and 800W/m2 at solar irradiance in cell temperature of 25C and 40C degree levels in PSIM tool.
Keywords : Photovoltaic (PV) system; Maximum Power Point Tracking system (MPPT);
Perturb and Observe algorithm (P&O); PSIM; Boost converter
1 Department of Nanoscience and Engineering, Inje University E-mail: [email protected]
1* Corresponding Author, Department of Nanoscience and Engineering, Inje University Zip Code: 50834
E-mail: [email protected], Tel: 010-7778-0202
1. Introduction
Last decade, it is noticed that the consumption of petroleum and its products are increasing rapidly, and if quickly it is not controlled then there would be large scarcity of the products in coming year 2040[1]. So, to overcome the crises and environmental pollution, researches are going on to generate electricity by some other medium, which is not hazardous such as PV system.
Photovoltaic(PV) power generation technology is capable to convert light into electricity without any emissions[2,3]. The factors which is affecting PV module is solar radiation intensity, cell temperature and the output voltage. Therefore, we must consider the same factor before designing PV arrays [3,5].
Previously many research groups have preferred circuit-based approach to depict PV module but it results, not prominent in the varying atmospheric conditions [2,6]. Thus, maximum power point tracking (MPPT) technology has been incorporated to avoid such interference. In-spite of many algorithms, perturb and observe (P&O) based algorithm is used because of its simplicity and effective implementation [7,9]. The paper focuses on the successful simulation of P&O (perturb and observe) MPPT algorithm by the boost converter for maximum utilization of available power using PSIM software. The comparative study of the solar irradiance with 1000W/m2 and 800W/m2 was also done at the cell temperature of 25C and 40C.
The organization of this papers is as follows: Introduction 1, Section 2, describes the PV module, Section 3, Boost converter, Section 4, explains MPPT tracking, Section 5, Designing and results and Section 6, concludes the paper.
2. Modelling of photovoltaic module
The photovoltaic (PV) cell is fabricated by the semiconductor materials, with sandwich structure of n-type junction and p-type junction. The photovoltaic system can produce power in exposing to sun rays by the photovoltaic effect as depicted in Figure 1(a). The mathematical description of I-V characteristics of the solar cell is given below Figure 1(b): The V-I characteristic of a solar cell is given by Eq.(1)
××
×
×
(1)
Where:
V and I represent the output voltage and current of the solar cell respectively. Rs and Rsh are the series and shunt resistance of the cell.
q : the electron charge, × Io : the reverse saturation current(A) IL : Light-generated current(A)
T : Cell temperature in Celsius n,k : Ideality constant and Boltzmann’s
constant, ×
Fig. 1(a) Structure of Photovoltaic cell
Fig, 1(b) Equivalent circuit of Solar cell.
3. Boost converter and fundamental operation
The boost converter or step up converter controls the DC output from the unregulated DC input source by simply regulating its duty cycle. Duty cycle (D) of power device is the ratio of ON-time to the total time of any cycle, it can be calculated from equation 2.
(2)
Fig. 2 The diagram of boost converter
Figure 2 shows the mode operation of boost converter, where the boost converter is connected to the solar panel and resistive load.
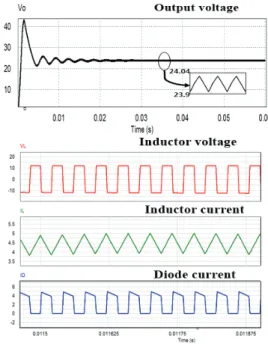
Fig. 3 The output waveforms of boost converter
Figure 3 shows the output waveforms of voltage, and inductor voltage, diode current and inductor current.
4. Model of MPPT tracking and P&O algorithm
The P&O algorithms are generally practiced in MPPT because of its simple structure and ease in the implementation. It is depending on the incrementing and decrementing the
perturbation of Voltage(V) and Current (I) and also perceiving results of disturbance on measured power.
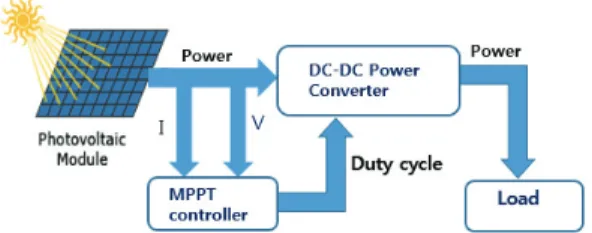
MPPT techniques are used to increase the effective utilization of solar panels. Here in the maximum power is extracted from the module and transferred to the load. The interfacing device(DC/DC converter) is used, by changing the duty cycle, load impedance to match with source impedance for receiving maximum power.
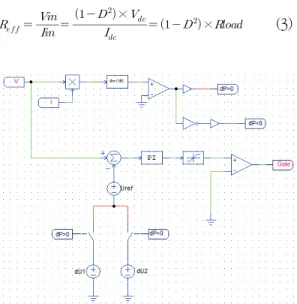
The formula of impedance matching is given in equation 3, where Reff presents the effective resistance of module.
×
× (3)
Fig. 4 P&O algorithm implemented by analog blocks
PERTURB & OBSERVE TECHNIQUE It is very prominent technique, which can be implemented by utilizing very less number of sensors. Two important points need to be
considered before the applying P&O method.
The algorithm should imply with high sampling rates and second the response time of the MPPT power converter should be very fast, although keeping the switching frequency in low mode. Hence the algorithm is produced by perturbing very small increment in voltage of PV and witnessing resultant change in power. If ΔP is positive, then perturbation will lead towards maximum power point and if ΔP is negative, then operating point has moved away from maximum point. So, perturbation should be reversed to return back to maximum point [4]. The flowchart of P&O technique is represented in Figure 5, here in the voltage perturbation is corresponding to change in duty cycle.
Fig. 5 flowchart of P&O algorithm
P&O algorithm is implemented and shown in flowchart Fig. 5.
5. Simulation model and Result
A. The Model
Simulations of proposed model is carried out in PSIM tool. Fast and affable user interface make PSIM a noble simulation platform in this process. Figure 6 shows the Block diagram of simulation model, designed by panel specification in this solar module utility, available in powersim.
Fig. 6 Block diagram of MPPT controller using boost converter
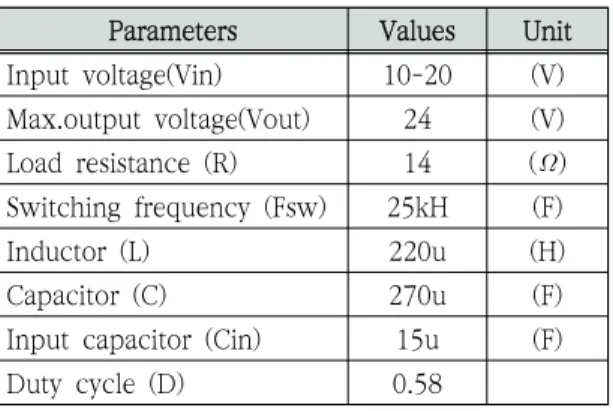
The parameters of the MSX-60 are given in Table 1, which is essential to model the PV array.
The specification(Table 1) of PV panel, Boost converter used for PV module (MSX-60),
and ratings of booster and the output parameters for different irradiance and temperature level are shown in Table 2 and 3.
Cell temperature T=25C Imp(A) V1(V) Pmax1(W) Solar irradiance
2.8 16.4 46.2
Solar irradiance
3.5 16.2 56.8
Table 2. Output parameters of PV array for temperature (T=25C) and different irradiance
Cell temperature T=40C Imp(A) V2(V) Pmax2(W) Solar irradiance
2.8 15.3 42.9
Solar irradiance
3.47 15.1 52.7
Table 3. Output parameters of PV array for
temperature(T=40C) and different irradiance
Figure 7 shows the I-V and P-V array power for 1000W/m2 and 800W/m2 insulation intensity at fixed temperature. It is observed that the output voltage of PV module has great effect with the temperature. The increment in PV module temperature, decreases the output power.
And at 1K temperature leads to approx- imately 0.6 to 0.8% decrement in electrical efficiency while PV output current shows the linear relationship. Maximum power point (MPP) is a main factor for I-V and P-V array curve.
Parameter Variable Value
Typical Maximum Power P(max) 60W Voltage at Max.Power V(mpp) 17.2V Current at Max.Power I(mpp) 3.5A Minimum Power Rating P(min) 58W Short circuit current I(sc) 3.8A Open circuit voltage V(oc) 21.2V Number of cells in array Nc 36 Table 1. Specification of photovoltaic panel
Therefore, we need to track the MPP continuously under different environmental variations to receive the maximum output from PV array.
Parameters Values Unit
Input voltage(Vin) 10-20 (V)
Max.output voltage(Vout) 24 (V) Load resistance (R) 14 () Switching frequency (Fsw) 25kH (F)
Inductor (L) 220u (H)
Capacitor (C) 270u (F)
Input capacitor (Cin) 15u (F)
Duty cycle (D) 0.58
Table 4. Specification of boost converter
On the other hand, the simulation of boost converter is carried out using resistive load MPPT in PSIM (Figure 8). The PV panel output is boosted to 24V DC by using boost converter.
B. Waveforms showing simulated output for different irradiance and temperature levels
The proposed model is simulated for two different irradiance: 1000W/m2, 800W/m2 at cell temperature of 25, 40-degree levels simultaneously. The simulated waveforms of output power without MPPT and with MPPT algorithm, at 0.5 duty cycle is shown in Figure [ 9, 10, 11, 12, 13]. It is quite feasible from the output waveforms with MPPT algorithm can efficiently track the output power to provide maximum outputs different irradiance and temperature.
Fig. 9 The irradiance levels during simulation with time[1000W/, 800W/].
Fig. 7 The typical I-V and P-V curve of solar cell with different irradiance
Fig. 8 Full schematic of boost converter with MPPT control on PSIM
From the various simulation results for different solar irradiance and constant cell temperature it is clear that output power of the PV module and Boost converter increases with increasing solar irradiance.
For these levels of irradiation and the following figure represents the maximum power in the output of PV array and boost converter.
Fig. 10 PV array power of without P&O algorithm for different irradiance level at T=25C.
Fig. 11 Output power of with P&O algorithm for different irradiance level at T=25C.
The change of cell temperature 40 degree is presented in the Figure 12, 13, for different irradiance.
Fig. 12 PV array power of without P&O algorithm for different irradiance level at T=40C.
Fig. 13 Output power of with P&O algorithm for different irradiance level at T=40C.
Table 5, 6 shows the comparison between PV array power and output power, with MPPT and without MPPT algorithm under two different (25° and 40°) cell temperature.
Table 5. Comparing PV power and output power under cell temperature T=25C
Irradiance(W/m2) no MPPT With MPPT
800 27.3W 28.5W
1000 28.3W 29.6W
Table 6. Comparing PV power and output power under cell temperature T=40C
Irradiance(W/m2) no MPPT With MPPT
800 23.1W 25.4W
1000 24.9W 26.5W
6. Conclusion
In summary, the P&O algorithm with MPPT and without MPPT under current regulation is implemented using boost converter. The PSIM software with boost converter as power conditioning unit and also results at constant duty cycle of 50%. The simulation result that the P&O algorithm can be achieved and maintained by the operation of PV at maximum power point. Irradiation increment gradually increases the PV power, but on the other hand increase in temperature will decrease the PV power slowly. The effect of variation in temperature and irradiance in output power is also noticed. The output result reveals that the output power for 1000W/ and 800W/ at solar irradiance in cell temperature of 25 and 40-degree maximize with MPPT algorithm. In this process the results were also verified with the theoretical calculations. Finally it may be concluded that the proposed system with MPPT algorithm is capable to track the PV module efficiently for receiving maximum power.
Acknowledgment
The CAD tool was support by IC Design Education Center (IDEC).
References
[1] A. Attou, A. Massoum and M. Saidi,” Photovoltaic Power Control Using MPPT and Boost Converter”, Balkan Journal of Electrical & Computer Engineering, Vol.2, No.1, pp.222-231. September 2014.
[2] “Introduction to Photovoltaic Systems Maximum Power Point Tracking” Texas Instruments application Report, SLVA446 – November 2010 [3] Roberto F. Coelho, Filipe Concer, Denizar C.
Martins,” a study of the basic dc-dc converters applied in maximum Power point tracking”, Desember 2009 IEEE.
[4] Patil Narsingrao, Dr.R.C. prasad,”Design and Implementation of MPPT Algorithm for Solar Energy System”, IJARCSSE, vol 3, issue 10, October 2013.
[5] Manish Srivastava, Sunil Agarwal, Ekta Sharma,” Design and Simulation of Perturb and Observe MPPT Algorithm for 72 Cell Solar PV System”, International Journal of Soft Computing and Engineering (IJSCE), ISSN:2231-2307, Vol 4, Issue 6, January 2015.
[6] Mohammed A. Elgendy, Bashar Zahawi, Senior Member, IEEE, and David J. Atkinson.”
Assessment of Perturb and Observe MPPT Algorithm Implementation Techniques For PV Pumping Applications”, IEEE transactions on sustainable energy, Vol. 3, No. 1, January 2012.
[7] Kavita Nanshikar, Aditi Desai “Simulation of P&O Algorithm using Boost Converter”. Vol 4, Special Issue 2, April 2016.
[8] Muhammad H. Rashid, “Power electronics circuits, devices, and applications”, pp. 190-194.
[9] A. Barchowsky, J. P. Parvin, G. F. Reed, M. J.
Korytowski, B. M. Grainger, “A Comparative Study of MPPT Methods for Distributed Photovoltaic Generation”, 2011 IEEE.
[10] R.Sakthivel, Dr. S. Ramamoorthy “Design and Implementation of Mppt Controller with Monitoring and Control of PV Modules Using
Embedded Wireless Communication” IOSR Journal of Electrical and Electronics Engineering (IOSR-JEEE), Volume 9, Issue 2 Ver. IV (Mar–
Apr. 2014), pp. 34-46.
(Manuscript received March 5, 2019;
revised May 15, 2019; accepted June 3, 2019)