Elucidation of Bacterial Pneumonia-Causing Pathogens in Patients with Respiratory Viral Infection
Hwa Sik Jung, M.D.
1, Byung Ju Kang, M.D.
1, Seung Won Ra, M.D.
1, Kwang Won Seo, M.D.
1, Yangjin Jegal, M.D.
1, Jae-Bum Jun, M.D.
1, Jiwon Jung, M.D.
1, Joseph Jeong, M.D.
2, Hee-Jeong Jeon, M.D.
1, Jae-Sung Ahn, M.D.
1, Taehoon Lee, M.D.
1and Jong Joon Ahn, M.D.
1Departments of
1Internal Medicine and
2Laboratory Medicine, Ulsan University Hospital, University of Ulsan College of Medicine, Ulsan, Korea
Background: Bacterial pneumonia occurring after respiratory viral infection is common. However, the predominant bacterial species causing pneumonia secondary to respiratory viral infections other than influenza remain unknown. The purpose of this study was to know whether the pathogens causing post-viral bacterial pneumonia vary according to the type of respiratory virus.
Methods: Study subjects were 5,298 patients, who underwent multiplex real-time polymerase chain reaction for simultaneous detection of respiratory viruses, among who visited the emergency department or outpatient clinic with respiratory symptoms at Ulsan University Hospital between April 2013 and March 2016. The patients’ medical records were retrospectively reviewed.
Results: A total of 251 clinically significant bacteria were identified in 233 patients with post-viral bacterial pneumonia.
Mycoplasma pneumoniae was the most frequent bacterium in patients aged <16 years, regardless of the preceding virus type (p=0.630). In patients aged ≥16 years, the isolated bacteria varied according to the preceding virus type. The major results were as follows (p<0.001): pneumonia in patients with influenza virus (type A/B), rhinovirus, and human metapneumovirus infections was caused by similar bacteria, and the findings indicated that Staphylococcus aureus pneumonia was very common in these patients. In contrast, coronavirus, parainfluenza virus, and respiratory syncytial virus infections were associated with pneumonia caused by gram-negative bacteria.
Conclusion: The pathogens causing post-viral bacterial pneumonia vary according to the type of preceding respiratory virus. This information could help in selecting empirical antibiotics in patients with post-viral pneumonia.
Keywords: Viruses; Influenza; Pneumonia
Address for correspondence: Taehoon Lee, M.D.
Division of Respiratory and Critical Care Medicine, Department of Internal Medicine, Ulsan University Hospital, University of Ulsan College of Medicine, 877 Bangeojinsunhwan-doro, Dong-gu, Ulsan 44033, Korea
Phone: 82-52-250-7029, Fax: 82-52-250-7048, E-mail: [email protected] Address for co-correspondence: Jong Joon Ahn, M.D.
Division of Respiratory and Critical Care Medicine, Department of Internal Medicine, Ulsan University Hospital, University of Ulsan College of Medicine, 877 Bangeojinsunhwan-doro, Dong-gu, Ulsan 44033, Korea
Phone: 82-52-250-7029, Fax: 82-52-250-7048, E-mail: [email protected]
Received: Feb. 27, 2017, Revised: May. 30, 2017, Accepted: Jun. 29, 2017, Published online: Sep. 1, 2017
cc
It is identical to the Creative Commons Attribution Non-Commercial License (http://creativecommons.org/licenses/by-nc/4.0/).
Copyright © 2017
The Korean Academy of Tuberculosis and Respiratory Diseases.
All rights reserved.
Introduction
Respiratory viral infection is a significant etiology for community-acquired pneumonia
1-3. With the development of detection techniques, respiratory viruses have been detected in 10%–30% patients with community-acquired pneumonia
4,5. Respiratory virus infections are also a frequent cause of bacte- rial pneumonia. In a systematic review of previous studies, the proportion of bacterial pneumonia in patients with influenza was found to range between 11% and 35%
6.
In a study of pandemic and seasonal influenza virus infec- tions, the most common bacterial pathogens found in pa- tients with post-influenza pneumonia were Staphylococcus aureus and Streptococcus pneumoniae
7,8. Elucidation of the
pneumonia-causing pathogens in patients with respiratory viral infection is important, because respiratory viral infection complicating bacterial pneumonia is associated with a worse prognosis and high mortality rate compared with respiratory viral infection only
9, although the prognosis can be improved with early and appropriate empirical antibiotic treatment
7,9,10. However, the predominant bacterial species causing pneu- monia secondary to respiratory viral infections other than in- fluenza remain unknown. Accordingly, the aim of the present study was to know whether the pathogens causing post-viral bacterial pneumonia vary according to the type of preceding respiratory virus.
Materials and Methods
1. Study subjects
The primary study subjects were 5,298 patients, who under- went multiplex real-time polymerase chain reaction (PCR)
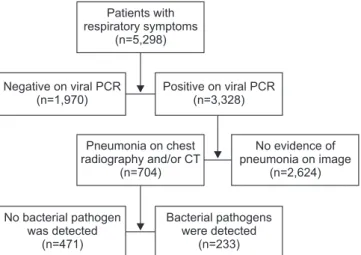
for simultaneous detection of respiratory viruses, among who visited the emergency department or outpatient clinic with respiratory symptoms at Ulsan University Hospital from April 2013 to March 2016 (Figure 1). The medical records of all these patients were retrospectively reviewed in detail.
2. Multiplex real-time PCR for the detection of respiratory viruses
We used a commercial multiplex real-time PCR kit (LG Life Sciences, Seoul, Korea) that can simultaneously detect nine respiratory viruses (adenovirus, bocavirus, coronavirus, type A influenza virus, type B influenza virus, human metapneu- movirus [hMPV], parainfluenza virus, human rhinovirus, and respiratory syncytial virus [RSV]) in respiratory specimens.
3. Definition of post-viral pneumonia and post-viral bacterial pneumonia
Using chest radiography and/or computed tomography (CT) performed within 48 hours of the hospital visit, patients meeting one or more of the following criteria were assigned a diagnosis of pneumonia: new or progressive infiltrates (lobar, lobular, nodular, or diffuse), increased interstitial lung mark- ing (unilateral>bilateral), and pleural effusion and loculated fluid collection on radiographs and/or CT images
11,12. Post- viral pneumonia was defined as the presence of pneumonia (as described above) in a patient with respiratory viral infec- tion. Post-viral bacterial pneumonia was defined as the above (post-viral pneumonia) plus simultaneous detection of patho- genic bacteria in a respiratory specimen.
4. Investigation of pneumonia-causing bacterial pathogens To know bacterial pneumonia-causing pathogens in pa- tients with respiratory viral infection, the results of the follow- ing tests performed within 48 hours of the hospital visit were investigated for patients with virus positivity and (radiological) pneumonia (i.e., post-viral pneumonia): culture for gram-pos- itive or gram-negative bacteria (blood, sputum, endotracheal aspirate, bronchoalveolar lavage or washing, or pleural fluid), serum enzyme immunoassay (EIA) for the detection of IgM of Chlamydia pneumoniae and Mycoplasma pneumoniae, PCR of respiratory secretions for the detection of C. pneumoniae and M. pneumoniae, and detection of urinary antigens for Legionella pneumophila and S. pneumoniae
2. Coagulase-neg- ative staphylococci and viridans streptococci were excluded from the analysis because they were considered insignificant.
5. Data analysis
The primary objective of the present study was to determine whether pathogens causing post-viral bacterial pneumonia
Patients with respiratory symptoms
(n=5,298)
Pneumonia on chest radiography and/or CT
(n=704)
No evidence of pneumonia on image
(n=2,624)
No bacterial pathogen was detected
(n=471)
Bacterial pathogens were detected
(n=233) Positive on viral PCR
(n=3,328) Negative on viral PCR
(n=1,970)
Figure 1. Study flowchart. PCR: polymerase chain reaction; CT:
computed tomography.
varied according to the type of respiratory virus. Therefore, we investigated the distribution of bacteria by the type of preced- ing virus in patients with radiological pneumonia. In addition, the incidence of post-viral pneumonia according to the type of respiratory virus and the seasonal and age-specific distribu- tion of respiratory viral infection (to compare data with previ- ous studies) were surveyed.
6. Statistical analysis
Categorical variables are expressed as numbers and per- centages. Fisher exact tests and the chi-square tests were used to evaluate statistical significance. Continuous variables are expressed as means and standard deviations (SD). Indepen- dent t test was used to evaluate statistical significance. All sta- tistical analyses were performed using SPSS version 21.0 (IBM Corp., Armonk, NY, USA). A p-value of <0.05 was considered statistically significant.
Results
Over the 3-year study period (April 2013 to March 2016), respiratory viruses were detected in 3,328 of the 5,298 patients (62.8%) by multiplex real-time PCR. Of the 3,328 patients, 704 (21.2%) were diagnosed with post-viral pneumonia ac- cording to chest radiography and/or chest CT findings (in these patients, nasopharyngeal swab [653/704, 92.8%] and bronchoalveolar lavage/bronchial washing fluid [51/704, 7.2%]
were used to detect respiratory virus). A total of 251 clinically significant bacterial pathogens were identified in 233 of the 704 patients (33.1%) with pneumonia (Figure 1).
1. Respiratory viral infections
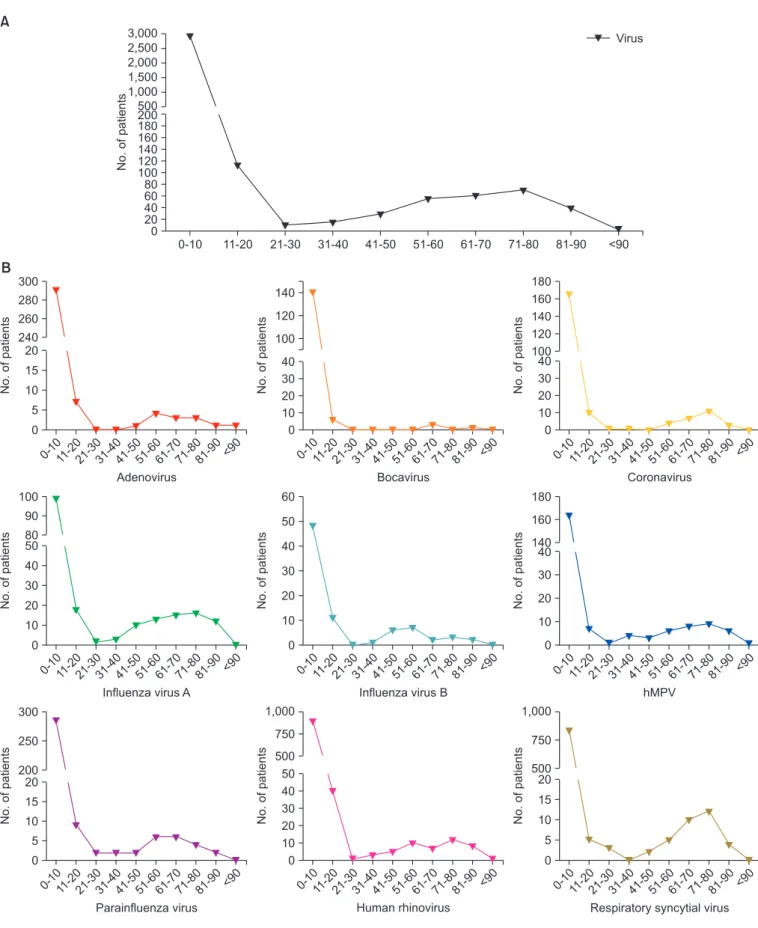
The most common virus identified in the present study was human rhinovirus (29.7%), followed by RSV (26.4%), parain- fluenza virus (9.6%), adenovirus (9.4%), hMPV (6.3%), corona- virus (6.1%), type A influenza virus (5.6%), bocavirus (4.5%), and type B influenza virus (2.4%) (p<0.001) (Table 1, Figure 2).
Regardless of the type of virus, respiratory viral infection showed two age peaks, i.e., <10 years and approximately 60 Table 1. Incidence of post-viral pneumonia and post-viral bacterial pneumonia
Respiratory virus Positive on viral polymerase chain
reaction
Pneumonia on chest radiography and/or computed tomography
(i.e., post-viral pneumonia)
Pneumonia incidence
Detection rate of bacterial pathogens in patients with pneumonia (i.e., post-viral
bacterial pneumonia)
Adenovirus 313 (9.4) 50 (7.1) 50/313 (16.0) 20/50 (40.0)
Bocavirus 151 (4.5) 39 (5.5) 39/151 (25.8) 10/39 (25.6)
Coronavirus 202 (6.1) 44 (6.3) 44/202 (22.3) 19/44 (43.2)
Type A influenza virus 188 (5.6) 59 (8.4) 59/188 (31.4) 25/59 (42.4)
Type B influenza virus 80 (2.4) 20 (2.8) 20/80 (25.0) 9/20 (45.0)
hMPV 209 (6.3) 77 (10.9) 77/209 (36.4) 24/77 (31.2)
Parainfluenza virus 319 (9.6) 61 (8.7) 61/319 (19.1) 17/61 (27.9)
Human rhinovirus 989 (29.7) 172 (24.4) 172/989 (17.4) 73/172 (42.4)
RSV 877 (26.4) 183 (26.0) 183/877 (20.9) 36/183 (19.7)
Total 3,328 (100) 704 (100) 704/3,328 (21.2) 233/704 (33.1)
Values are presented as number (%).
hMPV: human metapneumovirus; RSV: respiratory syncytial virus.
1,000 900 800 700 600 500 400 300 200 100 0
No.ofpatients
Respiratory virus Adenoviru
s
Bocaviru s
Coronaviru s
Influenza viru
sA
Influenza viru
sB hMPV
Parainfluenza viru
s
Human rhinoviru
s RSV
Figure 2. Incidence of respiratory viral infection in the study popu-
lation between April 2013 and March 2016 (p<0.001). hMPV: hu-
man metapneumovirus; RSV: respiratory syncytial virus.
300 280 260 240 20 15 10 5 0
B
Adenovirus 3,000 2,500 2,000 1,500 1,000 500 200 180 160 140 120 100 80 60 40 20 0
No.ofpatients
0-10 11-20 21-30 31-40 41-50 51-60 61-70 71-80 81-90 <90 Virus
A
No.ofpatients
0-10 <90
11-20
21-3031-4041-5051-6061-7071-8081-90
120 100 40 30 20 10 0
Bocavirus
No.ofpatients
0-10 <90
11-20
21-3031-4041-5051-6061-7071-8081-90
180 160 140 120 100 40 30 20 10 0
Coronavirus
No.ofpatients
0-10 <90
11-20
21-3031-4041-5051-6061-7071-8081-90
100
300 90
250 80
200 40
20 30
15 20
10 10
5 0
0
No.ofpatientsNo.ofpatients
0-10
0-10
<90
<90 11-20
11-20 21-30
21-30 31-40
31-40 41-50
41-50 51-60
51-60 61-70
61-70 71-80
71-80 81-90
81-90
60 50 40 30 20 10 0
No.ofpatients
0-10 <90
11-20
21-3031-4041-5051-6061-7071-8081-90
1,000 750 500 50 40 30 20 10 0
No.ofpatients
0-10 <90
11-20
21-3031-4041-5051-6061-7071-8081-90
180 160 140 40 30 20 10 0
No.ofpatients
0-10 <90
11-20
21-3031-4041-5051-6061-7071-8081-90
1,000 750 500 20 15 10 5 0
No.ofpatients
0-10 <90
11-20
21-3031-4041-5051-6061-7071-8081-90
Influenza virus A Influenza virus B hMPV
Parainfluenza virus Human rhinovirus Respiratory syncytial virus
140
50
Figure 3. Age-specific distribution of respiratory viruses. (A) All viruses. (B) Each virus.
years. Infections caused by coronavirus, type A influenza virus, hMPV, human rhinovirus, and RSV occurred not only in infants and children but also in adults aged 60 to 80 years.
However, type B influenza and adenovirus infections showed a different age distribution: they occurred mainly in adoles- cents, middle-aged adults (40–60 years old), and infants and younger children (Figure 3).
Each viral infection exhibited a specific seasonal distribu- tion, as shown in Figure 4. Infections caused by adenovirus, coronavirus, type A influenza virus, and RSV occurred mainly in winter; those caused by bocavirus and hMPV occurred most commonly in spring, and those caused by type B influ- enza virus occurred most commonly in late winter and early
spring (a little later than type A influenza). Parainfluenza infection occurred most commonly in spring and summer, although it was roughly perennial. Rhinovirus infection exhib- ited a perennial pattern.
2. Post-viral pneumonia and post-viral bacterial pneumonia Among the 704 patients with post-viral pneumonia, the most frequent pneumonia-causing virus was RSV (26.0%), fol- lowed by human rhinovirus (24.4%), hMPV (10.9%), parain- fluenza virus (8.7%), type A influenza virus (8.4%), adenovirus (7.1%), coronavirus (6.3%), bocavirus (5.5%), and type B influ- enza virus (2.8%). Patients with hMPV infections exhibited the
Figure 4. Seasonal distribution of respiratory viruses between April 2013 and March 2016 (spring: March–May, summer: June–August, fall:
September–November, winter: December–February).
Bocavirus Coronavirus
Influenza virus A Influenza virus B Metapneumovirus
Parainfluenza virus Rhinovirus Respiratory syncytial virus
100 90 80 70 60 50 40 30 20 10 0
Adenovirus
Incidence(%)
Spring Summer Fall Winter
100 90 80 70 60 50 40 30 20 10 0
Incidence(%)
Spring Summer Fall Winter
100 90 80 70 60 50 40 30 20 10 0
Incidence(%)
Spring Summer Fall Winter
100 90 80 70 60 50 40 30 20 10 0
Incidence(%)
Spring Summer Fall Winter
100 90 80 70 60 50 40 30 20 10 0
Incidence(%)
Spring Summer Fall Winter
100 90 80 70 60 50 40 30 20 10 0
Incidence(%)
Spring Summer Fall Winter
100 90 80 70 60 50 40 30 20 10 0
Incidence(%)
Spring Summer Fall Winter
100 90 80 70 60 50 40 30 20 10 0
Incidence(%)
Spring Summer Fall Winter
100 90 80 70 60 50 40 30 20 10 0
Incidence(%)
Spring Summer Fall Winter
highest incidence of post-viral pneumonia (76/209, 36.4%), followed by patients with type A influenza virus (59/188, 31.4%), bocavirus (39/151, 25.8%), and type B influenza virus (20/80, 25.0%) infections (p<0.001). The rate of bacterial iden- tification (i.e., post-viral bacterial pneumonia) was the highest for patients with type B influenza virus infection (9/20, 45.0%), followed by those with coronavirus (19/44, 43.2%), type A influenza virus (25/59, 42.4%), human rhinovirus (73/172, 42.4%), adenovirus (20/50, 40.0%), and hMPV (24/77, 31.2%) infections (Table 1, Figure 5). Comparing to the patients with post-viral pneumonia, those with post-viral bacterial pneumo- nia received significantly more intensive and ventilator care, and had a higher mortality rate (Table 2).
With reference to previous studies, we divided the patients with post-viral bacterial pneumonia (n=233) into those aged
<16 years (130/233 [55.8%]; mean±SD, 4.66±2.84 years) and those aged ≥16 years (103/233 [44.2%]; mean±SD, 64.91±15.95 years)
13,14. In the <16 year age group, there were 61 boys (47.0%) and 69 girls (53.0%), while in the ≥16 year age group,
there were 65 men (63.0%) and 38 women (37.0%). Four pa- tients (3.0%) in the <16 year age group and 43 (41.0%) in the
≥16 year age group required care in the intensive care unit.
Three patients (2.0%) in the <16 year age group and 26 (25.0%) in the ≥16 year age group required mechanical ventilator care.
During the study period, none of the patients in the <16 year age group died; however, there were 21 deaths (20.3%) in the
≥16 year age group. The baseline characteristics and comor- bidities for our study population are presented in Table 3.
In the <16 year age group, M. pneumoniae was the most fre- quently identified bacterium, regardless of the preceding virus type (p=0.630). In the ≥16 year age group, the isolated bac- teria varied according to the preceding virus type (p<0.001).
Type A influenza preceded bacterial infections with S. aureus (6/21), Klebsiella spp. (4/21), S. pneumoniae (3/21), and Acinetobacter spp. (3/21); type B influenza preceded bacte- rial infections with S. aureus (2/9), S. pneumoniae (2/9), and Acinetobacter spp. (2/9); hMPV infection preceded bacterial infections with S. aureus (4/21), Klebsiella spp. (4/21), and Acinetobacter spp. (4/21); human rhinovirus infection pre- ceded bacterial infections with S. aureus (7/24), Klebsiella spp.
(3/24), C. pneumoniae (3/24), and Pseudomonas spp. (3/24);
coronavirus infection preceded bacterial infections with Acinetobacter spp. (3/13), Klebsiella spp. (3/13), and Pseu- domonas spp. (2/13); parainfluenza virus infection preceded bacterial infections with Acinetobacter spp. (2/10), Klebsiella spp. (2/10), and M. pneumoniae (2/10); and RSV infection preceded bacterial infections with Escherichia coli (3/13), Aci- netobacter spp. (3/13), and Enterococcus spp. (2/13) (Table 4). Distribution of identified bacteria by specimen type was showed at Table 5.
Discussion
As bacterial pneumonia in patients with respiratory viral infection is associated with a poor prognosis and increased mortality, we tried to know whether bacterial pneumonia- causing pathogens varied according to the type of the preced- ing respiratory virus. On the basis of our results, we found that the cause of bacterial pneumonia in adults with respiratory viral infection varies with the preceding virus type. Specifi-
Table 2. Outcome comparison of post-viral pneumonia and post-viral bacterial pneumonia
Post-viral pneumonia (n=471) Post-viral bacterial pneumonia (n=233) p-value
Age, yr 15.38±24.96 31.30±31.87
Male sex 263 (55.8) 126 (54.1) 0.687
Intensive care unit care 44 (9.3) 41 (17.6) 0.002
Ventilator care 32 (6.8) 29 (12.4) 0.015
Death 24 (5.1) 22 (9.4) 0.035
Values are presented as mean±SD or number (%).
100 90 80 50 40 30 20 10 0
Incidence(%)
Adenoviru s
Bocaviru s
Coronaviru s
Influenza Aviru
s
Influenza Bviru
s
Parainfluenza viru
s
Rhinoviru s
RSV
Metapneumoviru s
Detection of bacterial pathogens (%)
Pneumonia on chest radiography and/or CT (%) +