Recent Development in Ultrasonic Guided Waves for Aircraft and Composite Materials
Joseph L. Rose
Abstract Emphasis in the paper is placed on describing guided wave successes and challenges for applications in aircraft and composite materials inspection. Guided wave imaging methods discussed includes line of sight, tomography, guided wave C-scan, phased array, and ultrasonic vibration methods. Applications outlined encircles lap splice, bonded repair patch, fuselage corrosion, water loaded structures, delamination, and ice detection and de-icing of various structures.
Keywords: Ultrasonic, Guided Waves, Aircraft Inspection, Composite Materials
Received: October 27, 2009, Revised: December 17, 2009, Accepted: December 22, 2009. Paul Morrow Professor, Chief Scientist at FBS, Inc, The Pennsylvania State University, 212 Earth and Engineering Science Building, University Park, PA 16802, U.S.A,. (E-mail: [email protected] )
Journal of the Korean Society for Nondestructive Testing Vol. 29, No. 6 (2009. 12)
1. Introduction
Ultrasonic guided waves for aircraft and composite material inspections have come a long way the past decade or so. Many successes have come about but many challenges remain, not half of which are outlined in this paper. Emphases in the paper is on recent developments evolving from research work at Penn State University.
Basic theoretical elements of ultrasonic guided waves can be found in (Rose, 1999), this work serving as a bases for many of the recent developments this past decade. Starting with fundamental understanding of the early popular acoustic-ultrasonic method, work in (Ditri et al., 1994) paved the way for fundamental understanding of the guided wave generation process. In (Ditri and Rose, 1994), guided wave excitation potential in anisotropic layers was introduced, providing a bases for further work in line of sight analysis with optimal wave structure selection, tomography, and phased array work.
Significant advancements in adhesive bond
inspection were presented in (Pilarski and Rose, 1988) showing the benefits of getting shear wave energy into the interface of a bonded structure.
Oblique incidence was used. This led to the introduction of guided waves to direct shear energy into the interface as discussed in (Hansch et al., 1995) and in other papers. Skin to honeycomb core bond inspection was also a critical subject with a possible practical solution outlined in (Hay et al., 2003). A generalized approach of guided waves for aircraft components is highlighted in (Rose and Soley, 2000). In a move to structural health monitoring (SHM), from nondestructive testing, a need for small inexpensive sensors came about. See (Ayhan et al., 2007) and (Gao et al., 2005).
Ultrasonic guided wave tomography entered the
inspection community in (Gao et al., 2005). With
these new sensors and SHM, new techniques of
inspection were introduced. Line of sight,
tomographic, and phased array methods were
introduced. See (Gao et al., 2007). Methods for
mode and frequency selections are summarized
Table 3 Successes – aircraft applications
Demonstration of feasibility studies in lap splice, tear strap, skin to core delamination, corrosion detection and other applications.
Introduction of Ultrasonic Modal Analysis Testing (Linking guided waves to modal vibration analysis)
Guided wave tomographic tests on real aircraft structures
Guided wave ice detection and deicing studies initiated
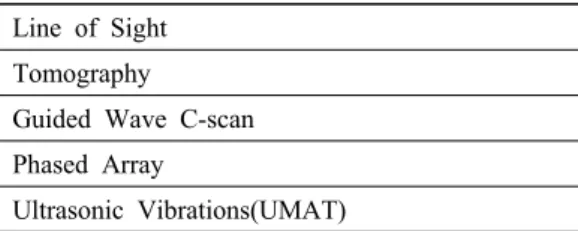
Table 4 Guided wave imaging methods Line of Sight
Tomography
Guided Wave C-scan Phased Array
Ultrasonic Vibrations(UMAT)
in (Gao and Rose), highlighting work on this
subject for over a decade. Real time guided wave phased array methods are reported in (Rose and Yan, 2007) and (Rose and Yan, 2009). Recently, a new ultrasonic vibration method was studied that bridges the gap from transient ultrasonic guided wave analysis to modal vibration methods, achieving benefits of both methods. Novel guided wave applications in aircraft were also introduced in ice detection (Gao and Rose, 2009) and de-icing(Palacios et al., 2008).
2. Successes
Successes in guided waves,in general, over the past decade, are listed in Table 1, in composite materials in Table 2, and in Aircraft Application in Table 3. The topics speak for themselves but aspects of some of the items will be reported in this paper.
Table 1 Successes – guided waves in general Computational developments
Understanding basic principles
Focusing developments in plates and pipes FEM method for wave animations and guided wave focus demonstrations
Demonstration of optimal mode and frequency selections for penetration power, water loading influences, and defect detection sensitivities
Table 2 Successes – composite materials Understanding guided wave behavior in anisotropic media
Using slowness profile variations and skew angle in inspections
Development of ultrasonic guided wave tomographic imaging methods
Phased array methods developed for plates Comb sensor designs for optimal mode and frequency selection (linear comb and annular arrays) Implementation of time delay comb type transducers for composite inspection
3. Physical Concepts and Methodologies
When working with composite materials, beyond phase velocity variation with launch angle direction, is the intriguing concept of a skew angle. See Fig. 1. The stacking sequence in a layered composite material often leads to a skew angle. The wave does not follow the launch angle direction as illustrated in Fig. 1.
Even mild anisotropy leads to significant skewing effects. One goal is therefore to make this complexity become a benefit. The skew effect must be considered in the design of a sensor and inspection test protocol.
Let’s now consider various guided wave
imaging methods as presented in Table 4. Of
primary concern in any guided wave problem is
the selection of an appropriate mode and
frequency to consider for optimal sensitivity to a
certain kind of defect. Wave structure choice to
induce certain kinds of energy at special regions
across the thickness of a layered structure
provides the key to success. Consider for
example the phase velocity dispersion curve
Fig. 1 Lamb wave in anisotropic plate–skew angle for the second symmetric mode at fd=1.05 MHz-mm
Fig. 2 Mode and frequency selection for best sensitivity in adhesive bonding inspection. (Interfacial displacement (in-plane) at AI-epoxy interface in Ti-epoxy-AI specimen)
Fig. 3 Through transmission line of sight data in an adhesive bonding inspection sample problem. (Variable angle beam wedge based inspection)
presented in Fig. 2. Superimposed onto the dispersion curves is the in plane displacement component magnitude, the red color indicating the largest magnitudes over the phase velocity dispersion curve space. In plane displacement was selected as the sensitive feature for interfacial defect detection in a titanium to aluminum bonded structure. The interface defect
simulation was for a kissing bond via a small
Teflon patch insertion at the interface. Notice in
Fig. 2 that one of the best test points is at a
high phase velocity value from 15 to 20 km/s at
a frequency of 2.5 MHz for the sample problem
discussed here. Tests conducted at this point via
an angle beam sensor are shown in Fig. 3. As
shown in Fig. 3, the choice was a good one.
Good vs. bad differentiation of anomalies in the structure looks pretty good.
The ultrasonic guided wave tomographic imaging method is illustrated in Fig. 4. An array of sensors is mounted on a surface randomly surrounding the area of interest whereby each sensor sends energy to all of the others sensors.
An image reconstruction process takes place to produce an image in the interest zone that would lead to such an ensemble of waveforms at each receiving sensor. See (Gao, et al., 2005). Since the process is basically a SHM method a baseline is necessary to compute the image. The baseline is the result before any corrosion occurs as illustrated in Fig. 4. The baseline defect free starting point is not affected by a complex structure such as that presented in Fig. 4a. Many features could be used to produce the image including a signal difference coefficient or a physically based feature, for example, like the ratio of a high frequency portion of a spectrum to a low frequency portion. Feature choice depends on problem statement and subsequent mode and frequency choice for solving a problem.
Air coupled ultrasonic sensor development is becoming of age for composite material inspection. They can also be used to produce guided waves if the situation calls for such.
Impingement angle choice depends on desired wave structure in the composite material to identify certain defect types. See Fig. 5 where a traditional C-scan result is compared favorably with a guided wave C-scan result.
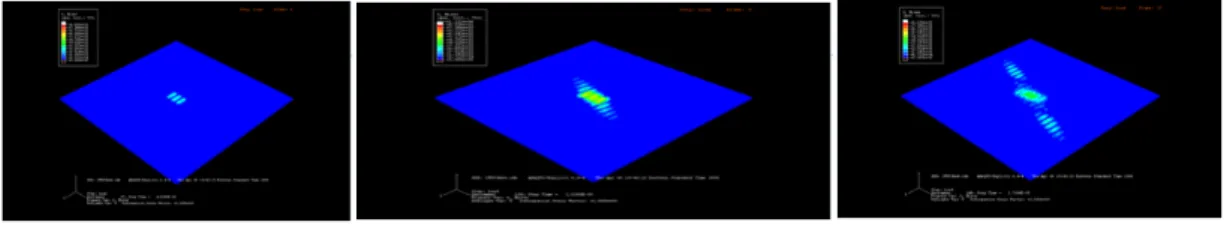
A real time guided wave phased array method also shows great promise in both isotropic and composite material plate inspection.
See (Rose and Yan, 2007). The possibility of steering an ultrasonic guided wave beam around a plate is depicted in Fig. 6. A circular array of small sensors at the center of the plate is pulsed in such a way that appropriate time delay profiles can be used to steer the beam in any predetermined direction. Note that side lobes are present but array designs can be introduced to reduce the side lobe energies. Sample results in
an aluminum plate are shown in Fig. 7. All five defects were easily found. When used in composite structures,multi-mode beam steering might be necessary to account for skew angle influences.
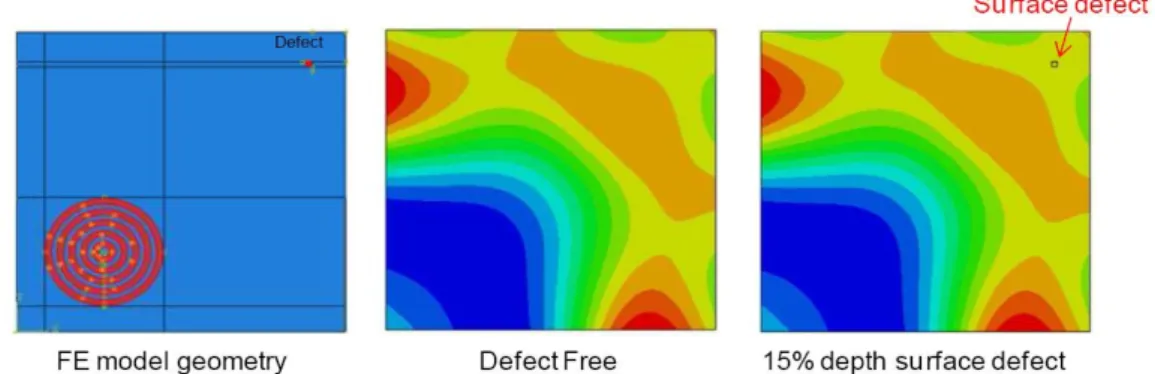
A novel ultrasonic guided wave modal analysis technique(UMAT) is being studied to bridge the gap between ultrasonic transient wave analysis and long time steady state vibration modal analyses. Benefits of both methods are merged as indicated in Table 5.
The structural resonant frequency and modal pattern becomes a function of the selected ultrasonic guided wave loading function and not just a loading frequency. The ultrasonic loading function is based on mode and frequency selection in the phase velocity dispersion curve as a result of wave structure choice for solving a particular problem. It is shown in (Rose, et al., 2010) that wave structures can be preserved after countless reflection factors leading to similar sensitivity in the resulting modal analysis problem via resonant frequency and modal pattern observation.
One interesting result is examined in Fig. 8.
Two different ultrasonic guided wave loading functions are selected, one particularly insensitive to a surface corrosion defect, S0 at 500 kHz, and one sensitive to the defect A0 at 500 kHz, via energy wave structure sensitivity to the surface defect. In this case the modal pattern change is sufficient for finding the defect.
Table 5 A brief comparison of the ultrasonics, modal analysis, and UMAT techniques
Defect detection size
Sender
positions Speed Ultrasonic
Guided Wave Very Small √ Many X Slow X Vibration
Modal Analysis
Large X One √ Fast √
UMAT
Small to intermediate
√
One √ Fast √
(a) Sensor network on inside surface of complex structure
(a) Guided wave air coupled scanning system
(b) Result before corrosion (b) Bulk wave C-scan on left and guided wave
(c) Results after corrosion (c) C-scan on right
Fig. 4 Sample ultrasonic guided wave tomographic results for corrosion detection on the wing of an aircraft
Fig. 5 Air coupled inspection of impact delaminations in an orthotropic plate
Fig. 6 Guided wave beam steering of a 16 element circular array mounted to the center of the plate(partial scan)
Fig. 7 Experimental result of a phased array scanning image obtained by using the wave number domain back-propagation signal synthesis. A 16 element circular array mounted to the center of the plate was used. All defects were detected and located quite well
(a) (Left) FE model geometry for the 500 kHz S0 mode ultrasonic loading function. (Middle) Steady state out-of-plane displacement distribution on the defect free plate. (Right) Steady state out-of-plane displacement distribution on the plate with a 15% through thickness surface defect. Almost no differences can be seen between the defect free result and the defect result
(b) (Left) FE model geometry for the 500 kHz A0 mode ultrasonic loading function. (Middle) Steady state out-of-plane displacement distribution on the defect free plate. (Right) Steady state out-of-plane displacement distribution on the plate with a 15% through thickness surface defect. Significant variations from the defect free result to the defect result can be observed
Fig. 8 FEM UMAT results for ultrasonic loading functions at the same frequency
Table 6 Challenges – guided waves in general
Long numerical solution computation times often necessary with FEM (especially for high frequency, and solutions at long distances from the actuator)
Modeling accuracy is critically dependent on accurate input parameters – (especially for anisotropic and viscoelastic properties, interface conditions, and defect characteristics.)
Signal interpretations often difficult (due to multimode propagation and mode conversion, along with special test structure geometric features)
Mode and frequency selection for optimal penetration power and defect detection sensitivity for certain defects and structures
Low frequency limitation for thick structures Equipment cost and reliability
Sensor robustness to environmental situations like temperature and humidity Sensor robustness to high stress, mechanical vibrations, shock and radiation Adhesive bonding challenges for mounting sensors and sustainability
Sensor type and development for achieving the desired guided wave mode and frequency (especially considering source influence, side lobes, and multimode generation potential)
Guided wave propagation in structures with variations in cross-sectional areas, (horn shaped pipe, plates with variations in thickness, etc.)
Development of regulatory codes Educational level and inspector training
Lack of realistic mock-up tests specimens for training and test developments
Table 7 Challenges – composite materials
Dealing with complex anisotropy and wave velocity and skew angle as a function of direction Viscoelastic influences
Penetration power due to anisotropy, viscoelasticity, and inhomogeneity
Optimal mode and frequency selection and the corresponding transducer designs for certain defects and structures
Differentiating critical composite damage such as delamination defects from structural variability during fabrication (including minor fiber misalignments, ply-drops, inaccurate fiber volume fraction, and so on) Guided wave inspection of composites with unknown material properties.
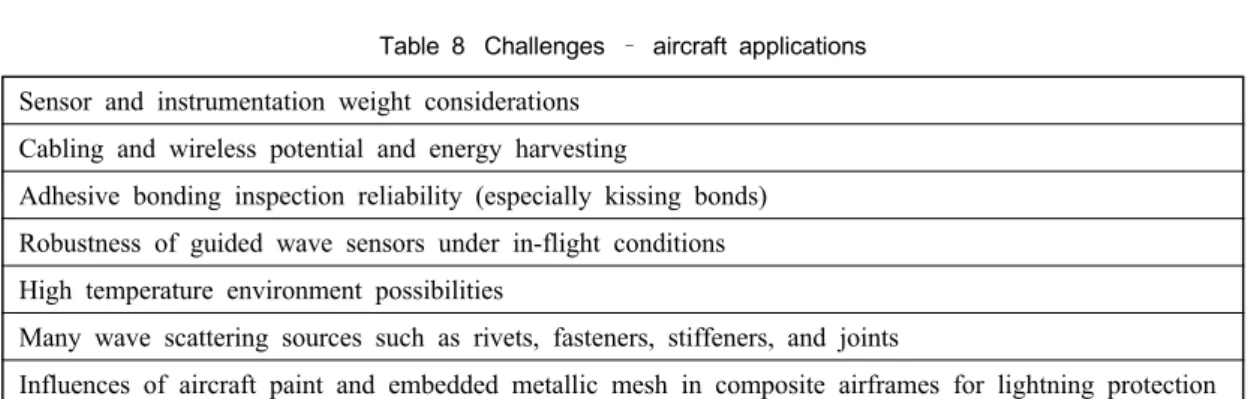
Table 8 Challenges – aircraft applications Sensor and instrumentation weight considerations
Cabling and wireless potential and energy harvesting
Adhesive bonding inspection reliability (especially kissing bonds) Robustness of guided wave sensors under in-flight conditions High temperature environment possibilities
Many wave scattering sources such as rivets, fasteners, stiffeners, and joints
Influences of aircraft paint and embedded metallic mesh in composite airframes for lightning protection