• 검색 결과가 없습니다.

Analysis Model Evaluation based on IoT Data and Machine Learning Algorithm for Prediction of Acer Mono Sap Liquid Water

N/A
N/A
Protected

Academic year: 2021

Share "Analysis Model Evaluation based on IoT Data and Machine Learning Algorithm for Prediction of Acer Mono Sap Liquid Water"

Copied!
10
0
0

로드 중.... (전체 텍스트 보기)

전체 글

(1)

1. INTRODUCTION

The sap industry is on the constant rise world- wide. In South Korea, mountains account for 75%

of its land and make a repository of resources.

Businesses using these mountain resources are in- creasing exponentially every year[1-3]. Acer mono max is one of the important tree species to collect quality sap from and has long been the source of high value added income for farmers in mountain villages. Old books record that the Hwarang mem- bers drank acer mono sap in Silla. As acer mono sap has been developed in various forms including health drinks and enjoyed by common people in re-

cent years, it is widely collected in mountain vil- lages of Gangwon, Jeolla, and Gyeongsang prov- inces where the acer mono max. is usually found.

Since the acer mono sap collection business is mostly led by individual farmers, there is no pro- fessional management system involved in most cases[4-5]. One of the reasons for the absence of professional management system is that most of acer mono trees are distributed in rough mountain areas. Access to acer mono trees is very limited since they are distributed in areas of high altitude and low density rather than natural colonies. In re- searches on the estimated time and volume of acer mono sap collection, it seems impossible to make

Analysis Model Evaluation based on IoT Data and Machine Learning Algorithm for Prediction

of Acer Mono Sap Liquid Water

Han Sung Lee

, Se Hoon Jung

††

ABSTRACT

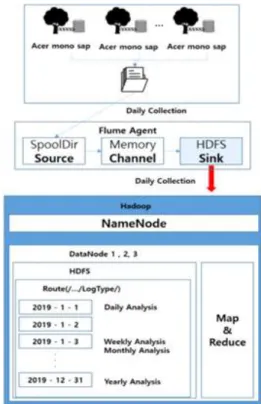
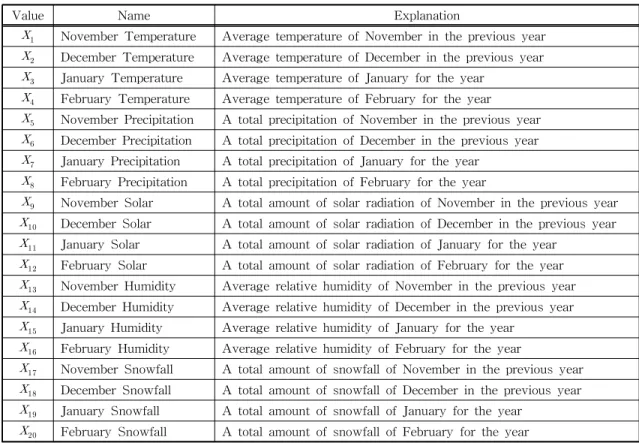
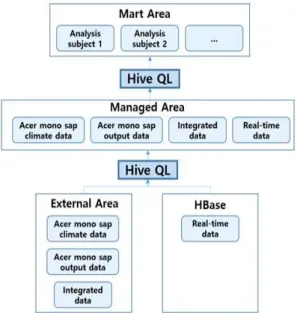
It has been increasingly difficult to predict the amounts of Acer mono sap to be collected due to droughts and cold waves caused by recent climate changes with few studies conducted on the prediction of its collection volume. This study thus set out to propose a Big Data prediction system based on meteorological information for the collection of Acer mono sap. The proposed system would analyze collected data and provide managers with a statistical chart of prediction values regarding climate factors to affect the amounts of Acer mono sap to be collected, thus enabling efficient work. It was designed based on Hadoop for data collection, treatment and analysis. The study also analyzed and proposed an optimal prediction model for climate conditions to influence the volume of Acer mono sap to be collected by applying a multiple regression analysis model based on Hadoop and Mahout.

Key words: Acer Mono Sap, Analysis Model, IoT Data, Machine Learning, Hadoop

※ Corresponding Author : Se Hoon Jung, Address:

(36729) 1375 Gyeongdong-ro, Andong-si, Gyeongsnagbuk- do, Korea, TEL : +82-54-820-6894, FAX : +82-54-820- 6825, E-mail : [email protected]

Receipt date : Aug. 28, 2020, Revision date : Sep. 8, 2020 Approval date : Sep. 10, 2020

††

School of Computer Eng., Youngsan University (E-mail : [email protected])

††

School of Creative Convergence, Andong National University

※ This work was supported by a Research Grant of Andong National University and This paper is an ex- tended version of a conference paper published in S. H.

Jung, K. H. Jo, J. C. Kim, C. Y. Kim, and C.B. Sim, A

Novel on Data Analysis Model based on Weather

Information and Hadoop for Prediction of Acer Mono Sap

Liquid Water, Proceedings of 7th Japan-Korea Joint

Workshop on Complex Communication Sciences(JKCCS

2019), 157-160, 2019.

(2)

accurate predictions due to the geographical envi- ronment, which also explains why there are few researches to analyze the management and effi- ciency of acer mono tree collection. Previous stud- ies on acer mono sap focused on the analysis of its components and on its distribution, and there is a shortage of research on the vegetation and lo- cation environment of an area where acer mono max. grows naturally or productivity according to the location conditions[6-7]. And the importance of effective utilization of meteorological information is growing in the management of agricultural prod- ucts due to droughts and cold waves following cli- mate changes. The Meteorological Office is thus conducting research to make use of meteorological information for major crops by the producing area and Big Data in the meteorological and agricultural fields for the prediction of agricultural products' yields[8-9], but its research targets certain open field crops such as the mandarin, potato, pepper, sweet potato, and perilla leaf with Acer mono found in mountainous areas left out. The academic circles are conducting few researches on the prediction of its sap collection volume, either. The present study thus proposed an analysis system for Acer mono data based on meteorological information and Hadoop for its collection. The proposed system in- cludes the Big Data of meteorological information provided by the Meteorological Office including temperature, humidity, precipitation, and hours of daylight and also the Mahout system based on Hadoop usually used in Big Data analysis systems.

The study also analyzed and proposed an optimal prediction model for the collection of Acer mono sap based on climate conditions to affect its collec- tion volume by applying the Mahout multiple re- gression analysis model.

2. RELATED WORK

2.1 SmartFarm Analysis Model

Previous studies discussed the followings: [10]

proposed to promote the reliability of a farming

journal by automatically saving the data of produce

conditions and control environments and entering

the multimedia data of produce. The farming jour-

nal was materialized in a physical layer, which was

comprised of soil sensors and internal and external

sensors in the cultivation field, a middle layer,

which covered the journal's database, video, sen-

sor, and server management, and an application

layer, which provided users with GUI. The farming

journal was designed to record general works and

disease and pest forecasts and check the data in-

serted in video, voice, text or image. [11] proposed

a management and monitoring system for a growth

environment to increase a crop yield. The growth

monitoring system would check the crop con-

ditions via the sensors and control the environment

artificially. Related environment sensors would be

necessary for EC, pH, temperature, humidity, in-

tensity of illumination, and CO2. Most of the sensor

nodes were organized in a wired fashion, and the

system was organized in the RS485 method. When

it was organized in a wireless fashion, the Zigbee-

based USN technology was applied. The control

system covered crop cultivation, environment, nu-

trient solution and source of light. Data collected

from sensor and sink nodes would be sent to the

sever of a local gate to monitor the current con-

ditions. Independent gateways were set for sensor

and energy monitoring control. [12] analyzed prob-

lems with the management of Acer mono sap col-

lection and proposed a business management sys-

tem for it. The study proposed a module to manage

Acer mono trees and Acer mono sap collectors and

assess the collection areas by introducing a data-

base and GIS system and a practical Acer mono

tree business management system with a built-in

user convenience interface to promote easy manip-

ulation. The proposed system consisted of a sap

collection management model, a cost-profit analy-

sis model for sap production, and an evaluation

model for sap collection areas. The sap collection

(3)

management model managed information needed for the management of Acer mono trees and collec- tors. The cost-profit analysis model for Acer mono sap production analyzed the cost needed to produce sap and the profit generated from it. The evaluation model for Acer mono sap collection areas divided the areas into the upper, middle, and lower grade according to the sap production and management conditions. [13] proposed a U-IT-based farm man- agement system to manage mountain and forest products. The proposed system established a wa- tering facility for the growth of forest products. A total sensing system with radar sensors measured temperature, humidity, and wind directions. A da- tabase was built to analyze the growth environ- ment based on the information gathered from the monitoring system connected to all of the sensors and the management system.

2.2 Big Data Analysis and Element

The study [14-18] was involved with deducing a meaning in a word cloud by analyzing one million datasets with R-studio whereas, in the study, an attempt was made to analyze the hacking attempts of 140 million per day for a period of 40 days (4.2 billion attempts) against Korea Hydro & Nuclear Power Co., Ltd. with TensorFlow for the purpose of identifying vulnerabilities. Meanwhile, in the study[15], the hacking attempts (data) against Vietnam Bank were analyzed with Hadoop to find

their significance and a new tree was proposed.

Fig. 1 shows efficient solitary senior citizens care and application[14].

Regression analysis is a statistical method to explain causal relations in nature or in society with explanatory variables to influence and response variables to be influenced[19-21]. A regression model expresses response variables with the func- tion of explanatory variables, and an estimated re- gression model is used to predict the values of re- sponse variables with those of explanatory varia- bles. Binomial types expressed in Boolean values are used for response variables in regression analysis. When there are three values of response variables or more, multinomial and continuous types are used. Regression analysis, in general, is on the premise of linear relations between in- dependent and dependent variables. There are in- teractive effects in such linear relations just like the increasing values of independent variables will lead to the certain increase or decrease of depend- ent variables between weight and height, for instance. Eq. (1) shows a linear functional formula to present relations between correlated independent and dependent variables. Multiple regression anal- ysis has the same basic concept as simple linear regression analysis, but it uses two independent variables or more. Predictive abilities can be in- creased by using many different independent vari- ables. This model was used to match linear rela-

Fig. 1. An Efficient Solitary Senior Citizens Care and Application.

(4)

tions between Y Group of quantitative dependent variables and X Group of independent variables.

  

 

 

   

  (1) PCA is a technique of unsupervised learning to reduce information loss of multi-dimensional input vectors through analysis and to return them to lower-dimensional vectors. It is one of the multi- variate data processing techniques presented in a couple of principal component values. When there is a vector of n dimension, eigenvector is obtained through average vector and variance-covariance matrix from the application of Eq. (2) and (3). Then eigenvector is arranged according to the size of the corresponding proper value to add a new matrix.

The new matrix is applied as a transformation ma- trix to convert Vector x into Vector y as seen in Eq. (4). Then new variables in Row y have non- correlation and are arranged in the order of mono- tone decreasing variance to reduce the dimensions with the big principal components of high variance value.

  

  

(2)

  

  

  

 

 (3)

    

 (4)

3. DESIGN OF PROPOSED SYSTEM

3.1 Structure Diagram of Proposed System Fig. 2 shows the entire block diagram of the Big Data system proposed for Acer mono sap in the study[22]. The system consists of a data collector, data storage, Big Data analyzer to analyze mete- orological information, and UI to provide managers with analysis results. A data collector would collect meteorological information including temperature and humidity and information on the previous col- lection volumes of Acer mono sap. It would also collect the meteorological information of the Me- teorological Office for prior analysis. A data stor-

age would save the meteorological information col- lected from the sensors and the data of the collec- tion volumes of Acer mono sap in the large-ca- pacity storage Hadoop via Sqoop. A new table would be made based on the combination of the table saving the meteorological information from the Meteorological Office and the one saving the collection volume of Acer mono sap by the date.

Based on this combined table, an analyzer would propose an optimal analysis model with the Mahout- based multiple regression analysis algorithm.

3.2 Design of Data Model for Liquid Water Analysis Fig. 3 shows a data storage structure to save the meteorological information of collected Acer mono sap and the data of its yield by the date. First, MySQL would select data to be counted. Second, the data saved at MySQL would be accumulated in HDFS at Hadoop via Sqoop. Flume would be used to collect the saved data effectively, and Kafka for buffering and transaction processing would be used for the stable collection of data.

Third, large-capacity files would be loaded on Hadoop upon collection, and real-time data would be loaded on Hbase or Redis via Kafka and Storm.

In this case, real-time event analysis would be car- Fig. 2. Flow Chart of Acer Mono Sap Data Analysis

System.

(5)

ried out via Storm, and the data would be loaded on Hbase or Redis according to analysis results.

Fourth, the data loaded on Hadoop would undergo a series of works including refinement, alteration, integration, separation, and search with Hive. A data mart would be created based on the normal- ization of data in a standardized structure. Sqoop would be used to provide processed and analyzed data to the outside. The processing and search process helps to increase data quality, tending to be long and complex. As the process is organized in the workflow of Oozie, it can help to lower com- plexity and promote automation. And fifth, the data loaded on Hadoop via Mahout would be used to speed up data analysis and predict the collection volume of Acer mono sap based on its catego- rization and analysis.

3.3 Collection and Load of Acer Mono Sap Liquid Water Data

The Big Data used in the study included the me- teorological data of Gwangyang City provided by the Meteorological Office during the period of 1999

∼2016(November∼February) and the collection volume data of Acer mono sap in Gwangyang City in the Korea Forest Service's survey on the pro- duction of forest products. The data collected in

this way included precipitation, amount of snow- fall, temperature and humidity at the time of collec- tion. A hypothesis was set that these variables would have effects on the collection volume of Acer mono sap. The detailed information of the collected data was as follows: the meteorological data of the Meteorological Office covered average monthly temperature, precipitation, amount of solar radia- tion, relative humidity, and amount of snowfall.

Numbers that could affect data analysis such as missing values and outliers would be removed from the collected data, which also went through a pre-treatment process to present the meteoro- logical data of the Meteorological Office in sta- tistics by the month. Table 1 offers explanations about the independent variables to be used in data analysis after the pre-treatment process.

Fig. 4 shows a refinement and loading archi- tecture to load large amounts of meteorological in- formation and collection volumes of Acer mono.

Fig. 3. Structure of Data Storage in Acer Mono Sap Data Analysis System.

Fig. 4. Architecture of Data Collection and Load for Acer

Mono Sap Liquid Water Prediction.

(6)

The architecture reads large files with the source component of Flume and loads them on certain paths in HDFS with Sink. It is important to set data format, path, and partition values carefully when loading files on HDFS since the forms of loaded data have huge impacts on search and anal- ysis works.

3.4 Search of Acer Mono Sap Liquid Water Data Data search is the stage involving processing and understanding the loaded data. The search process of Big Data requires considerable amounts of time and resources. At the Big Data treatment and search process, one should standardize un- structured data in large amounts with an exquisite post-treatment work to ensure the immediacy of data and conduct enough exploratory analysis based on the understanding of the work domain.

Fig. 5 shows the Hive structure to search and

process the data sets of meteorological information and Acer mono sap collection volumes. Hive QL would be used to retrieve, combine, separate, alter, and refine the meteorological factors and collection volume data of Acer mono sap and organize an Acer mono DW, which would in turn perform sec- ondary and tertiary search and high-end analysis to create an Acer mono analysis mart. The col- lected and loaded data would be loaded in the ex- ternal part of Hive, which is also used to refine it, move it to the managed area, and create a mart by the topic area. The process of treating, search- ing and analyzing Big Data based on Hive, Peak, and Spark repeats itself in complex leading and trailing relations. Apache Oozie is used to process repetitive and complicated post-treatment jobs.

Fig. 6 shows the Oozie architecture to be used in the Big Data system of Acer mono. The work- flow made by a client in Oozie would be trans- Table 1. Independent Variables

Value Name Explanation

November Temperature Average temperature of November in the previous year

December Temperature Average temperature of December in the previous year

January Temperature Average temperature of January for the year

February Temperature Average temperature of February for the year

November Precipitation A total precipitation of November in the previous year

December Precipitation A total precipitation of December in the previous year

January Precipitation A total precipitation of January for the year

February Precipitation A total precipitation of February for the year

November Solar A total amount of solar radiation of November in the previous year



December Solar A total amount of solar radiation of December in the previous year



January Solar A total amount of solar radiation of January for the year



February Solar A total amount of solar radiation of February for the year



November Humidity Average relative humidity of November in the previous year



December Humidity Average relative humidity of December in the previous year



January Humidity Average relative humidity of January for the year



February Humidity Average relative humidity of February for the year



November Snowfall A total amount of snowfall of November in the previous year



December Snowfall A total amount of snowfall of December in the previous year



January Snowfall A total amount of snowfall of January for the year



February Snowfall A total amount of snowfall of February for the year

(7)

mitted to the Oozie server with the meta-infor- mation of related workflows managed separately by RDBMS. The coordinator in the Oozie server would schedule the workflows registered in Oozie.

Here, the engine would interpret the information of action and control nodes based on the workflows and implement related tasks at the Hadoop cluster.

Oozie would be also used to define and process post-treatment works. A variety of Hive QL would be used to move the loaded data to the external, management, and mart area in the order. Schedul- ing would take place according to the promised time based on the workflow of Oozie.

4. IMPLEMENTATION OF ANALYSIS MODEL AND SIMULATION

The proposed system was subjected to im- plemented and experiment in the following envi- ronments: the main-processor was intel i7-4790 3.6Ghz, and main-memory was DDR3 12 Gbyte ram, and GPU was NVidia Geforce GTX 1070, and secondary memory unit was SSD 256 Gbyte. Py- thon as the language of implement and Python 3.6, Spark 2.2, HDFS 2.7 as the tool of development.

The present study built an analysis model based on the application of a multiple regression analysis algorithm to analyze relations between the learning data of collected meteorological data and the col- lection volume of Acer mono sap. There are two or more independent variables used in multiple re- gression analysis. A regression model was tar- geted with each independent variable in a linear re- lation with a dependent one. Table 2 shows the multiple regression analysis results. Various mod- els were created as several independent variables and collection volumes were analyzed in the 1:N approach. Total 21 models were created with the ones whose coefficient of determination was under 0.4 removed. There were 12 analysis models whose coefficient of determination was 0.4 or higher.

Table 2 shows the optimal analysis models in the top four places. In all the analysis models, im- portant independent variables included average February temperature(

) for the year, accumu- lated precipitation(

) of November in the previous Fig. 5. Structure of Hive in Proposed Data Analysis

Model.

Fig. 6. Structure of Oozie in Proposed Data Analysis

Model.

(8)

year, accumulated precipitation(

) of December in the previous year, accumulated precipitation(

) of January for the year, accumulated precipitation(

) of February for the year, average relative humid- ity(



) of January for the year, and average rela- tive humidity(



) of February for the year. A cou- ple of independent variables made small con- tributions to the prediction model including accu- mulated amount of solar radiation(



) of February for the year, average relative humidity(



) of November in the previous year, and average rela- tive humidity(



) of December in the previous year. Model 4 was the analysis model measured based on these, recording the prediction accuracy of 98.25%.

5. CONCLUSION

The present study proposed a Big Data system based on meteorological information for Acer mono sap. The proposed system used Hadoop to collect, load, search, and analyze data. Of the meteoro- logical information provided by the Meteorological Office, the independent variables influencing the collection volume of Acer mono sap were applied to the analysis model including average temper-

ature, precipitation, amount of snowfall, relative humidity, and amount of solar radiation. The study also checked the analysis models for accuracy to select an optimal prediction model for the collection volume of Acer mono sap. The highest accuracy rate was 98.25%, but there were problems with predicting daily or monthly yields since the forest products data provided by the Korea Forest Service offered only the information about the total yields for the last year by the area and the data provided by the Meteorological Office offered only the data of the areas with an observation plane.

Follow-up study will build a system capable of predicting hourly yields as well as daily yields ac- cording to meteorological changes based on the farmers accurate meteorological information and real-time measurements of exudation amounts collected from the sensors of Acer mono farmers.

REFERENCE

[ 1 ] L. Lagacé, S. Leclerc, C. Charron, and M.

Sadiki, “Biochemical Composition of Maple Sap and Relationships among Constituents,”

J ournal of Food Composition and Analysis, Vol. 41, pp. 129-136, 2015.

[ 2 ] A.K.V.D. Berg, T.D. Perkins, M.L. Isselhardt, Table 2. Data Analysis Result of Acer Mono Sap Liquid Water

Model Analysis Method P-value Adjusted

R-square Accuracy Model 4   

 

 

 

 

 



 



0.0422 0.4950 98.25%

Model 7   

 

 

 

 

 



 



 



0.0187 0.4280 96.32%

Model 10   

 

 

 

 

 



 



 



 



0.0544 0.6440 93.26%

Model 11   

 

 

 

 

 



 



 



 



0.0426 0.5847 91.14%

Model 12   

 

 

 

 

 



 



 



 



 



0.0489 0.6593 96.45%

Model 14   

 

 

 

 

 



 



 



 



 



 



0.0578 0.4810 90.04%

Model 15   

 

 

 

 

 



 



 



 



 



 



 



0.0601 0.5248 92.46%

Model 18   

 

 

 

 

 



 



 



 



 



 



 



 



0.0270 0.6569 97.95%

(9)

and T.R. Wilmot, “Growth Rates of Sugar Maple Trees Tapped for Maple Syrup Pro- duction Using High-yield Sap Collection Practices,” Forest Science, Vol. 62, Issue 1, pp. 107-114, 2016.

[ 3 ] D. Houle, A. Paquette, B. Côté, T. Logan, H.

Power, I. Charron, et al., “Impacts of Climate Change on the Timing of the Production Season of Maple Syrup in Eastern Canada,”

P ublic Library of Science One, Vol. 10, No.

12, pp. 1-14, 2015.

[ 4 ] S.A. Snyder, M.A. Kilgore, M.R. Emery, and M. Schmitz, “Maple Syrup Producers of the Lake States, USA: Attitudes Towards and Adaptation to Social, Ecological, and Climate Conditions,” Environmental Management, Vol.

63, Issue 2, pp. 185-199, 2019.

[ 5 ] S. Legault, D. Houle, A. Plouffe, A. Ameztegui, D. Kuehn, L. Chase, et al., “Perceptions of U.S.

and Canadian Maple Syrup Producers Toward Climate Change, its Impacts, and Potential Adaptation Measures,” P ublic Library of Science One, Vol. 14, No. 4, pp. 1-27, 2019.

[ 6 ] O. Satir and S. Berberoglu, “Crop Yield Prediction under Soil Salinity Using Satellite Derived Vegetation Indices,” Field Crops Re- search, Vol. 192, pp. 134-143, 2016.

[ 7 ] M. Cooper, F. Technow, C. Messina, C. Gho, and L.R. Totir, “Use of Crop Growth Models with Whole-genome Prediction: Application to a Maize Multi Environment Trial,” Crop Science, Vol. 56, No. 5, pp. 2141-2156, 2016.

[ 8 ] P.T. Noi and M. Kappas, “Comparison of Random Forest, k-Nearest Neighbor, and Support Vector Machine Classifiers for Land Cover Classification Using Sentinel-2 Imagery,”

Sensors, Vol. 18, No. 1, pp. 1-20, 2018.

[ 9 ] I. Ahmad, M. Basheri, M.J. Iqbal, and A.

Rahim, “Performance Comparison of Support Vector Machine, Random Forest, and Extreme Learning Machine for Intrusion Detection,”

IEEE Access, Vol. 6, pp. 33789-33795, 2018.

[10] Y.W. Lee, J.S. Cho, H.H. Shin, H. Yoe, and C.S. Shin, “Construction of Farming-diary Management System Using Ubiquitous Te- chnologies,” Proceeding of P rocessing Con- ference of the Korean Internet Information Society, pp. 301-305, 2009.

[11] D.S. Ko and H.S. Park, “The Study for Design of Growth Environment Monitoring System of Vertical Farm,” Proceeding of Processing Conference of the Korean Information Tech- nical Society, pp. 372-375, 2011.

[12] D.S. Kwon, B.D. Lee, and J.S. Jung, “Develop- ment of Sap Production Management System of Acer Pictum Var. Mono,” P roceeding of Processing Conference of the Korean Forest Society, pp. 164-166, 2002.

[13] J.S. Shin and J.I. Lee, “Design and Construc- tion of Farm Management System by U-IT,”

J ournal of the Institute of Internet, Broad- casting and Communication, Vol. 2, No. 6, pp.

285-289, 2012.

[14] J.H. Huh, “Data Analysis for Personalized Health Activities: Machine Learning Process- ing for Automatic Keyword Extraction App- roach,” Symmetry, Vol. 10, No. 4, pp. 1-30, 2018.

[15] H.C.V. Ngu and J.H. Huh, “B+-Tree Con- struction on Massive Data with Hadoop,”

Cluster Computing, Vol. 22, No. 1, pp. 1011- 1021, 2019.

[16] S.H. Jung, K.H. Jo, J.Y. Kim, J. Park, J.C. Kim, S.I. Choi, et al., “A Implementation of Acer Pictum Sap Integrated Management System Based on Energy Harvesting and Monitoring System,” Journal of Korea Multimedia Soci- ety, Vol. 22, No. 11, pp. 1324-1337, 2019.

[17] S.H. Jung, J.C. Kim, and C.B. Sim, “A Novel

Data Prediction Model Using Data Weights

and Neural Network Based on R for Meaning

Analysis between Data,” J ournal of Korea

Multimedia Society, Vol. 18, No. 4, pp. 524-

532, 2015.

(10)

[18] S.H. Jung, K.J. Kim, E.C. Lim, and C.B. Sim,

“A Novel on Automatic K Value for Efficiency Improvement of K-means Clustering,” Pro- ceeding of International Conference on Future Information Technology, International Con- ference on Multimedia and Ubiquitous Engin- eering, pp. 181-186, 2017.

[19] S.H. Jung, C.S. Shin, Y.Y. Jo, J.Y. Kim, J.W.

Park, M.H. Park, et al., “Analysis Process Based on Modify K-means for Efficiency Improvement of Electric Power Data Pattern Detection,” Journal of Korea Multimedia Society, Vol. 20, No. 12, pp. 1960-1969, 2017.

[20] S.H. Jung, C.S. Shin, Y.Y. Jo, J.Y. Kim, J.W.

Park, M.H. Park, et al., “A Novel of Data Clustering Architecture for Outlier Detection to Electric Power Data Analysis,” Korean Institute of Product Safety Transactions on Software and Data Engineering, Vol. 6, No.

10, pp. 465-472, 2017.

[21] S.H. Jung and J.C. Kim, “Efficiency Improve- ment of Classification Model Based on Altered-means Using PCA and Outlier,” Inter- national Journal of Software Engineering and Knowledge Engineering, Vol. 29, No. 5, pp.

693-713, 2019.

[22] S.H. Jung, K.H. Jo, J.C. Kim, C.Y. Kim, and C.B. Sim, “A Novel on Data Analysis Model Based on Weather Information and Hadoop for Prediction of Acer Mono Sap Liquid Water,”

Proceedings of 7th Japan-Korea Joint Work- shop on Complex Communication Sciences, pp. 157-160, 2019.

Lee, Han Sung

He received his BS, MS, and PhD degrees in computer sci- ence from Korea University, Sejong City, Rep. of Korea, in 1996, 2002, and 2008, respec- tively. From July 1996 to July 1999, he worked for DAEWOO engineering company, Seoul, Rep. of Korea. From November 2009 to November 2014, he worked for Electronics and Telecommunications Research Institute (ETRI), Daejeon, Rep. of Korea as a senior member of the research staff. He worked for the Samsung Electronics Co., Ltd. Suwon, Rep. of Korea, from December 2014 to August 2019. He joined Youngsan University in September, 2019. His current research interests include machine/deep learning, computer vi- sion, computer/network security, optimization, data mining, and big-data analytics

Jung, Se Hoon

He received his BS, MS, and PhD degrees in multimedia en- gineering from Sunchon Natio- nal University, Suncheon City, Rep. of Korea, in 2010, 2012, and 2017, respectively. He worked for the Youngsan University, Rep. of Korea, from September 2018 to February 2020.

He joined in school of creative convergence from

Andong National University in March, 2020. His cur-

rent research interests include bigdata processing, da-

ta-mining, reinforcement learning, blockchain.

수치

Fig. 1 shows efficient solitary senior citizens care and application[14].
Fig. 3. Structure of Data Storage in Acer Mono Sap Data  Analysis System.
Fig. 5 shows the Hive structure to search and
Table 2 shows the optimal analysis models in the top four places. In all the analysis models,  im-portant independent variables included average February temperature(   ) for the year,  accumu-lated precipitation(   ) of November in the previousFig

참조

관련 문서