Adiponectin gene SNP 276G → T, nutrient intakes, and cardiovascular disease risk in Korean type 2 DM patients*
So Young Yu1, Han Kyoung Ryu1, Hee Jung Park2, Young Ju Choi3, Kap Bum Huh3 and Wha Young Kim1§
1Department of Nutritional Science and Food Management, Ewha Womans University
2CJ Corp. Foods R&D, Seoul 152-050, Korea
321C Diabetics and Vascular Research Center, Seoul 121-806, Korea
Received November 20, 2007; Revised December 6, 2007; Accepted December 12, 2007
Abstract
Single nucleotide polymorphism (SNP) in adiponectin gene has been associated with insulin resistance, diabetes, and cardiovascular disease (CVD).
This study was performed to investigate the association of SNP 276G→T at adiponectin gene with CVD risk factors in Korean type 2 diabetes mellitus (DM) patients. The subjects were 351 type 2 DM patients visited a DM clinic in Seoul, and the patients with known CVD were excluded.
The adiponectin SNP 276G→T was analyzed and dietary intakes were assessed by a Food Frequency Questionnaire. The prevalence of G/G, G/T, and T/T genotype was 47.6%, 43.3%, and 9.1%, respectively. Male subjects with T/T genotype showed significantly lower level of adiponectin and HDL-cholesterol and significantly higher C-reactive protein (CRP) level compared to G/G and G/T genotypes. In G/G genotype, protein intake was negatively correlated to body weight, BMI, and waist circumference, and there were positive correlation between carbohydrate intake and BMI, waist-hip ratio, and ApoB/apoA-1 ratio in G/T genotype. However, in T/T genotype, there was no significant association between macronutrient intakes and anthropometric and hematological values. In conclusion, CVD risk would be high in type 2 DM patients with T/T genotype, and the association of macronutrient intakes with anthropometric and hematologic factors was different among the three adiponectin genotypes. These results may imply the need for different dietary management regime according to adiponectin genotype to lower CVD complications in Korean type 2 DM patients.
Key Words: Adiponectin SNP 276G→T, adiponectin, insulin resistance, type 2 diabetes, cardiovascular disease risk factors
Introduction18)
Adiponectin is the most abundant adipocyte-secreted hormone in blood, and it has been thought to be associated with insulin resistance (Kadosaki et al., 2006). Plasma adiponectin levels have been reported to be reduced in patients with obesity (Arita et al., 1999), type 2 diabetes (Hotta et al., 2000), and coronary vascular diseases (CVD) (Hotta et al., 2000), all of which are closely related to insulin resistance. Adiponectin also regulates inflammatory response and has an antiatherogenic effect (Ouchi et al., 2003). A linkage has been reported between the single nucleotide polymorphism (SNP) in adiponectin gene and serum adiponectin level and CVD risk factors (Jang et al., 2005; Qi et al., 2006).
Adiponectin gene consists of 3 exons and 2 introns and is located on chromosome 3q27 (Bionnet et al., 2000). Many of SNPs at adiponectin gene have been shown to be related to insulin resistance, type 2 diabetes, and CVD. Among those, adiponectin SNP 45T→G in exon 2 and SNP 276G→T in intron
2 were shown to be associated with type 2 diabetes in a Japanese population (Hara et al., 2002), and the SNP 276G→T was observed to have a strong association with CVD risk in white diabetic patients (Bacci et al., 2004) and in non-diabetic Koreans (Jang et al., 2005).
Dietary factors play an important role in the development of type 2 diabetes and CVD. In addition, the expression of gene could be modified by environmental factors including diet, and the genetic variation may have effect on metabolic response to diet (Mutch et al., 2005; Ordovas, 2006). Although the concept of personalized nutritional management according to genotype was introduced years ago, this time it is early stage of persona- lized nutrition and much more researches have to be performed for the scientific evidence.
The primary goal of this study was to investigate the assoc- iation of SNP 276G→T at adiponectin gene with CVD risk factors in Korean type 2 diabetes mellitus (DM) patients. We also examined the association between adiponectin SNP 276G→
T and dietary intakes.
* This work was supported by Seoul R&BD Program, No. 10526 and by the second stage of BK21 Project in 2007
§Corresponding Author: Wha-Young Kim, Tel. 82-2-3277-3093, Fax. 82-2-3277-2862, Email. [email protected]
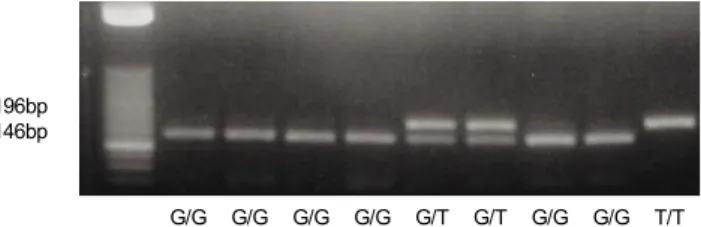
G/G G/G G/G G/G G/T G/T G/G G/G T/T 196bp
146bp
Fig. 1. PCR-based Bsm-RFLP analysis of the intron-2 polymorphism of the adiponectin gene
Subjects and Methods
Subjects
The subjects of this study were 351 type 2 DM patients aged over 20 years (191 males, 160 females) visited DM clinic in Seoul from October 2005 to August 2006. At the first visit, blood was drawn after a minimum of 12h fasting, and anthropometric parameters and dietary intake were also measured. After the examination, only the patients diagnosed as type 2 DM were included in this study, and the patients with known CVD (myocardial infarction, angina, stroke, and aortic disease) were excluded. Written informed consent was obtained from all subjects. The protocol was approved by the Institutional Review Board of Yonsei University.
Dietary, anthropometric, and hematological assessment Information on food consumption, general characteristics, and life-style behavior were obtained by a self-administered questio- nnaire. Food consumption was assessed using a food frequency questionnaire (Oh et al., 2007). Food intake data were analyzed using the Can-pro 3.0 software (Korean Nutrition Society, Korea) for nutrient analysis to determine nutrient intakes. For anthro- pometric measurements, body weight, height, and body com- position were assessed using INBODY 4.0 (Biospace Co. Korea).
Waist circumferences were measured by a tapeline, and abdo- minal fat thickness was assessed by ultrasonographic measure- ment (General Electric logic 7. USA). Body mass index (BMI, kg/m2) was calculated.
Fasting blood samples were obtained in EDTA-containing tubes in the morning and were frozen at -80℃ in aliquots. Fasting blood glucose level was measured by Accutrend alpha (Boe- hringer Mannhin Gmbh, Germany), and hemoglobin A1c level was determined using HLC-823 G7 (Tosoh, Japan). Plasma levels of total cholesterol, triglyceride and HDL-cholesterol were measured using an automatic blood analyzer (COBAS MIRA, Switzerland). LDL-cholesterol level was calculated by the for- mula of Friedwald (Friedwald et al., 1972). Tumor necrosis factor-α (TNF-α), interleukin-6 (IL-6), adiponectin (R&D Sys- tems Inc., USA), and leptin (BioVendor Lab. Med., Czech Repu- blic) were measured by ELISA Kit. The plasma glucose disapp- earance rate after intravenous injection of regular insulin (0.1 U’kg) was determined, and this result of Insulin Tolerance Test (KITT (%/min)) was used as index of insulin resistance.
Genotyping
Genomic DNA was extracted from heparinized venous blood samples using the QIAamp DNA blood mini kit (Quiagen Ltd, Crawley, UK). Identification of the polymorphism was carried out using PCR (GeneAmp PCR system 9700, Applied Biosys- tems, USA), followed by a restriction fragment length polymor-
phism (RFLP) assay. The promoter region of the adiponectin gene was amplified by polymerase chain-reaction (PCR) using the forward primer 5'-GGC CTC TTT CAT CAC AGA CC-3' and the reverse primer 5'-AGA TGC AGC AAA GCC AAA GT-3'. The PCR products were digested with BsmI (New England BioLabs), and the digestion products were resolved by electro- phoresis in a 3% agarose gel.
Statistical analysis
Statistical analysis was conducted using the statistical analysis system program (SAS, version 9.1). Data were expressed as the mean±standard error. General characteristics and lifestyle beh- avior were compared by the chi-square test. After the subjects were classified into three groups according to SNP 276G→T at adiponectin gene, General Linear Model and Duncan’s multiple range test were used to analyze between-group differences of the mean for all measured parameters. To test the difference between two groups, Student’s t-test was used. Pearson’s partial correlation coefficient analysis was used to test the association between nutrient intake and CVD risk factors according to adiponectin genotype. The levels of CRP, TNF-α, IL-6, leptin, and adiponectin were transformed to natural log for Duncan’s multiple range test and correlation coefficient analysis because they were not normally distributed.
Results
Genetic distribution of adiponectin 276 G/T and general characteristics of the subjects
A PCR-based BsmI-RFLP analysis was developed as a rapid screening method (Figure 1). One hundred sixty seven (47.6%) were homozygous for the wild-type allel (G/G), 152 (43.3%) were heterozygous (G/T) and only 32 (9.1%) were homozygous for the mutation (T/T). The mean age of male and female subjects was 54.1 and 58.1 years, and the mean DM duration was 7.23 years and 8.94 years, respectively. No significant differences in age and DM duration among three genotypes were found (Table 1). Subjects with DM family history were 92 (48.9%) in male and 70 (45.2%) in female subjects. About 70.7% of the subjects exercised regularly. The proportion of cigarette smokers and
Table 1. General characteristics of the subjects according to adiponectin SNP 276G→T
Male Female All (n=191) G/G (n=98) G/T (n=75) T/T (n=18) All (n=160) G/G (n=69) G/T (n=77) T/T (n=14)
Ages 54.1±0.741) 53.4±1.09ns3) 55.8±1.04 51.2±2.54 58.1±0.73 58.3±1.18ns 58.6±0.97 55.0±2.67 Duration of DM 7.23±0.56 6.83±0.82ns 7.29±0.78 9.31±2.63 8.94±0.61 9.24±0.77ns 8.63±0.96 9.19±2.97 Family history
Yes
No 92(48.9)2)
96(51.1) 50(51.5)NS4)
47(48.5) 34(45.9)
40(54.1) 8(47.1)
9(52.9) 70(45.2)
85(54.8) 31(46.3)NS
36(53.7) 30(40.5)
44(59.5) 9(64.3) 5(35.7) Cigarette smoking
Non-smoker Ex-smoker Current-smoker
39(23.4) 82(49.1) 46(27.5)
16(19.3)NS 45(54.2) 22(26.5)
21(30.4) 28(40.6) 20(29.0)
2(13.3) 9(60.0) 4(26.7)
129(93.5) 6(4.3) 3(2.2)
59(98.3)NS 1(1.7) 0(0.0)
62(91.2) 4(5.9) 2(2.9)
8(80.0) 1(10.0) 1(10.0) Alcohol drinking
Non-drinker Ex-drinker Current-drinker
32(19.1) 32(19.0) 104(61.9)
14(16.9)NS 15(18.1) 54(65.0)
15(21.4) 14(20.0) 41(58.6)
3(20.0) 3(20.0) 9(60.0)
35(24.8) 81(57.5) 25(17.7)
19(30.7)NS 33(53.2) 10(16.1)
14(20.3) 40(58.0) 15(21.7)
2(20.0) 8(80.0) 0(0.0) Exercise
Yes No
119(71.7) 47(28.3)
54(65.9)NS 28(34.1)
51(73.9) 18(26.1)
14(93.3) 1(6.67)
99(70.2) 42(29.8)
42(67.7)NS 20(36.3)
50(72.5) 19(27.5)
7(70.0) 3(30.0) Medication usage,
Yes/No (%) Diabetes
Hypertension Dyslipidemia 66.5/33.5 21.5/78.5 16.7/83.3
62.2/37.8NS 16.3/83.7NS 13.3/86.7NS
76.0/24.0 28.0/72.0 20.0/80.0
50.0/50.0 22.2/77.8 22.2/77.8
76.3/23.7 25.6/74.4 18.1/81.9
78.3/21.7NS 30.4/69.6NS 20.3/79.7NS
74.0/26.0 23.4/76.6 15.6/84.4
78.6/21.4 14.3/85.7 21.4/78.6
1) Mean±SE
2) n (%)
3) ns: not significant among the three genotypes in the same gender by Duncan’s multiple range test; p<0.05
4) NS: not significant among the three genotypes in the same gender by Chi-square test; p<0.05
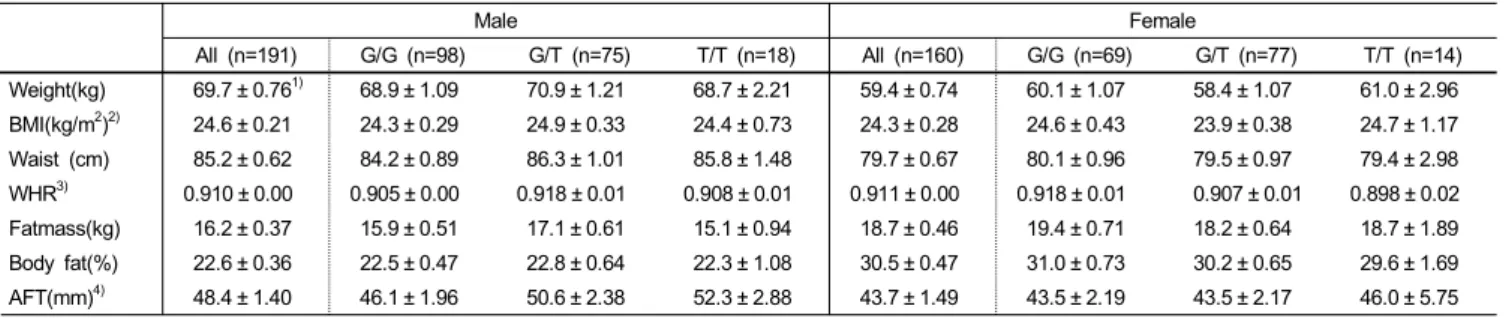
Table 2. Anthropometric variables of the subjects according to adiponectin SNP 276G→T
Male Female All (n=191) G/G (n=98) G/T (n=75) T/T (n=18) All (n=160) G/G (n=69) G/T (n=77) T/T (n=14)
Weight(kg) 69.7 ± 0.761) 68.9 ± 1.09 70.9 ± 1.21 68.7 ± 2.21 59.4 ± 0.74 60.1 ± 1.07 58.4 ± 1.07 61.0 ± 2.96 BMI(kg/m2)2) 24.6 ± 0.21 24.3 ± 0.29 24.9 ± 0.33 24.4 ± 0.73 24.3 ± 0.28 24.6 ± 0.43 23.9 ± 0.38 24.7 ± 1.17 Waist (cm) 85.2 ± 0.62 84.2 ± 0.89 86.3 ± 1.01 85.8 ± 1.48 79.7 ± 0.67 80.1 ± 0.96 79.5 ± 0.97 79.4 ± 2.98 WHR3) 0.910 ± 0.00 0.905 ± 0.00 0.918 ± 0.01 0.908 ± 0.01 0.911 ± 0.00 0.918 ± 0.01 0.907 ± 0.01 0.898 ± 0.02 Fatmass(kg) 16.2 ± 0.37 15.9 ± 0.51 17.1 ± 0.61 15.1 ± 0.94 18.7 ± 0.46 19.4 ± 0.71 18.2 ± 0.64 18.7 ± 1.89 Body fat(%) 22.6 ± 0.36 22.5 ± 0.47 22.8 ± 0.64 22.3 ± 1.08 30.5 ± 0.47 31.0 ± 0.73 30.2 ± 0.65 29.6 ± 1.69 AFT(mm)4) 48.4 ± 1.40 46.1 ± 1.96 50.6 ± 2.38 52.3 ± 2.88 43.7 ± 1.49 43.5 ± 2.19 43.5 ± 2.17 46.0 ± 5.75
1) Mean±SE
2) BMI: Body mass index
3) WHR: Waist/hip circumferences ratio
4) AFT: Abdominal fat thickness
alcohol drinkers were 27.5% and 61.9% of the male subjects, 2.2% and 17.7% of the female subjects, respectively. There were no significant differences in drinking, smoking, and exercising habits among three groups in both genders. Medication usages for diabetes, hypertension, and dyslipidemia were not signi- ficantly different.
Anthropometric variables according to adiponectin genotype As shown in Table 2, mean heights/weights of male and female subjects were 168.2 cm/69.7 kg and 156.4 cm/59.4 kg, respe- ctively. For male and female subjects, BMI values were 24.6 kg/m2 and 24.3 kg/m2, waist circumferences were 85.2 cm and 79.7 cm, body fat mass were 16.2 kg and 18.7 kg, percentages of body fat were 22.6% and 30.5%, and abdominal fat thickness were 48.4 mm and 43.7 mm, respectively. In all the measured
anthropometric variables, significant differences were not found among adiponectin genotype groups in both male and female subjects.
Hematological variables according to adiponectin genotype Hematological values of the subjects are shown in Table 3.
Plasma concentrations of insulin, total cholesterol, LDL-choles- terol, HDL-cholesterol, leptin and adiponectin were significantly higher in females than in males (p<0.05), however, no differences were found in insulin resistance (KITT), fasting blood glucose, hemoglobin A1c, triglyceride, apoB/apoA-1 ratio, CRP, TNF-α and IL-6 levels between male and female subjects.
In male subjects, mean values of KITT, fasting blood glucose, hemoglobin A1c, and insulin, total cholesterol, LDL-cholesterol, and triglyceride were not significantly different among three
Table 3. Hematological variables of the subjects according to adiponectin SNP 276G→T
Male Female All (n=191) G/G (n=98) G/T (n=75) T/T (n=18) All (n=160) G/G (n=69) G/T (n=77) T/T (n=14)
KITT (%/min)1) 2.10 ± 0.082) 2.14 ± 0.11 2.03 ± 0.12 2.21 ± 0.25 2.18 ± 0.08 2.09 ± 0.12 2.25 ± 0.13 2.21 ± 0.18
FBS(mg/dl)3) 162.9 ± 4.19 166.2 ± 6.19 157.2 ± 6.06 169.7 ± 14.7 166.1 ± 4.72 152.7 ± 6.26 176.5 ± 6.80 174.4 ± 22.2 HbA1c(%)4) 8.32 ± 0.16 8.42 ± 0.26 8.20 ± 0.22 8.22 ± 0.35 8.53 ± 0.15 8.23 ± 0.23b5) 8.62 ± 0.20b 9.51 ± 0.67a Insulin(ng/dl) 7.79 ± 0.29*6) 7.62 ± 0.43 7.86 ± 0.39 8.44 ± 0.92 8.78 ± 0.35 8.85 ± 0.57 8.54 ± 0.48 9.77 ± 1.11 T-Chol (mg/dl)7) 182.6 ± 2.67* 186.0 ± 4.05 180.3 ± 3.88 174.1 ± 7.61 199.1 ± 3.23 198.6 ± 4.51 199.7 ± 4.87 198.5 ± 13.1 LDL-Chol (mg/dl)8) 107.6 ± 2.37* 112.5 ± 3.44 103.5 ± 3.69 98.7 ± 6.11 117.9 ± 2.94 115.5 ± 4.25 119.8 ± 4.46 119.9 ± 10.1 HDL-Chol (mg/dl)9) 48.5 ± 1.05* 49.0 ± 1.45a 49.4 ± 1.69a 42.0 ± 3.18b 53.6 ± 7.21 54.0 ± 1.99 53.2 ± 1.67 53.6 ± 3.51 TG (mg/dl) 10) 132.5 ± 5.47 127.5 ± 7.95 134.6 ± 7.86 151.7 ± 21.5 139.6 ± 7.16 133.2 ± 8.06 147.7 ± 12.5 126.5 ± 19.2 ApoB/apoA-111) 0.85 ± 0.02 0.85 ± 0.03 0.83 ± 0.04 0.92 ± 0.06 0.85 ± 0.03 0.83 ± 0.04 0.87 ± 0.04 0.84 ± 0.09 CRP(mg/dl)12) 1.47 ± 0.16 1.19 ± 0.17b 1.63 ± 0.28ab 2.50 ± 0.81a 1.48 ± 0.18 1.26 ± 0.18 1.64 ± 0.30 1.70 ± 0.75 TNF-α(pg/ml) 13) 1.29 ± 0.05 1.19 ± 0.06 1.42 ± 0.09 1.22 ± 0.14 1.25 ± 0.06 1.26 ± 0.09 1.26 ± 0.08 1.19 ± 0.17 IL-6(pg/ml)14) 1.46 ± 0.13 1.17 ± 0.13 1.84 ± 0.25 1.46 ± 0.51 1.19 ± 0.10 1.04 ± 0.11 1.21 ± 0.13 1.89 ± 0.69 Leptin(ng/ml) 2.51 ± 0.22* 2.59 ± 0.34 2.61 ± 0.32 1.69 ± 0.25 9.12 ± 0.69 9.87 ± 1.15 8.25 ± 0.90 10.2 ± 2.51 Adiponectin (μg/ml) 4.05 ± 0.36* 4.21 ± 0.49a 4.20 ± 0.60a 2.53 ± 0.63b 6.81 ± 0.50 6.64 ± 0.71 7.29 ± 0.79 4.96 ± 1.21
1) KITT(%/min): Insulin tolerance test index
2) Mean±SE
3) FBS: Fasting blood sugar
4) HbA1c: Hemoglobin A1c
5) Values with different alphabets are significantly different among the three genotypes in same gender by Duncan’s multiple range test; p<0.05
6) *; significantly different between male and female subjects by student’s t-test; p<0.05
7) T-Chol: Total cholesterol
8) LDL-Chol: LDL cholesterol
9) HDL-Chol: HDL cholesterol
10) TG: Triglyceride
11) Apolipoprotein B/apolipoprotein A-1 ratio
12) CRP: C-reactive protein
13) TNF-α: Tumor necrosis factor-α
14) IL-6: Interleukin-6
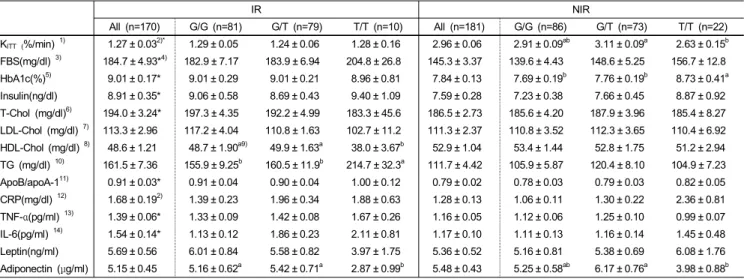
Table 4. Hematological variables of the subjects according to KITTindex and adiponectin SNP 276G→T
IR NIR
All (n=170) G/G (n=81) G/T (n=79) T/T (n=10) All (n=181) G/G (n=86) G/T (n=73) T/T (n=22)
KITT (%/min) 1) 1.27 ± 0.032)* 1.29 ± 0.05 1.24 ± 0.06 1.28 ± 0.16 2.96 ± 0.06 2.91 ± 0.09ab 3.11 ± 0.09a 2.63 ± 0.15b
FBS(mg/dl) 3) 184.7 ± 4.93*4) 182.9 ± 7.17 183.9 ± 6.94 204.8 ± 26.8 145.3 ± 3.37 139.6 ± 4.43 148.6 ± 5.25 156.7 ± 12.8 HbA1c(%)5) 9.01 ± 0.17* 9.01 ± 0.29 9.01 ± 0.21 8.96 ± 0.81 7.84 ± 0.13 7.69 ± 0.19b 7.76 ± 0.19b 8.73 ± 0.41a Insulin(ng/dl) 8.91 ± 0.35* 9.06 ± 0.58 8.69 ± 0.43 9.40 ± 1.09 7.59 ± 0.28 7.23 ± 0.38 7.66 ± 0.45 8.87 ± 0.92 T-Chol (mg/dl)6) 194.0 ± 3.24* 197.3 ± 4.35 192.2 ± 4.99 183.3 ± 45.6 186.5 ± 2.73 185.6 ± 4.20 187.9 ± 3.96 185.4 ± 8.27 LDL-Chol (mg/dl) 7) 113.3 ± 2.96 117.2 ± 4.04 110.8 ± 1.63 102.7 ± 11.2 111.3 ± 2.37 110.8 ± 3.52 112.3 ± 3.65 110.4 ± 6.92 HDL-Chol (mg/dl) 8) 48.6 ± 1.21 48.7 ± 1.90a9) 49.9 ± 1.63a 38.0 ± 3.67b 52.9 ± 1.04 53.4 ± 1.44 52.8 ± 1.75 51.2 ± 2.94 TG (mg/dl) 10) 161.5 ± 7.36 155.9 ± 9.25b 160.5 ± 11.9b 214.7 ± 32.3a 111.7 ± 4.42 105.9 ± 5.87 120.4 ± 8.10 104.9 ± 7.23 ApoB/apoA-111) 0.91 ± 0.03* 0.91 ± 0.04 0.90 ± 0.04 1.00 ± 0.12 0.79 ± 0.02 0.78 ± 0.03 0.79 ± 0.03 0.82 ± 0.05 CRP(mg/dl) 12) 1.68 ± 0.192) 1.39 ± 0.23 1.96 ± 0.34 1.88 ± 0.63 1.28 ± 0.13 1.06 ± 0.11 1.30 ± 0.22 2.36 ± 0.81 TNF-α(pg/ml) 13) 1.39 ± 0.06* 1.33 ± 0.09 1.42 ± 0.08 1.67 ± 0.26 1.16 ± 0.05 1.12 ± 0.06 1.25 ± 0.10 0.99 ± 0.07 IL-6(pg/ml) 14) 1.54 ± 0.14* 1.13 ± 0.12 1.86 ± 0.23 2.11 ± 0.81 1.17 ± 0.10 1.11 ± 0.13 1.16 ± 0.14 1.45 ± 0.48 Leptin(ng/ml) 5.69 ± 0.56 6.01 ± 0.84 5.58 ± 0.82 3.97 ± 1.75 5.36 ± 0.52 5.16 ± 0.81 5.38 ± 0.69 6.08 ± 1.76 Adiponectin (μg/ml) 5.15 ± 0.45 5.16 ± 0.62a 5.42 ± 0.71a 2.87 ± 0.99b 5.48 ± 0.43 5.25 ± 0.58ab 6.17 ± 0.76a 3.98 ± 0.88b
1) KITT(%/min): Insulin tolerance test index
2) Mean±SE
3) FBS: Fasting blood sugar
4) *; significantly different between male and female subjects by student’s t-test; p<0.05
5) HbA1c: Hemoglobin A1c
6) T-Chol: Total cholesterol
7) LDL-Chol: LDL cholesterol
8) HDL-Chol: HDL cholesterol
9) Values with different alphabets are significantly different among the three genotypes in same gender by Duncan’s multiple range test; p<0.05
10) TG: Triglyceride
11) Apolipoprotein B/apolipoprotein A-1 ratio
12) CRP: C-reactive protein
13) TNF-α: Tumor necrosis factor-α
14) IL-6: Interleukin-6
(A) BMI
0 1 2 3 4 5 6 7 8
BMI≤24.3(kg/m2) BMI >24.3(kg/m2)
G/G G/T T/T Adiponectin (μg/ml)
b a a
ns
(B) Fasting glucose
0 1 2 3 4 5 6 7 8
FBS≤147.0(mg/dl) FBS >147.0(mg/dl)
G/G G/T T/T Adiponectin (μg/ml)
b a a
ns
(C) Triglyceride
0 1 2 3 4 5 6 7 8
TG≤114.0(mg/dl) TG >114.0(mg/dl)
G/G G/T T/T Adiponectin (μg/ml)
b a a ns
(D) TNF-α
0 1 2 3 4 5 6 7 8
TNF-α≤1.05(pg/ml) TNF-α >1.05(pg/ml) G/G G/T T/T Adiponectin (μg/ml)
a a
b ns
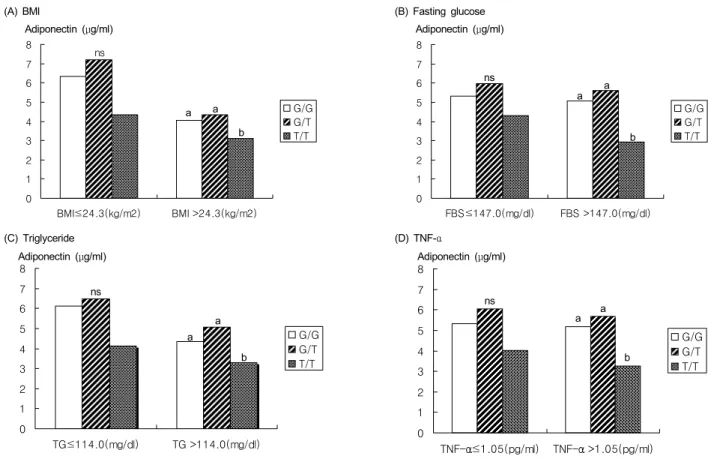
Fig. 2. Serum adiponectin concentration according to adiponectin genotype in the each subgroups of median of BMI, fasting blood sugar, triglyceride, and TNF-α
genotype groups. On the other hand, male subjects with T/T genotype showed significantly lower levels of HDL-cholesterol and adiponectin and higher CRP compared to other genotypes (p<0.05).
In female subjects, mean values of fasting blood glucose, and insulin, plasma lipids, and immune variables were not significan- tly different. However, hemoglobin A1c level was significantly higher in T/T genotype than other two genotypes (p<0.05).
Hematological variables according to KITT value and adipon- ectin genotype
Since it has been suggested that insulin resistance has an important role in etiology of type 2 DM and CVD, the effect of adiponectin polymorphism on CVD risk factors could be confounded by insulin resistance. To explain the effect of insulin resistance, the subjects were divided into two groups based on KITT value, and the effect of adiponectin polymorphism on hematological variables were analyzed (Table 4); the subjects of KITT below 2%/min were grouped as Insulin Resistant group (IR), and the subjects of KITT over 2%/min were grouped as Non Insulin Resistant group (NIR). Because the subject number was limited, groups could not be subdivided according to gender.
Plasma concentrations of fasting blood glucose, hemoglobin A1c, insulin, triglyceride, apoB/apoA-1 ratio, TNF-α and IL-6 were significantly higher in IR group than in NIR group (p<0.05),
and no differences were found in total cholesterol, LDL-choles- terol, CRP, leptin and adiponectin level between IR and NIR group.
In IR group, mean concentrations of adioponectin and HDL- cholesterol were significantly lower, and triglyceride level was significantly higher in subjects with T/T genotype than the other two genotypes (p<0.05). In NIR group, the subjects with T/T genotype showed significantly higher insulin resistance and hemoglobin A1c level and significantly lower adiponectin con- centration than the subjects with other two genotypes
Adiponectin concentration according to adiponectin genotype and CVD risk factors
To identify if the effect of adiponectin genotype on adiponectin concentration is shifted by other CVD risk factors, the subjects were divided into high and low subgroups based on the median values of BMI, fasting blood glucose, triglyceride, and TNF-α.
Mean concentrations of adiponectin were compared according to the adiponectin genotype in each subgroup (Figure 2). In the high BMI, fasting blood glucose, triglyceride, and TNF-α subg- roups, the subjects with T/T genotype showed significantly lower adiponectin concentration than other genotypes (p<0.05). How- ever, in low subgroups, no significant differences were found in adiponectin concentration among three genotypes.
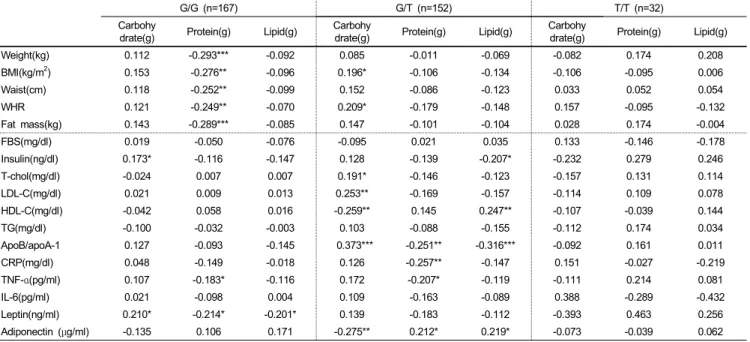
Table 5. The Pearson’s partial correlation coefficients between nutrient intakes and anthropometric and hematological factors according to adiponectin SNP 276G→T
G/G (n=167) G/T (n=152) T/T (n=32)
Carbohy
drate(g) Protein(g) Lipid(g) Carbohy
drate(g) Protein(g) Lipid(g) Carbohy
drate(g) Protein(g) Lipid(g)
Weight(kg) 0.112 -0.293*** -0.092 0.085 -0.011 -0.069 -0.082 0.174 0.208
BMI(kg/m2) 0.153 -0.276** -0.096 0.196* -0.106 -0.134 -0.106 -0.095 0.006
Waist(cm) 0.118 -0.252** -0.099 0.152 -0.086 -0.123 0.033 0.052 0.054
WHR 0.121 -0.249** -0.070 0.209* -0.179 -0.148 0.157 -0.095 -0.132
Fat mass(kg) 0.143 -0.289*** -0.085 0.147 -0.101 -0.104 0.028 0.174 -0.004
FBS(mg/dl) 0.019 -0.050 -0.076 -0.095 0.021 0.035 0.133 -0.146 -0.178
Insulin(ng/dl) 0.173* -0.116 -0.147 0.128 -0.139 -0.207* -0.232 0.279 0.246
T-chol(mg/dl) -0.024 0.007 0.007 0.191* -0.146 -0.123 -0.157 0.131 0.114
LDL-C(mg/dl) 0.021 0.009 0.013 0.253** -0.169 -0.157 -0.114 0.109 0.078
HDL-C(mg/dl) -0.042 0.058 0.016 -0.259** 0.145 0.247** -0.107 -0.039 0.144
TG(mg/dl) -0.100 -0.032 -0.003 0.103 -0.088 -0.155 -0.112 0.174 0.034
ApoB/apoA-1 0.127 -0.093 -0.145 0.373*** -0.251** -0.316*** -0.092 0.161 0.011
CRP(mg/dl) 0.048 -0.149 -0.018 0.126 -0.257** -0.147 0.151 -0.027 -0.219
TNF-α(pg/ml) 0.107 -0.183* -0.116 0.172 -0.207* -0.119 -0.111 0.214 0.081
IL-6(pg/ml) 0.021 -0.098 0.004 0.109 -0.163 -0.089 0.388 -0.289 -0.432
Leptin(ng/ml) 0.210* -0.214* -0.201* 0.139 -0.183 -0.112 -0.393 0.463 0.256
Adiponectin (μg/ml) -0.135 0.106 0.171 -0.275** 0.212* 0.219* -0.073 -0.039 0.062 Adjusted for age, sex, and energy intake
*, **, *** ; significant by Pearson’s partial correlation analysis; p<0.05, p<0.01 and p<0.001, respectively
Correlation between dietary intakes and anthropometric and hematological variables according to adiponectin genotype
Pearson’s partial correlation analysis was conducted to examine the association between macronutrient intakes and anthro- pometric and hematological variables according to adiponectin genotype(Table 5). In G/G genotype, significant negative corr- elation was shown between protein intake and body weight, BMI, waist circumference, body fat mass, abdominal fat thickness, TNF-α, and leptin. Carbohydrate intake was positively correlated to concentrations of insulin and leptin. In G/T genotype, there was positive correlation between carbohydrate intake and values of BMI, body fat mass, LDL-cholesterol, and ApoB/apoA-1 ratio, and there was negative correlation between carbohydrate intake and levels of HDL-cholesterol and adiponectin. Higher protein intake was also correlated to lower ApoB/apoA-1 ratio, CRP, and leptin in G/T genotype. However, in T/T genotype, there was no significant association between macronutrients intakes and anthropometric and hematological values (p<0.05).
Discussion
Adiponectin SNP 276G→T has been reported to be associated with serum adiponectin concentration, insulin resistance, and CVD risk (Jang et al., 2005; Qi et al., 2006). In the present study, the association of SNP 276G→T at adiponectin gene with CVD risk factors in Korean type 2 DM patients was studied.
The prevalence of G/G, G/T, and T/T genotype in our subjects were 47.6%, 43.3%, and 9.1%, respectively.
There have been several reports on the distributions of adipon- ectin gene genotypes among various populations. The prevalence of G/G, G/T, and T/T genotype were 50%, 41,7%, 8.3% in Korean non-diabetic subjects (Jang et al., 200), 58.3%, 37.0%, 4.7% in Japanese type 2 DM patients (Hara et al., 2002), 54.7%, 37.7%, 7.6% in American type 2 DM patients (Qi et al., 2006), 50.4%, 37.6%, 12% in Italian type 2 DM patients (Bacci et al., 2004), and 56%, 35.2%, 8.8% in French type 2 DM patients (Vasseur et al., 2002), respectively. The prevalence of G/G genotype in our subjects was lower and of G/T genotype was higher than Japanese, American and European type 2 DM patients, and the prevalence of T/T genotype in our subjects was slightly higher than Korean non-diabetic subjects from Jang’s study.
The male subjects with T/T genotype showed significantly lower adiponectin and HDL-cholesterol levels and higher CRP level compared to other two genotypes. These results suggest that the homozygotes of +276T may be associated with increased CVD risk in Korean type 2 DM patients. When the subjects were divided into high and low subgroups based on the median values of BMI, fasting blood glucose, triglyceride, and TNF-α, the association of T/T genotype with decreased serum adiponectin level was observed only in the subgroup with higher values (risk groups), not in subgroups with lower values. These results represent that the association between adiponectin genotype and serum adiponectin level may be stronger in the subjects with high CVD risk.
The association between adiponectin SNP +276 and serum adiponectin level, insulin resistance, and CVD risk is cont- roversial. Filippi et al. (2005) reported that adiponectin SNP
276G→T was associated with significantly higher insulin resistance and CVD risk in Italian type 2 DM patients, and in French (Vasseur et al., 2002) and Swiss non-diabetic subjects (Menzaghi et al., 2002) adiponectin SNP 276G→T was asso- ciated with decreased concentration of serum adiponectin. On the contrary, Lacquemant et al. (2004) reported that adiponectin SNP +276 was not associated with CVD in French and Caucasian type 2 DM patients. Lee et al. (2003) presented that adiponectin SNP +276 did not have effect on insulin resistance and serum adiponectin concentration. However, in Japanese type 2 DM patients, T/T genotype showed low insulin resistance, and the serum concentration of adiponectin was higher in obese subjects with T/T genotype than other two genotypes (Hara et al., 2002).
In Korean non-diabetic subjects, obese subjects with T/T genotype also showed lower insulin resistance and higher level of adiponectin than other genotypes (Jang et al., 200). It is hard to draw a conclusion on the effect of adiponectin SNP +276 on serum adiponectin level, insulin resistance, and CVD risk at present time. Differences in race, gender and disease status should be taken into account.
The results of correlation analysis between macronutrient intakes and anthropometric and hematological variables were different according to adiponectin genotypes. In G/G genotype, the negative correlation between protein intake and anthro- pometric variables was significant. In G/T genotype, carbohy- drate intake was significantly associated with obesity parameters and lipid profiles; however, protein intake was not significantly associated with them. In T/T genotype, there was no significant association between macronutrient intakes and anthropometric and hematological parameters. These results imply that different dietary management regime based on adiponectin genotype could be helpful for preventing CVD complications in Korean type 2 DM patients; however, the number of subjects in each genotype was too small to draw a clear conclusion for dietary guidelines.
There is a limitation in the current study. Mean duration of type 2 DM of subjects in this study was 8 years. Accordingly, the medical characteristics of the subjects would be affected by medication usage and practice of diet therapy, even though no significant differences were found in medication usage and type 2 DM duration among adiponectin genotypes.
In summary, CVD risk would be high in type 2 DM patients with T/T genotype and the relation of anthropometric and hematologic factors to macronutrient intakes was different among the three adiponectin genotypes. These results imply that different dietary management regime based on adiponectin genotype could be helpful for preventing CVD complications in Korean type 2 DM patients.
Literature cited
Arita Y, Kihara S, Ouchi N, Takahashi M, Maeda K, Miyagwa J, Hotta K, Shimomura I, Nakamura T, Miyaoka K, Kuriyama H,
Nishida M, Yamashita S, Okubo K, Matsubara K, Muraguchi M, Ohmoto Y, Funahashi T & Matsuzawa Y (1999). Paradoxical decrease of an adipose-specific: protein, adiponectin, in obesity.
Biochem Biophys Res Commun 257:79-83.
Bacci S, Menzaghi C, Ercolino T, Ma X, Rauseo A, Salvemini L, Vigna C, Fanelli R, Di Mario U, Doria A & Trischitta V (2004).
The +276 G/T single nucleotide polymorphism of the adiponectin gene is associated with coronary artery disease in type 2 diabetic patients. Diabetes Care 27:2015-2020.
Bionnet N, Hani EH, Dupont S, Gallina S, Francke S, Dotte S, De Matos F, Durand E, Lepretre F, Lecoeur C, Gallina P, Zekiri L, Dina C & Froguel P (2000). Genomewide search for type 2 diabetes-susceptibility genes in French whites: evidence for a novel susceptibility locus for early-onset diabetes on chromosome 3q27-qter and independent replication of a type 2-diabetes locus on chromosome 1q21-q24. Am J Hum Genet 67:1470-1480.
Filippi E, Sentinelli F, Romeo S, Arca M, Berni A, Tiberti C, Verrienti A, Fanelli M, Fallarino M, Sorropago G & Baroni MG (2005). The adiponectin gene SNP+276G>T associates with early-onset coronary artery disease and with lower levels of adipo- nectin in younger coronary artery disease patients (age <or=50 years). J Mol Med 83:711-719.
Friedwald WT, Levy RI & Fredireck DS (1972). Estimation of the concentration of low density lipoprotein cholesterol in plasma without use of the preparative ultracentrifuge. Clin Chem 18:499- 503.
Hara K, Boutin P, Mori Y, Tobe K, Dina C, Yasuda K, Yamauchi T, Otabe S, Okada T, Eto K, Kadowaki H, Hagura R, Akanuma Y, Yazaki Y, Nagai R, Taniyama M, Matsubara K, Yoda M, Nakano Y, Tomita M, Kimura S, Ito C, Froguel P & Kadowaki T (2002). Genetic variation in the gene encoding adiponectin is associated with an increased risk of type 2 diabetes in the Japanese population. Diabetes 51:536-540.
Hotta K, Funahashi T, Arita Y, Takahashi M, Matsuda M, Okamoto Y, Iwahashi H, Kuriyama H, Ouchi N, Maeda K, Nishida M, Kihara S, Sakai N, Nakajima T, Hasegawa K, Muraguchi M, Ohmoto U, Nakamura T, Yamashita S, Hanafusa T & Matsuzawa Y (2000). Plasma concentrations of a novel, adipose-specific protein, adiponectin, in type 2 diabetic patients. Arterioscler Thromb Vasc Biol 20:1595-1599.
Jang Y, Lee JH, Chae JS, Kim OY, Koh SJ, Kim JY, Cho H, Lee JE & Ordovas JM (2005). Association of the 276G→T polymor- phism of the adiponectin gene with cardiovascular disease risk factors in nondiabetic Koreans. Am J Clin Nutr 82:760-767.
Kadowaki T, Yamauchi T, Kubotal N, Hara K, Ueki K & Tobe K (2006). Adiponectin and adiponectin receptors in insulin resistance, diabetes, and the metabolic syndrome. J Clin Invest 116:1784- 1792.
Lacquemant C, Froguel P, Lobbens S, Izzo P, Dina C & Ruiz J (2004). The adiponectin gene SNP+45 is associated with coronary artery disease in type 2 (non-insulin-dependent) diabetes mellitus.
Diabet Med 21:776-781.
Lee YY, Lee NS, Cho YM, Moon MK, Jung HS, Park YJ, Youn BS, Lee HK, Park KS & Shin HD (2003). Genetic association of adiponectin polymorphisms with risk of type 2 diabetes mellitus.
J Kor Diabetes Assoc 27:438-448.
Menzaghi C, Ercolino T, Paola RD, Berg AH, Warrm JH, Scherer PE, Trischitta V & Doria A (2002). A haplotype at the adiponectin locus is associated with obesity and other features of the insulin resistance syndrome. Diabetes 51:2306-2312.
Mutch DM, Wahli W & Williamson G (2005). Nutrigenomics and nutrigenetics: the emerging faces of nutrition. FASEB J 19:1602- 1616
Oh SY, kim EM, Shin MH, Lee SH, Kim JE, Lee HS, Jo JS & Kim WY (2007). Development and validation of food frequency questionnaire for adults. The Korean Sociey of Health Promotioon Annual spring conference.
Ordovas JM (2006). Nutrigenetics, plasma lipids, and cardiovascular risk. J Am Diet Assoc 106:1074-1081.
Ouchi N, Osishi M, Kihara S, Funahashi T, Nakamura T, Nagaretani H, Kumada M, Ohashi K, Okamoto Y, Nishizawa H, Kishida K, Maeda N, Nagasawa A, Kobayashi H, Komai N, Kaibe M, Rakugi H, Ogihara T & Matsuazawa Y (2003). Association of hypoadi- ponectinemia with impaired vasoreactivity. Hypertension 42:231-
234.
Qi L, Doria A, Manson JE, Meigs JB, Hunter D, Mantzoros Cs &
Hu FB (2006). Adiponectin genetic variability, plasma adiponectin, and cardiovascular risk in patients with type 2 diabetes. Diabetes 55:1512-1516.
Vasseur F, Helbecque N, Dina C, Lobbens S, Delannoy V, Gaget S, Boutin P, Vaxillaire M, Lepretre F, Dupont S, Hara K, Clelannoy V, Clement K, Bihain B, Kadowaki T & Froguel P (2002). Single- nucleotide polymorphism haplotypes in the both proximal pro- moter and exon 3 of the APM1 gene modulate adipocyte-secreted adiponectin hormone levels and contribute to the genetic risk for type 2 diabetes in French Caucasians. Hum Mol Genet 11:2607- 2614.