https://doi.org/10.5468/ogs.2017.60.4.336 pISSN 2287-8572 · eISSN 2287-8580
Introduction
Pregnancy complications including preterm birth (PTB), gesta
tional hypertensive disorders, and fetal growth restriction (FGR) constitute substantial public health problems that are increas
ing in prevalence worldwide [1]. Many studies have sought to predict pregnancy complications. However, prenatal predic
tion of such complications remains difficult; no consensus has yet emerged on the most accurate and useful predictive parameters.
Several reports have indicated that fetal cardiac function yields important information on the hemodynamic status of,
Prediction of pregnancy complication occurrence using fetal cardiac output assessments made by ultrasonography at 20 to 24 weeks of gestation
Ji Yeon Lee 1 , Young Li Kim 1 , Ji Eun Jeong 1 , Jun Woo Ahn 2
Department of Obstetrics and Gynecology,
1CHA Bundang Medical Center, CHA University School of Medicine, Seongnam,
2University of Ulsan College of Medicine, Ulsan University Hospital, Ulsan, Korea
Objective
To evaluate the importance of assessment of fetal cardiac output (CO) for the prediction of complications of pregnancy.
Methods
We evaluated 65 fetuses and all of them had a fetal cardiac scan at 20 to 24 weeks of pregnancy. To measure CO, diameters (d) of the left right ventricle outflow tract were measured just above the valves. Each left CO (LCO) and right CO (RCO) was derived using the following equation: CO = velocity time integral × π × d
2/4 × heart rate. Pregnancy complications included gestational hypertensive disorders, fetal growth restriction (FGR) and preterm birth (PTB) caused from preterm labor or preterm premature rupture of membrane (PPROM).
Results
There were 23 cases with one more pregnancy complication (FGR, 9; gestational hypertensive disorders, 8; PTB caused from PTB or PPROM, 12). The LCO was lower in complication group than in normal group (88±53 vs. 117±48 mL/min, P=0.028). The RCO to the LCO ratio (RCO/LCO) was higher in complication group (2.43±1.69 vs. 1.48±0.81, P=0.001).
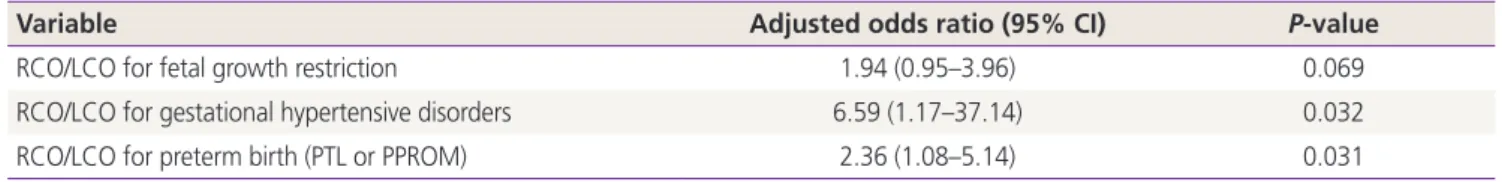
Regression analysis demonstrated that RCO/LCO was a significant predictor of pregnancy complication; Odds ratio was 7.76 (95% CI, 1.15 to 52.21; P=0.029). The area under the receiver-operating characteristic curve for prediction of pregnancy complications from LCO was 0.71. The diagnostic cut-off value of LCO was 80 mL/min. The area under the receiver- operating characteristic curve from RCO/LCO was 0.68 and cut-off value was 1.41.
Conclusion
This study demonstrated that pregnancy complications can be suspected based on fetal CO assessments at a GA of 20 to 24 weeks.
Keywords: Cardiac output; Echocardiography; Fetal growth retardation; Pre-eclampsia; Premature birth
Articles published in Obstet Gynecol Sci are open-access, distributed under the terms of the Creative Commons Attribution Non-Commercial License (http://creativecommons.
org/licenses/by-nc/3.0/) which permits unrestricted non-commercial use, distribution, and reproduction in any medium, provided the original work is properly cited.
Copyright © 2017 Korean Society of Obstetrics and Gynecology Received: 2016.11.1. Revised: 2017.3.6. Accepted: 2017.3.9.
Corresponding author: Ji Yeon Lee
Department of Obstetrics and Gynecology, CHA Bundang Medical Center, CHA University School of Medicine, 59 Yatap-ro, Bundang-gu, Seongnam 13496, Korea
Tel: +82-31-881-7595 Fax: +82-31-780-5069 E-mail: [email protected]
http://orcid.org/0000-0002-6610-0245
and cardiovascular adaptations in, women whose fetuses have perinatal complications [2]. Fetal echocardiograms are now commonly obtained at 20 to 24 weeks’ gestational age (GA) to identify structural congenital heart disease. However, no study has yet investigated the utility of fetal cardiac func
tion tests as predictors of pregnancy complications.
Therefore, we evaluated the ability of antenatal fetal car
diac output (CO), measured ultrasonographically at 20 to 24 weeks’ GA to predict pregnancy complications (FGR, ges
tational hypertensive disorders, and PTB caused by preterm labor [PTL], or preterm premature rupture of membranes [PPROM]).
Materials and methods
1. Study population
We evaluated 133 fetuses at 20 to 24 weeks’ GA. Women with medical conditions or multiple pregnancies, and preg
nancies exhibiting fetal anomalies or abnormal estimated fetal weights (EFWs) (small for GA or large for GA) at the time of examination were excluded. In addition, 48 women who were transferred to local clinics for delivery were excluded from analysis. Ultimately, we enrolled 65 healthy mothers who gave birth at Ulsan University Hospital from November 2013 to Au
gust 2014. All women were informed about the aims of the study, and all gave written informed consent. The institutional review board of the Ulsan University Hospital approved this
Fig. 1. Ultrasonographic measurement of cardiac output using pulsed-wave Doppler. (A) The pulmonary root diameter (arrow) is used to calculate pulmonary valve area. (B) Pulsed-wave flow profile in the pulmonary root. The angle of insonation for Doppler assessment is minimized so that the flow velocity time integral can be measured directly from the spectral display. (C) The aortic root diameter (arrow) is used to calculate aortic valve area. (D) Pulsed-wave flow profile in the aortic root.
A B
C D
study (UUH 201501001). Pregnancy complications included gestational hypertensive disorders (gestational hypertension, preeclampsia, and eclampsia), FGR, and PTB secondary to PTL and PPROM.
2. Echocardiography
A Voluson E8 ultrasound machine (GE Healthcare, Little Chalfont, Buckinghamshire, UK) was used in this study. Echo
cardiography was performed by an obstetrician specifically trained in the technique. CO was assessed by measuring the diameters (d values) of the left ventricle (LV) and right ven
tricle (RV) outflow tracts immediately above the aorta or pul
monary valve twice on frozen realtime images taken during systole using the leadingedgetoedge method. Mean values were used in analysis. Aortic and pulmonary artery systolic timevelocity integrals and left and right heart rates were cal
culated from the same view by subjecting the areas beneath the Doppler spectra to planimetric evaluation (Fig. 1). Each left CO (LCO) and right CO (RCO) was derived using the fol
lowing equation: CO (mL/min) = velocity time integral (cm) × π × d(cm)
2/4 × heart rate (beats/min). Conventional atrioven
tricular flow velocity waveforms were obtained using apical fourchamber views. The Doppler sample volume was placed slightly distal to the mitral and tricuspid annuli, between the tips of the leaflets. Peak E and A wave velocities were record
ed for atrioventricular flows, and the ratios of peak early vs.
late transmitral flow velocity (E/A ratios) calculated. Fetal myo
cardial performance (Tei index) scores were also recorded. The enddiastolic dimension and endsystolic dimension of the LV and RV were measured in the ultrasonographic Mmode. The shortening fractions (SFs) of the LV and RV were calculated.
3. Other sonographic parameters
We also evaluated fetal growth and amniotic fluid volume.
Fetal biometric measurements included the biparietal diame
ter, head circumference, abdominal circumference, and femo
ral length. Doppler measurements of the umbilical artery and middle cerebral artery (MCA) were also obtained. The umbili
cal artery systolic/diastolic ratio was measured in the umbilical cord in the region adjacent to the bladder. The peak systolic velocity of the MCA was measured distal to the junction of the internal carotid artery evident in the transverse view of the fetal skull. The measurement was made at the level of the circle of Willis.
4. Statistical analysis
Statistical analysis was performed using IBM SPSS ver. 19.0 (IBM Corp., Armonk, NY, USA). We analyzed discrete data using the Fisher’s exact and continuous variables using Stu
dent’s ttest or the MannWhitney Utest, as appropriate. We also performed a multivariate logistic regression analysis. A receiveroperating characteristic curve was constructed for the
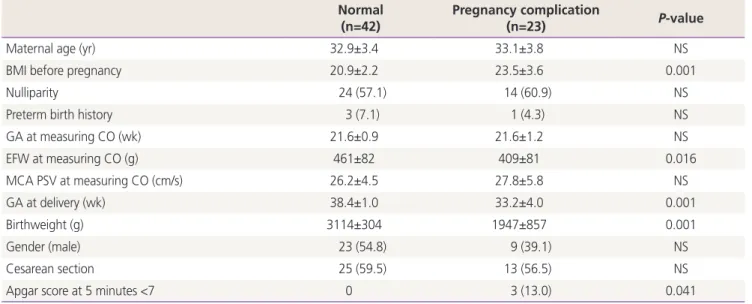
Table 1. Characteristics between normal group and pregnancy complication group Normal
(n=42) Pregnancy complication
(n=23) P-value
Maternal age (yr) 32.9±3.4 33.1±3.8 NS
BMI before pregnancy 20.9±2.2 23.5±3.6 0.001
Nulliparity 24 (57.1) 14 (60.9) NS
Preterm birth history 3 (7.1) 1 (4.3) NS
GA at measuring CO (wk) 21.6±0.9 21.6±1.2 NS
EFW at measuring CO (g) 461±82 409±81 0.016
MCA PSV at measuring CO (cm/s) 26.2±4.5 27.8±5.8 NS
GA at delivery (wk) 38.4±1.0 33.2±4.0 0.001
Birthweight (g) 3114±304 1947±857 0.001
Gender (male) 23 (54.8) 9 (39.1) NS
Cesarean section 25 (59.5) 13 (56.5) NS
Apgar score at 5 minutes <7 0 3 (13.0) 0.041
Value are presented as mean±standard deviation or number (%); P<0.05 was considered significant.
NS, not significant; BMI, body mass index; GA, gestational age; CO, cardiac output; EFW, estimated fetal weight; MCA, middle cerebral artery;
PSV, peak systolic velocity.
prediction of pregnancy complications by the LCO and RCO to the LCO ratio. Best cutoffs (points with the highest sensi
tivity and lowest rate of false positivity) were then established.
A Pvalue <0.05 was considered statistically significant.
Results
Sixtyfive babies were delivered in our hospital. Table 1 lists the perinatal characteristics of mothers with and without pregnancy complications. In total, 23 had one or more preg
nancy complications. There were nine cases of FGR (13.8%), eight of gestational hypertensive disorders (12.3%), and twelve of PTB caused by PTL or PPROM (18.5%). Several mothers experienced more than one complication.
We found no difference in maternal age, parity, mode of delivery, PTB history, or neonatal gender between mothers
with and without pregnancy complications (Table 1). Further
more, we found no betweengroup difference in GA or in MCA peak systolic velocity at the time of fetal cardiac function examination. However, significant betweengroup differences were apparent in maternal body mass index prior to pregnancy, EFW during measurement of fetal cardiac function, GA at the time of delivery, birth weight, and the incidence of a low Ap
gar score 5 minutes after delivery. The EFW was in the normal range because we excluded all cases with abnormal EFWs (e.g., small for GA or large for GA) from analysis.
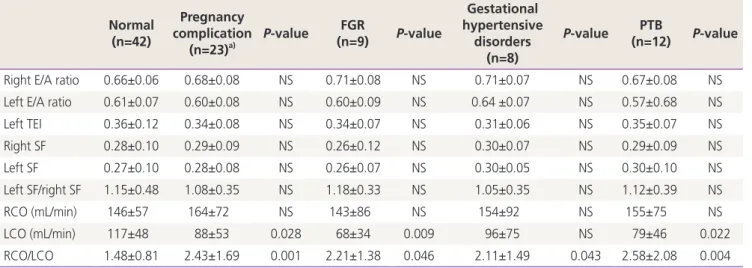
There were no significant differences in the E/A ratio, Tei score, SF, or RCO (Table 2). However, LCO was lower in the patients with than without pregnancy complications (88±53 vs. 117±48 mL/min, P=0.028). The RCO/LCO ratio was higher (2.43±1.69 vs. 1.48±0.81, P=0.001). The RCO/LCO was high
er in the FGR (2.21±1.38 vs. 1.48±0.81, P=0.046), gestational hypertensive disorders (2.11±1.49 vs. 1.48±0.81, P=0.043),
Table 2. A comparison of fetal cardiac function in normal and pregnancy complication group
Normal (n=42)
Pregnancy complication
(n=23)
a)P-value FGR
(n=9) P-value
Gestational hypertensive
disorders (n=8)
P-value PTB
(n=12) P-value
Right E/A ratio 0.66±0.06 0.68±0.08 NS 0.71±0.08 NS 0.71±0.07 NS 0.67±0.08 NS
Left E/A ratio 0.61±0.07 0.60±0.08 NS 0.60±0.09 NS 0.64 ±0.07 NS 0.57±0.68 NS
Left TEI 0.36±0.12 0.34±0.08 NS 0.34±0.07 NS 0.31±0.06 NS 0.35±0.07 NS
Right SF 0.28±0.10 0.29±0.09 NS 0.26±0.12 NS 0.30±0.07 NS 0.29±0.09 NS
Left SF 0.27±0.10 0.28±0.08 NS 0.26±0.07 NS 0.30±0.05 NS 0.30±0.10 NS
Left SF/right SF 1.15±0.48 1.08±0.35 NS 1.18±0.33 NS 1.05±0.35 NS 1.12±0.39 NS
RCO (mL/min) 146±57 164±72 NS 143±86 NS 154±92 NS 155±75 NS
LCO (mL/min) 117±48 88±53 0.028 68±34 0.009 96±75 NS 79±46 0.022
RCO/LCO 1.48±0.81 2.43±1.69 0.001 2.21±1.38 0.046 2.11±1.49 0.043 2.58±2.08 0.004
Value are presented as mean±standard deviation; P<0.05 was considered significant.
FGR, fetal growth restriction; PTB, preterm birth; E, peak velocity of the early diastolic transmitral flow; A, peak velocity of the late diastolic transmitral flow; E/A ratio, ratio of peak early vs. late transmitral flow velocity; NS, not significant; TEI, isovolumic contraction time plus isovolu
mic relaxation time divided by ejection time; SF, shortening fraction; RCO, right cardiac output; LCO, left cardiac output.
a)