Received: 2012.1.20. Revised: 2012.4.23. Accepted: 2012.4.23.
Corresponding author: Heung Yeol Kim, MD
Department of Obstetrics and Gynecology, Kosin University College of Medicine, 262 Gamcheon-ro, Seo-gu,
Busan 602-702, Korea
Tel: +82-51-990-6226 Fax:+82-51-990-3300 E-mail: [email protected]
Th is is an Open Access article distributed under the terms of the Creative Commons Attribution Non-Commercial License (http://creativecommons.org/licenses/
by-nc/3.0/) which permits unrestricted non-commercial use, distribution, and reproduction in any medium, provided the original work is properly cited.
Copyright © 2012. Korean Society of Obstetrics and Gynecology
Vitamin D (VtD) endocrine system is associated with obesity. The relationship between VtD and body fat was described originally by Lumb et al. [1]. Subsequently murine experiment and human study revealed that body fat is the major storage site of vitamin D3 and the source for other VtD metabolites during deprivation as well [2,3].
The reasons of VtD insuffi ciency in obese people have been pos- tulated to several factors such as a decrease exposure to sunlight because of low activity level, a negative feedback from elevated active VtD metabolite 1,25-hydroxyvitamin D and parathyroid hormone (PTH) levels on hepatic synthesis of 25-OHD [4], and the metabolic clearance of VtD may increase in obesity with enhanced uptake by adipose tissue [5]. Recently, Worstman et al. [6] also
demonstrated that obesity-associated VtD insuffi ciency most likely
pISSN 2233-5188 · eISSN 2233-519625-HYDROXYVITAMIN D LEVELS AND BODY MASS INDEX IN HEALTHY POSTMENOPAUSAL WOMEN
Sun Young Jang, MD
1, Ji Young Lee, MD
2, Jae Man Bae, MD
2, Chulmin Lee, MD
3, Sung Nam Hong, MD
4, Ari Kim, MD
5, Heung Yeol Kim, MD
1Department of Obstetrics and Gynecology, 1Kosin University College of Medicine, Busan; 2Konkuk University School of Medicine, Seoul; 3Inje University Sanggye Paik Hospital, Seoul; 4Samsung Changwon Hospital, Sungkyungkwan University School of Medicine, Changwon, 5Institute of Wonkwang Medical Science, Wonkwang University College of Medicine, Iksan, Korea
Objective
Obesity is associated with alterations in vitamin D (VtD) system. We evaluated the correlation between VtD level and body mass index (BMI), a standard for the evaluation of obesity in postmenopausal women.
Methods
To study the relationship between VtD levels and obesity, we recruited 310 healthy postmenopausal women between January 2005 and March 2011 and analyzed the correlation between BMI and serum 25-hydroxyvitamin D (25-OH-VtD) level. We also analyzed the relationship between serum VtD level and bone health status such as bone mineral density measured by dual-energy X-ray absorptiometry, bone turnover marker, and parathyroid hormone (PTH).
Results
With a cut-off level for VtD deficiency at 30 ng/mL, 98.9% patients showed a VtD deficiency, while 87.8% patients showed a vitamin D defi ciency with a 20-ng/mL cut-off level. VtD levels had no signifi cant correlation with age, height, weight, BMI, or bone turnover markers. PTH level and serum 25-OH-VtD level showed a negative correlation. VtD level showed negative correlation with BMI, but statistically not signifi cant.
Conclusion
In this study, most of postmenopausal women (more than 87.8%) had a VtD defi ciency, and VtD level showed negative correlation with BMI, but was not statistically signifi cant.
Keywords: Vitamin D; Body mass index; Obesity; Postmenopause
is due to decreased bioavailability of vitamin D3 from cutaneous and dietary sources because of its deposition in body fat compart- ments.
Although studies to determine the ideal VtD concentration in the blood have been carried out recently, their conclusions remain controversial. The ideal VtD level can be defi ned as the concentra- tion at which calcium absorption is at its maximum and parathy- roid hormone levels in the blood are most suppressed such that high bone density is maintained, while the risks of osteopenia and falls or fractures are minimized. Various studies have suggested different ideal levels. The range of 50-80 nmol/L (20-32 ng/mL) has generally been considered the ideal for healthy bone [7]. Ac- cording to this standard, the prevalence of VtD defi ciency is high throughout the world [8].
Low level of VtD is characterized by mild secondary hyperpara- thyroidism and enhanced risk of osteoporotic fracture. Several well known factors that were infl uence on serum VtD level were seasons, dietary VtD intake, ethnicity, age, and possibly adipose tissue. However, it still remains unknown whether obesity should be taken into consideration while assessing and managing VtD deficiency. We studied the correlation between VtD level and body mass index (BMI), a standard for the evaluation of obesity in healthy postmenopausal women.
Materials and Methods
We evaluated 310 postmenopausal women who visited the out- patient postmenopausal clinic at 3 universities between January 2005 and March 2011. Exclusion criteria consisted of any chronic illness including hypertension, diabetes, renal, hepatic, or coronary disease; medications known to affect bone metabolism; and any use of hormonal replacement therapy.
Age, BMI, menopausal period, bone mineral density (BMD), serum 25-hydroxyvitamin D level, bone turnover markers, and parathyroid hormone level were measured. Blood was collected between 9:00 and 11:00 AM after overnight fasting.
BMD was measured by dual energy X-ray absorptiometry of the lumbar spine (GE lunar Prodigy, Madison, WI, USA). Osteocalcin and N-telopeptide were measured as bone turnover markers.
25-hydroxyvitamin D levels in the blood was measured by ra- dioimmunoassay (RIA) with a 25-OH vitamin D
125RIA kit (Sorin Diagnostics Inc., France). The parathyroid hormone level was mea- sured by immunoradiometric assay (IRMA) with a DSL-8000 Active intact PTH IRMA kit (Diagnostic System Laboratories Inc., USA).
Serum osteocalcin was measured by RIA, using a rabbit polyclonal antiserum raised against bovine osteocalcin. N-telopeptide was measured by enzyme-linked immunosorbent assay (ELISA), using monoclonal antibody for human N-telopeptide.
Chapuy et al. [9] referred to serum VtD insufficiency when it is lower than 30 ng/mL while Lips et al. [10] referred to it when lower than 20 ng/mL. The diagnostic criteria for VtD deficiency was under 10 ng/mL. Data analysis was performed by SAS ver. 6.12 (SAS Institute, Cary, NC, USA). A Scheffe multiple range test was performed for comparing among the three groups. A Student’s t-test was performed to compare the two groups. The correlation between VtD and each variable was performed by a regression analysis and P<0.05 was considered statistically signifi cant.
Results
1. Demographic characteristics
Total 310 healthy postmenopausal women were included in this study between January 2005 and March 2011. The baseline demographic profi le of our study were age, height, weight, BMI,
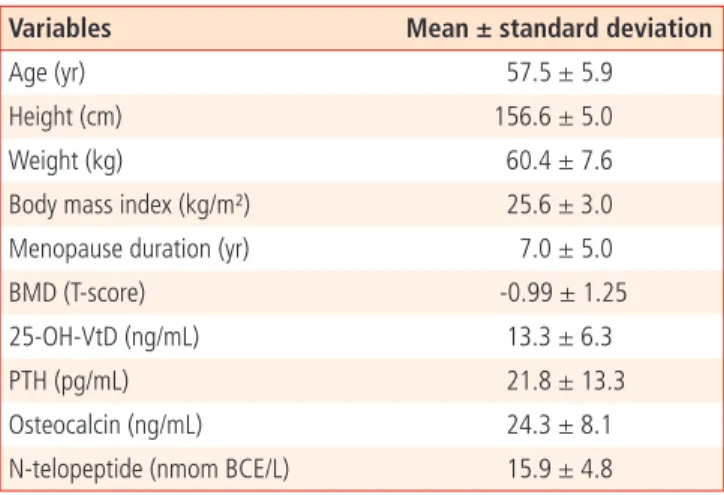
Table 1. Clinical characteristics of the subjects (n = 310)
Variables Mean ± standard deviation
Age (yr) 57.5 ± 5.9
Height (cm) 156.6 ± 5.0
Weight (kg) 60.4 ± 7.6
Body mass index (kg/m²) 25.6 ± 3.0
Menopause duration (yr) 7.0 ± 5.0
BMD (T-score) -0.99 ± 1.25
25-OH-VtD (ng/mL) 13.3 ± 6.3
PTH (pg/mL) 21.8 ± 13.3
Osteocalcin (ng/mL) 24.3 ± 8.1
N-telopeptide (nmom BCE/L) 15.9 ± 4.8
BMD, total lumbar bone mass density by dual-energy X-ray absorptiom- etry; 25-OH-VtD vitamin D; PTH, parathyroid hormone.
Table 2. Classifi cation of serum 25-OH-VtD
25-OH-VtD (ng/mL) No. (%)
<10 126 (40.6)
≤10–20 146 (47.1)
≤20–30 35 (11.3)
≥30 3 (1.0)
25-OH-VtD, 25 hydroxy vitamin D.
menopausal period, total lumbar BMD, 25-hydroxy-vitamin D (25-OH-VtD), PTH, osteocalcin and N-telopeptide and highlighted in Table 1.
2. Classifi cation by VtD level in blood
With a standard for VtD defi ciency in blood of 30 ng/mL, 307 pa- tients (99.0%) had levels under 30 ng/mL, and only 3 patients (1%) had levels over 30 ng/mL. However, following Lips’ standard of 20 ng/mL, 250 patients (87.7%) had levels under 20 ng/mL and 26 patients (12.3%) had levels over 20 ng/mL [10]. Furthermore, with a standard of 10 ng/mL for VtD defi ciency, only 126 patients (40.6%) had levels under 10 ng/mL with the remainder over the minimum standard (Table 2).
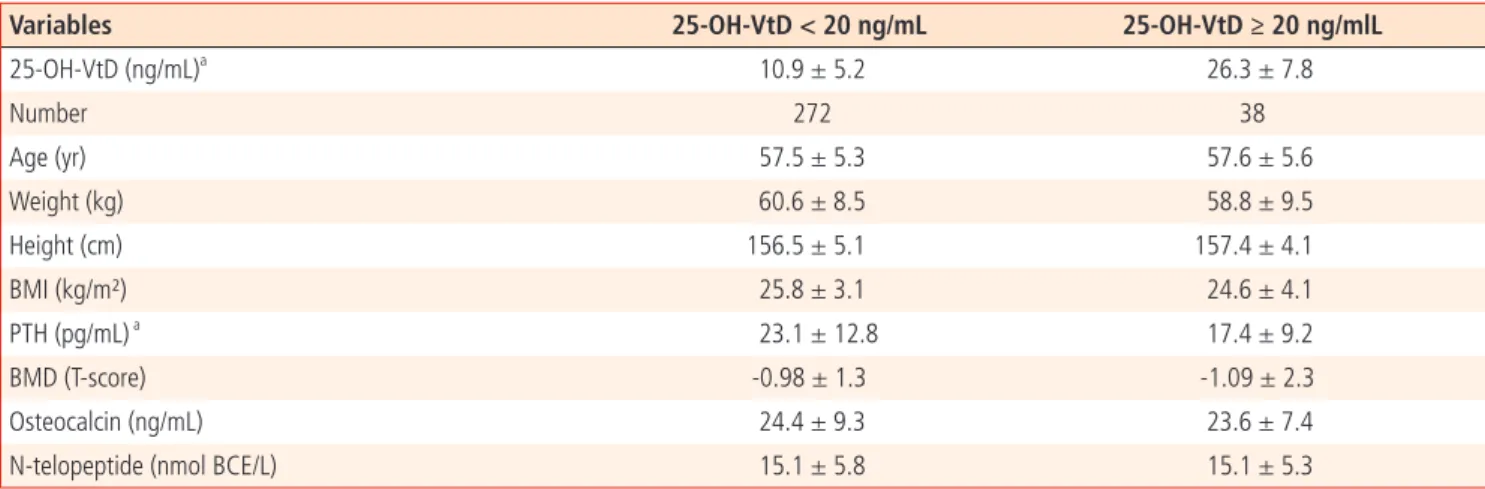
Comparing each variable between two groups - those <20 ng/mL and ≥20 ng/mL of VtD concentration - the levels showed a signifi - cant difference at 10.9 ng/mL versus 26.3 ng/mL. In addition, PTH levels were also signifi cantly low at 17.4 pg/mL in the group with
≥20 ng/mL of VtD in the blood versus 23.1 pg/mL of in the group
<20 ng/mL. However, other variables including BMI did not show significant differences (Table 3). However, no significant differ- ences were found between the <10 ng/mL and the 10-20 ng/mL groups, or between the 10-20 ng/mL and the ≥20 ng/mL concen- tration groups. Among the other variables, including BMI, no other
signifi cant differences were found.
3. Correlation analysis between VtD level in blood and each variable
Age, height, weight, BMD, osteocalcin, and N-telopeptide did not show signifi cant differences according to VtD level; however, parathyroid hormone level showed a negative correlation of -0.20 (P=0.0012) (Table 4).
4. Correlation analysis among VtD level, PTH level in blood, and BMI
Analyzing correlation between VtD level in blood and each vari- able with regression analysis, there was a negative correlation of -0.066 between BMI and VtD level; however, the difference was not statistically signifi cant (P=0.42). In addition, there was a posi- tive correlation of 0.0936 between BMI and PTH level; however,
Table 5. Correlation of BMI with serum 25-OH-VtD and PTH25-OH-VtD PTH
r -0.0662 0.0936
P-value
0.42 0.23
BMI, body mass index; 25-OH-VtD, 25 hydroxy vitamin D; PTH, parathy- roid hormone.
Table 3. Comparison of characteristics of postmenopausal women with optimal and suboptimal vitamin D level
Variables 25-OH-VtD < 20 ng/mL 25-OH-VtD ≥ 20 ng/mlL
25-OH-VtD (ng/mL)a 10.9 ± 5.2 26.3 ± 7.8
Number 272 38
Age (yr) 57.5 ± 5.3 57.6 ± 5.6
Weight (kg) 60.6 ± 8.5 58.8 ± 9.5
Height (cm) 156.5 ± 5.1 157.4 ± 4.1
BMI (kg/m²) 25.8 ± 3.1 24.6 ± 4.1
PTH (pg/mL) a 23.1 ± 12.8 17.4 ± 9.2
BMD (T-score) -0.98 ± 1.3 -1.09 ± 2.3
Osteocalcin (ng/mL) 24.4 ± 9.3 23.6 ± 7.4
N-telopeptide (nmol BCE/L) 15.1 ± 5.8 15.1 ± 5.3
25-OH-VtD, 25 hydroxy vitamin D; BMI, body mass index; BMD, total lumbar bone mass density by dual-energy X-ray absorptiometry; PTH, parathyroid hormone.
aP<0.05.
Table 4. Correlation of serum 25-OH-VtD with other variables
Age Ht Wt BMD Osteocalcin N-telopeptide PTH
r 0.0528 -0.0298 -0.0351 -0.0433 -0.0703 -0.2006 -0.1995
P-value NS NS NS NS NS NS 0.0012
25-OH-VtD, 25 hydroxy vitamin D; Ht, height (cm); Wt, weight (kg); BMD, bone mass density; PTH, parathyroid hormone; NS, not signifi cant.
again the difference was not signifi cant ( P=0.23) (Table 5).
Discussion
This is a cross-sectional, hospital-based study that try to provide the evidence, obesity defi ned by BMI is determining factor of se- rum VtD level.
BMI, calculated from height and body weight, is widely adopted to determine obesity which increases the risk of cardiovascular disease, hypertension, and diabetes [11]. BMI is accepted as index of body fat thanks to high correlation between BMI and body fat percentage although BMI per se does not indicate body fat itself.
In this context, we analyzed the relation between BMI versus se- rum VtD level.
VtD plays a central role in calcium and phosphorus homeostasis and skeletal health. Various standards for identifying VtD defi cien- cy have been reported. Since impaired calcium metabolism due to low serum 25-OH-VtD levels triggers secondary hyperparathyroid- ism, increased bone turnover, and progressive bone loss [12], the optimal range of circulating 25-OH-VtD for skeletal health has been proposed as the range that reduces PTH levels to a minimum [13] and calcium absorption is maximal. Several studies have shown that PTH levels plateau to a minimum steady-state level as serum 25-OH-VtD levels approach and rise above approximately 30 ng/mL (75 nmol/L) [14]. Chapuy et al. [10] reported that a large percentage of the French adult urban population has VtD insuffi ciency during wintertime and that an increase in serum PTH secretion is initiated as soon as the serum 25-OH-VtD level falls below 78 nmol/L (31 ng/mL), which is currently considered a nor- mal value for 25-OH-VtD. Our study was performed in the winter, so when we adopted Chapuy and colleagues’ standard of 30 ng/
mL for the winter, 307 menopausal women, all but 3 (99.0%) among 310, had a VtD defi ciency.
We also tried to compare parathyroid hormone levels among groups to decide the ideal VtD level in our study, there was no signifi cant difference between the group with ≥30 ng/mL and the group with <30 ng/mL of VtD concentration. However, there was a signifi cant difference between the group with ≥20 ng/mL and the group with <20 ng/mL. Comparing parathyroid hormone levels after the groups were stratifi ed by every 2.5 ng/mL of VtD concen- tration, parathyroid hormone levels were maintained rather than decreased in the 20-22.5 ng/mL group, while hyperparathyroidism was not observed in the groups over 20 ng/mL (data no shown).
Hence we grouped according to the VtD level of 20 ng/mL and
compared the demographic variables. Obesity determined by BMI was high when VtD was less than 20 ng/mL although it was not statistically signifi cant (Table 2).
Obese individuals, as a group, have low VtD levels, which are as- sociated with increased plasma concentration of immunoreactive parathyroid hormone [14,15]. It was reported that adipose tis- sue isolates VtD in a person who has a high BMI, which, in turn, causes serum VtD level to decrease. Tsiaras and Weinstock [16]
investigated the relationship between obesity and VtD defi ciency.
Their study reported that there was no difference in ability to syn- thesize VtD between normal and obese people; however, the rea- son for VtD defi ciency was the decrease in secretion of VtD from the skin to the blood because VtD was isolated in the adipose tissue of the obese. On the contrary, Arunabh et al. [17] reported that blood VtD concentration was related to body fat content, not BMI or weight. They explained that adipose tissue content itself, not BMI, affected VtD level because VtD distribution was changed in the adipose tissue. This discrepancy may be explained by that high BMI people usually show not only high total body fat but also high total muscle mass, and high muscle mass was showed positive correlation with VtD [16].
Reasons for VtD defi ciency can include skin color, adipose tissue content in the body, taking drugs, fat absorption disorder, and increasing age, as well as physical factors such as clothes and sunscreen. BMI was not correlated to serum VtD level or PTH in this study. Scott et al. [18] reported VtD level is more affected by individual activity level rather than individual BMI [16]. Thus physi- cal activity of elderly in particular should be taken into account.
The subjects in this study are biased toward certain geographical locations, and the number of subjects used to generate data on VtD level in Korean menopausal women was relatively small, in that only 3 cases showed a level over 30 ng/mL level. Therefore, comparing the two groups using a standard of 30 ng/mL had its limitations. This limitation could be overcome in future studies by collecting subjects from a wider variety of geographic locations.
In conclusion, most Korean menopausal women show VtD defi- ciency, especially during the wintertime and VtD level show nega- tive correlation with BMI, but statistically not signifi cant.
References
1. Lumb GA, Mawer EB, Stanbury SW. The apparent vitamin D
resistance of chronic renal failure: a study of the physiology of
vitamin D in man. Am J Med 1971;50:421-44.
2. Rosenstreich SJ, Rich C, Volwiler W. Deposition in and release of vitamin D3 from body fat: evidence for a storage site in the rat. J Clin Invest 1971;50:679-87.
3. Mawer EB, Backhouse J, Holman CA, Lumb GA, Stanbury SW.
The distribution and storage of vitamin D and its metabolites in human tissues. Clin Sci 1972;43:413-31.
4. Bell NH, Shaw S, Turner RT. Evidence that 1,25-dihydroxyvita- min D3 inhibits the hepatic production of 25-hydroxyvitamin D in man. J Clin Invest 1984;74:1540-4.
5. Liel Y, Ulmer E, Shary J, Hollis BW, Bell NH. Low circulating vitamin D in obesity. Calcif Tissue Int 1988;43:199-201.
6. Wortsman J, Matsuoka LY, Chen TC, Lu Z, Holick MF. De- creased bioavailability of vitamin D in obesity. Am J Clin Nutr 2000;72:690-3.
7. Saintonge S, Bang H, Gerber LM. Implications of a new defi - nition of vitamin D deficiency in a multiracial us adolescent population: the National Health and Nutrition Examination Survey III. Pediatrics 2009;123:797-803.
8. Holick MF. High prevalence of vitamin D inadequacy and im- plications for health. Mayo Clin Proc 2006;81:353-73.
9. Chapuy MC, Preziosi P, Maamer M, Arnaud S, Galan P, Herc- berg S, et al. Prevalence of vitamin D insuffi ciency in an adult normal population. Osteoporos Int 1997;7:439-43.
10. Lips P, Duong T, Oleksik A, Black D, Cummings S, Cox D, et al.
A global study of vitamin D status and parathyroid function in postmenopausal women with osteoporosis: baseline data from the multiple outcomes of raloxifene evaluation clinical trial. J Clin Endocrinol Metab 2001;86:1212-21.
11. National Heart, Lung, and Blood Institute Obesity Education Initiative Expert Panel on the Identification, Evaluation, and Treatment of Obesity in Adults (US). Clinical guidelines on the identification, evaluation, and treatment of overweight and obesity in aults: The Evidence Report. Bethesda (MD): National Heart, Lung, and Blood Institute; 1998.
12. Holick MF. Sunlight and vitamin D for bone health and pre- vention of autoimmune diseases, cancers, and cardiovascular disease. Am J Clin Nutr 2004;80:1678S-88S.
13. Heaney RP. Functional indices of vitamin D status and ramifi - cations of vitamin D defi ciency. Am J Clin Nutr 2004;80:1706S-9S.
14. Bell NH, Epstein S, Greene A, Shary J, Oexmann MJ, Shaw S.
Evidence for alteration of the vitamin D-endocrine system in obese subjects. J Clin Invest 1985;76:370-3.
15. Andersen T, McNair P, Fogh-Andersen N, Nielsen TT, Hyldstrup L, Transbol I. Increased parathyroid hormone as a consequence of changed complex binding of plasma calcium in morbid obesity. Metabolism 1986;35:147-51.
16. Tsiaras WG, Weinstock MA. Factors infl uencing vitamin D sta- tus. Acta Derm Venereol 2011;91:115-24.
17. Arunabh S, Pollack S, Yeh J, Aloia JF. Body fat content and 25-hydroxyvitamin D levels in healthy women. J Clin Endocri- nol Metab 2003;88:157-61.
18. Scott D, Blizzard L, Fell J, Ding C, Winzenberg T, Jones G. A
prospective study of the associations between 25-hydroxy-
vitamin D, sarcopenia progression and physical activity in
older adults. Clin Endocrinol (Oxf) 2010;73:581-7.
건강한 폐경 후 여성에서 혈중 비타민 D 농도와 체질량지수의 상관관계
1고신대학교 의과대학, 2건국대학교 의학전문대학원, 3인제대학교 의과대학 상계백병원, 4성균관대학교 의과대학 창원삼성병원 산부인과학교실
5원광대학교 의과대학 원광의과학연구소
장선영1, 이지영2, 배재만2, 이철민3, 홍성남4, 김아리5, 김흥열1
목적
비만은 체내 비타민 D의 농도와 연관되어 있는 것으로 알려져 있다. 이에 폐경 여성의 혈중 비타민 D 농도와 체질량지수로 평가한 비만과 의 상관관계를 알아보고자 한다.
연구방법
혈중 비타민 D 농도와 비만과의 관계를 알아보기 위해 본 연구는 2005년 1월부터 2011년 3월까지 310명의 건강한 폐경 여성을 대상으 로 혈중 25 hydroxy vitamin D 농도와 체질량지수로 비만도를 측정하고, 골밀도, 골표지자 및 부갑상선 호르몬 농도와 같은 골건강 지표들 을 측정하였다. 혈중 비타민 D 부족의 기준을 30 ng/mL, 20 ng/mL로 각각 나누어 체질량지수를 비롯한 각종 변수들과의 상관관계를 분 석하였다.
결과
혈중 비타민 D 부족을 30 ng/mL 기준으로 하였을 때 98.9%가, 20 ng/mL를 기준으로 하였을 때 87.8%가 비타민 D 결핍증을 보였다. 연 령, 신장, 체중, 골밀도, 골표지자 모두 비타민 D 농도와 유의한 상관관계를 보이지 않았고 부갑상선 호르몬 농도는 혈중 비타민 D 농도와 음의 상관관계를 보였다. 체질량지수는 비타민 D와 음의 상관관계를, 부갑상선 호르몬 농도와 양의 상관관계를 보였으나, 통계적으로 유 의하지 않았다.
결론
폐경 여성 중 약 87.8%-98.9%인 대다수 여성이 비타민 D 부족상태를 보이며 혈중 비타민 D 농도와 체질량지수 사이에 유의한 상관관계 는 없었다.
중심단어: 비타민 D, 체질량지수, 비만, 폐경 후 여성