소금민감성 SLC12A3 유전자 다형성에 따른 나트륨섭취가 소아비만에 미치는 영향*
정주현1
·
이명숙1,2†성신여자대학교식품영양학과,1비만과학연구소2
Effects of interaction between SLC12A3 polymorphism, salt-sensitive gene, and sodium intake on risk of child obesity *
Jung, Joohyun
1· Lee, Myoungsook
1,2†1Department of Food and Nutrition, Sungshin Women’s University, Seoul 01133, Korea
2Research Institute of obesity Sciences, Sungshin Women’s University, Seoul 01133, Korea
서 론
우리나라의 소아비만 유병률은 1997년 5.8%, 2007년 10.9%, 2012년 14.7%으로 꾸준히 증가하고 있는 추세이 며 특히 6~11세의 경우 과체중 이상 (과체중 11.7% + 비만 8.8%)의 비율이 20.5%로, 다른 연령대에 비하여 비교적 높 게 나타났다.1-3소아 비만의 큰 문제점은 75%가 성인비만 으로 이어져서 당뇨, 고혈압, 이상지질혈증, 인슐린저항성 및 동맥경화 등 만성대사성 질환의 위험을 증가시키는 것 이다.4-6
최근, 한국소아의 나트륨 섭취량이 계속적으로 증가하 는 추세이다. 나트륨 기호도는 6세 이전에 이미 형성된다 는 연구와 함께 소아기의 대사적 특성이 성인시기로 이어 지는 경향이 크므로 영유아기부터의 식습관 관리가 중요 하다.7-9 비만발생에는 다양한 형태의 식이섭취가 복합효 과로 나타나지만 과량의 나트륨 섭취가 비만과 관련있다 는 연구논문이 제시되고 있다. 나트륨 (Na)은 혈액량 조절, 삼투압 평형, 세포막 전위 조절 및 영양소이동 등 세포의 기본적인 기능을 위하여 필수적인 전해질이지만 과다한 나트륨의 섭취는 체액이 배설되지 않고 체내에 머무는 저 ABSTRACT
Purpose: Obesogenic environments in children, in particular excessive intake of sodium, generate hypertension, which is a major risk factor for chronic diseases. Methods: In all, 725 children, 379 boys and 373 girls, aged 8~9 years were recruited from seven elementary schools in Kuro-ku, Seoul. To evaluate whether or not obesity risk was modulated by salt-sensitive genes, Solute Carrier Familiy 12 member 3 (SLC12A3) was used as the target. After children were assigned into obese (BMI
> 85 percentile) or non-obese groups, anthropometry, blood biochemistry, and dietary intakes were measured according to the genotypes GG (wild) or GA+AA (hetero+mutant). Results: Without gender differences, high TG and low HDLc were detected in the obese group compared to the non-obese group. Regardless of obesity, weight gain and blood pressure (BP) increased in the SLC12A3 GA+AA genotype rather than in the GG type. HDLc was associated with obesity risk without genotype difference. Odd ratios for risk of obesity were 15.57 (95% CI 2.192~110.654), 22.84 (95% CI 1.565~333.469), and 9.32 (95%CI 1.262~68.817) in boys and girls with GA+AA genotypes as sodium intake increased above 4,000 mg/day.
Dietary calcium, sodium, folate, and vit C were associated with obesity risk according to gender or genotype differences.
Since high folate intake reduced obesity risk in only boys with GG type. Risk for overweight and obesity increased in boys with GA+AA genotypes and dietary habits with high sodium and cholesterol and low folate. Conclusion: The A allele of SLC12A3 rs11643718 was sensitive to development of obesity in children as sodium intake increased.
KEY WORDS: children obesity, sodium intake, salt sensitive gene, SLC12A3
Received: January 11, 2017 / Revised: January 23, 2017 / Accepted: February 2, 2017
*This work was supported by the National Research Foundation of Korean (NRF) grant funded by the Korea government (MSIP:
2014R1A2A1A11049611/1).
†To whom correspondence should be addressed.
tel: +82-2-920-7211, e-mail: [email protected]
© 2017 The Korean Nutrition Society
This is an Open Access article distributed under the terms of the Creative Commons Attribution Non-Commercial License (http://creative- commons.org/licenses/by-nc/3.0/) which permits unrestricted non-commercial use, distribution, and reproduction in any medium, provided the original work is properly cited.
류를 유도하고 고혈압 등 심혈관 질환, 2형 당뇨 및 복부비 만 등 만성질환의 주요한 위험요인이 된다.10-13 따라서 WHO에서는 하루 생리적 요구량인 2 g 이내로 나트륨 섭 취를 줄이면 혈압과 만성질환의 위험이 감소한다는 보고 하였으며, 메타분석에서도 나트륨 제한 및 칼륨, 칼슘 섭취 의 증가가 혈압 강하효과를 나타내고 있다고 한다.14-16
소금민감성 유전자 (11개 SNP)를 대상으로 한 선행연구에 서 GRK4 A486V (rs1801058), ACE (rs4341) 및 SLC12A3 (rs116437818) 등의 돌연변이를 가진 남자와 GRK4 A486V 및 CYP11β2 (rs1799998) 돌연변이를 가진 여자가 고나트 륨섭취를 할 경우 비만의 위험성이 높아진다고 보고하였 다.9이들 중 남녀 성별차이를 보이는 유전자인 solute carrier familiy 12 member 3 (SLC12A3)은 1,002~1,030개 아미노 산 잔기를 가지고 있으며 Na-Cl 공동이동체 혹은 이뇨제인 Thiazide-민감이동체라고도 한다.17,18SLC12A3는 신장 네 프론의 원위세뇨관 (distal convoluted tubule, DCT) 세포 막에 위치하며 Na+와 Cl−을 동시에 세포내로 이동시키는 재흡수 기능을 한다.19따라서 SLC12A3에 유전적 돌연변 이가 발생하면 나트륨 재흡수 장애, 저혈압, 저칼슘혈증, 저 마그네슘혈증, 저칼륨혈 대사성 알칼리혈증 (hypokalemic metabolic alkalosis)의 증상을 보이는 지틀만 증후군 (Gitelman’s syndrome)이 발병한다.20즉, 체내에 필요한 전 해질의 배출은 근육경련, 허약감, 사지마비 등 2차적인 증 후가 발현될 수 있으므로 SLC12A3는 전해질 조절 및 혈압 조절 등 체내에서 매우 중요한 기능을 한다. SLC12A3의 세 포막 수송 및 활성화 (인산화)시키는 작용은 Witii No lysine kinases (WNKs)에 의해 조절된다. WNKs는 신장에 서 이온채널수송에 관련하는 경로의 중심에 있으며, 직접 적 혹은 간접적으로 STK39 (SPAK or Ste20/SPSl_related kinase)를 통하여 SLC12A3를 인산화 (활성화)시킨다.21,22 또한 WNK4이 라이소좀경로를 통해 분해되면 SLC12A3 활성은 억제되는데 이때 renin-angiotensin-aldosterone system (RAAS)기전에 관여하는 angiotensin II가 WNK4 를 통하여 STK39를 자극하여 SLC12A3 발현억제에 대응 하는 기전에 관여한다.23,24 Aldosterone 및 estrogen 등도 SLC12A3의 유전자발현을 증가킨다는 연구 결과도 있다.25 따라서 소아기의 나트륨 섭취 조절은 향후 성인기의 만성 질환 발병에 중요한 영향을 미치므로 본 연구의 목적은 소 아비만을 대상으로 나트륨 재흡수의 기능을 하는 SLC12A3 rs11643718 유전자 다형성에 따른 비만발생과 관련된 바 이오마커 및 식이섭취인자 등의 변화에 미치는 영향을 보 고자 한다.
연구방법
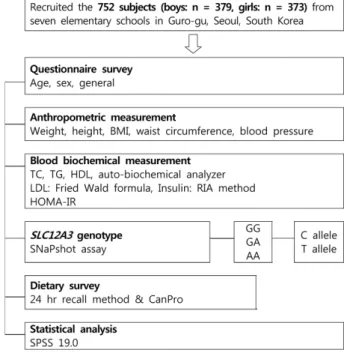
대상자 선정 및 연구 디자인본 연구는 성신여자대학교 연구지원팀의 IRB심의 및 승 인 (IRB 승인번호 SSWU IRB 2012-003)을 받아 진행하였 다. 대상자는 서울 구로구의 8개의 초등학교 3학년생을 대 상으로 공지 후 신청을 통한 자발적인 지원자들로 구성 되 었으며, 모집자 중 조사 결측값이 누락된 경우 (유전자 분 석, 식이설문) 혹은 BMI 백분위 5 이하의 저체중에 속하는 대상자를 제외하고 최종적으로 총 752명 (남학생: 379명 여학생: 373명)을 연구대상자로 하였다. 2007년 대한소아 과학회에서 발표한『소아 및 청소년 표준 성장도표』에서 제시한 비만의 진단기준을 이용하여 성별에 따른 연령별 BMI의 백분위수가 95 백분위수 이상인 비만그룹과 85분 위수 이상인 과체중그룹을 포함하여 비만군으로 분류하 고 85 백분위수 (8~9세 남아: 19.80, 여아: 19.05) 미만을 정 상군으로 분류하였다.26최종 대상자에게 신체계측 (신장, 체중, 허리둘레, BMI, 혈압 등), 혈액검사 (유전자 분석, 지 질, 혈당, AST/ALT, 등) 및 식사조사를 수행하였다 (Fig.
1).
SLC12A3 rs11643718 유전자 다형성분석과 분류 DNA 추출은 LaboPassTM Blood MiniKit (Cosmo genetech)를 사용하였다. protease 20 µl에 whole blood 200 µl를 넣은 후 BL Buffer 200 µl를 첨가하여 잘 섞은 후, 6oC
Fig. 1. Experimental design of the cross-sectional study
에서 20분간 배양한다. DNA를 침전시키기 위해 ethanol (99.9%) 200 µl를 넣고 vortex하여 spin column에 옮긴 후 8,000 rpm에서 원심분리하였다. BW Buffer 700 µl와 NW Buffer 500 µl를 1분과 5분에서 각각 원심 분리하여 남아있 는 완충액을 완전히 제거한 후 AE Buffer 200 µl를 첨가하 여 실온에서 2분간 배양하여 8,000 rpm에서 1분간 원심분 리하여 실험시까지 -80oC에서 냉동 보관하였다. SLC12A3 의 SNP 분석은 SNaPshot® assay을 이용하였다. PCR 반응 을 위한 반응액은 template DNA 10 ng, forward/reverse primer 각각 0.5 pM, 10X PCR buffer IpLi, dNTP 250 µM, DNA Taq polymerase 0.25 unit를 넣고 최종부피가 10 µl 가 되도록 증류수를 넣어 혼합한 후 Dual 384-Well Gene Amp PCR System 9700을 이용하여 95oC-10분, 1 cycle;
95oC-30초, TmoC-1분, 72oC-1분, 35 cycles; 72oC-10분, 1 cycle 동안 반응시킨 푸 생성된 PCR을 수행하였다. Primer extension reaction을 위해 정제 된 PCR 산물 1 µl을 0.15 pM genotyping primer (5-CTCCCTCTATAAATCCAA AACAAACTTACTCTCACC-3)이 포함된 SNaPshot Ready Reaction mixture에 넣어 96oC-10초, 50oC-5초, 60oC-30초 의 3단계를 25 cycles 수행하였다. 과량의 fluorescent dye terminators를 제거하기 위하여 반응산물에 SAP (shrimp alkaline phosphatase) l unit을 넣어 37oC-75분, 72oC-15분 간 반응시켰다. 반응산물 1 µl에 Hi-Di formamide 9 µl를 넣어 95oC에 5분간 두었다가 얼음에 5분간 둔 후 ABI Prism® 3730x1 DNA Analyzer (Applied Biosystems, USA)를 이용하여 분석하였다. 결과의 분석은 Gene Mapper 4.0 analysis software (Applied Biosystems, USA)를 이용 하였다. SLC12A3 rs11643718 유전자형을 분석한결과 AA 유전자형은 5명에 불과하여 wild type인 GG와 minor allele인 A를 가진 hetero type과 mutant type을 합한 GA + AA로 구분하여 데이터 분석을 하였다.
혈중 Biochemistry
12시간 이상 공복을 유지한 후 생화학적 분석 및 유전자 검사를 위하여 채혈하여3,000 rpm에서 15 분간 원심분리 하여 혈장을 수집하였고, 분석 전까지 -80oC에서 냉동 보 관하였다. 본 연구에서 이용된 일반 생화학 측정인자들은 자동분석기 (HITACHI 7600-110, Hitachi Ltd, Tokyo, Japan) 혹은 효소법 (신양 kits, 한국)으로 측정하였다. 지질 관련 인자인 종 콜레스테롤 (total cholesterol, TC)과 중성 지방 (triglyceride, TG), HDL-콜레스테롤 (high density lipoprotein-cholesterol, HDLc)은 자동혈액분석기 (Ekachem DTSC module, Johnson & johnson, USA)를 이용하였고, LDL-콜레스테롤 (LDLc)은 Friedwald 공식 [LDLc=TC-
HDLc-TG/5]에 의해 계산하였다.27 혈중 인슐린 농도는 ECLIA (electro chemiluminescence immunoassay)방법을 이용한 자동면역분석기 (automated immunology analyzer ElecSys 2010, Roche Diagnostics)를 이용하여 측정하였 다. 인슐린 저항성 인자인 HOMA-IR (homeostasis model assessment of insulin resistance)은 공복혈당, 공복 혈중인슐 린을 측정한 후 Matthewa 공식 [공복 혈중인슐린 (µU/mL)
× 공복 혈당 (mmol/L) / 22.5]을 이용하여 계산하였다.28 식이 설문 조사 및 영양소 분석
각 대상자는 채혈 당일, 1일 평균 섭취량을 조사하기 위 하여 24시간 회상법을 이용하여 식이 설문조사에 응하였 다. 24시간 회상법을 이용한 식이 조사는 숙련된 설문요원 에 의하여 진행되었으며, 연속되지 않는 주중 2일, 주말 1일 의 식이 조사가 수행되었다. 섭취한 음식의 종류와 양은 대 상자의 부모님 혹은 보호자가 작성하도록 하였고, 내용이 미흡할 경우 학생 혹은 학교의 급식담당 영양사과 직접 면 담하여 추가 조사하였다. 섭취한 식품의 영양소 분석은 한 국영양학회에서 개발한 Can-Pro 4.0 SW를 이용하였다. 대 상자의 총 열량 섭취는 매우 상이하고 비만 판정의 결정인 자가 될 수 있기 때문에 Willet등이 이용한 열량 보정법을 사용하였다.29영양소 섭취를 종속 변수로, 총 열량을 독립 변수로 놓은 회귀분석을 통해 구한 영양소 섭취량의 잔차 (residual)에 평균열량 섭취에 대해 예측된 영양소의 섭취 량을 더하여 에너지 보정영양소를 구하였다.
통계 분석
본 연구 자료는 SPSS 19.0 statistical package (SPSS Inc, Chicago, IL, USA)을 이용하여 분석하였으며, 각 집단의 항 목에 대한 모든 측정치는 평균 (mean) ± 표준오차 (standard error, SE) 혹은 표준편차 (standard deviation, SD)로 산 출하였다. 식이섭취자료는 총열량 섭취를 보정한 값을 통계분석에 이용하였다. SLC12A3 (rs11643718) SNP의 genotype형 분포에 관한 분석은 chi-square test를 사용하 였으며 Hardy–Weinberg equilibrium 원칙에 어긋나지 않 았다. 따라서 각 변수들간의 상관관계는 partial pearson's correlation coefficents (r)와 chi-square test로 분석하였다.
유전자 다형성과 섭취 영양소, 혈중 생화학지표 간의 상호관 계 연구를 위해 단계적 선형회귀분석 (stepwise regression) 과 로지스틱 회귀분석 (logistic regression analysis)을 통 해 비만의 위험도를 구하고 유의성 검증은 신뢰구간 95%
수준에서 시행하였다. 평균 간의 유의성 검증은 p < 0.05 수준에서 행해졌다.
결 과
SLC12A3 rs11643718 유전자 다형성에 따른 특성 비만군과 정상군에서 SLC12A3 유전자의 빈도조사를 위하여 chi-square 검정을 한 결과, 총 대상자에서의 비만 비율은 GA + AA형이 25.0%로 GG형 (15%) 보다 유의적 으로 많았다 (Table 1). 남아의 경우 비만 비율은 GA + AA 형이 30.0%로, GG형 (17.9%)보다 높았고, 여아의 경우는 유의적인 차이가 없었다. SLC12A3 유전형을 GG (wild;
628명)형과 GA + AA (hetero + mutant; 124명)형으로 나누 어 비교하면 체중, 허리둘레, BMI, BP 모두 GA + AA형이 증가하였으나 그외 유전자별 지질인자, 인슐린저항성 인 자 및 영양소 섭취 등의 차이는 없었다 (data not shown).
연구 대상자의 BMI에 따른 일반적인 특성
전체 대상자의 신체계측 결과, 신장, 체중, 허리둘레, BMI, 수축기혈압 등이 남자가 여자보다 높았고 혈중 TG 의 경우만 여자 (76.93 mg/dL)가 남자 (68.82 mg/dL)보다 높았고 영양소 섭취량은 남녀 간 차이가 없었다.
남녀 모두 비만군에서 신체 계측 수치 (신장, 체중, 허리 둘레, BMI)가 정상군보다 유의적으로 높게 나타난다 (Table 2). 평균 BMI는 남녀 모두 정상군은 50 백분위이하이고 비 만군은 95 백분위 이상에 속하였으며 특히 허리둘레의 경 우, 비만한 남자는 90백분위 이상, 비만한 여자는 75~90백 분위 사이로 나타났다. 즉, BMI 85 백분위 이상을 비만군 으로 하였으나 남아와 여아 모두 비만군의 신장, 체중, 허 리둘레, BMI 지수가 95 백분위 이상의 평균치를 보였다.
혈중 생화학 분석결과, 남아에서는 비만군이 정상군에 비 하여 혈중 ALT, SBP, DBP, TG, 인슐린이 높고 HDLc이 낮 은 반면, 여아는 비만군이 ALT, TG, LDLc, FBS, 인슐린, HOMA-IR 수치가 높고 HDLc이 낮았다. 남녀 모두 비만 군에서 높은 TG와 낮은 HDLc를 보여주었고 비만한 남아 는 혈압에, 비만한 여아는 인슐린저항성에 더 민감한 반응 을 보였다. 반면 대부분의 영양소섭취량에서 유의적인 차 이가 없었으나 비타민 C섭취의 경우, 정상군 (92.12 ±
46.44 mg)이 비만군 (81.27 + 39.91 mg)보다 유의적으로 많이 섭취하였다 (data not shown).
BMI와 SLC12A3 rs11643718 유전자의 interaction에 따른 특성
BMI에 따른 비만군과 정상군에서 SLC12A3 유전자형으 로 분류한 다음 신체계측, 혈액수치, 식사조사 등을 분석하 였다. 비만군과 정상군에 속한 남녀 모두 GA + AA형을 가 진 소아가 GG형보다 체중, 허리둘레, BMI가 유의적으로 높았다 (Table 2). 혈액수치에서도 비만군과 정상군에 속 한 GA + AA형을 가진 소아가 GG형보다 ALT, SBP, DBP,TG, LDLc가 유의적으로 높았다. 단 HDLc의 경우 정 상군에서는 GA + AA가 비만군에서는 GG형이 더 높았으 며 여아의 경우도 같은 경향이었으나 남아의 경우 정상군 과 비만군 모두 GA + AA형이 더 높았다. 식이조사 결과에 의하면, Ca 섭취가 비만군과 정상군 에서 GA + AA이 GG 형에 비하여 유의적으로 증가하였다. Na섭취의 경우, 비만 군에서 GA + AA형이 GG형보다 유의적으로 증가한 반면 정상군의 GA + AA형은 섭취가 감소하였다. 비타민 C의 경우, 비만군의 GG 형이 정상군의 GG형보다 섭취가 감소 하였다.
SLC12A3 rs11643718 유전자 다형성에 따른 비만 지 표 (BMI)와 섭취 영양소와의 상관성
SLC12A3 유전자형에 따른 BMI 변화에 미치는 혈중 생 화학 지표와 섭취 영양소의 영향을 알아보기 위하여 단계 적 회귀분석을 실시하였다. SLC12A3의 GG 유전자형을 가진 소아의 경우, SBP, HDLc, TC, FBS, insulin, 식이 콜 레스테롤, 비타민 C의 섭취가 유의적으로 BMI 증감에 영 향을 미치는 것으로 나타났으며, GG + GA 유전자형을 가 지는 소아에서는 SBP, HDLc, TC, 인슐린 수치가 유의적 으로 BMI에 영향을 미치는 것으로 확인되었다. 따라서 신 장, 체중, 허리둘레는 BMI에 직접적인 영향을 미치는 요인 이므로 제외하고 단계적 회귀분석을 통해 영향력이 크다 고 검증된 변수들을 회귀모형에 포함시켰으며 종속 변수
Table 1. Relative frequencies of SLC12A3 rs11643718 genotypes in obese and non-obese boys and girls
Total Boy Girl
non-OB OB1) non-Ob OB non-OB OB
GG 530 (84.4)2) 98 (15.6) 262 (82.1) 57 (17.9) 268 (86.7) 41 (13.3)
GA + AA 93 (75.0) 31 (25.0) 42 (70.0) 18 (30.0) 51 (79.7) 13 (20.3)
P-value 0.011 0.030 0.145
1) Obesity classification by BMI percentiles; obesity ≥ 95 percentile, 85 percentile ≤ overweight < 95 percentile, normal < 85 percentile for Korean children obesity criteria from Korean society of obesity. In this obese (OB) group, the overweight group was included. 2) Num- ber of subjects (%)
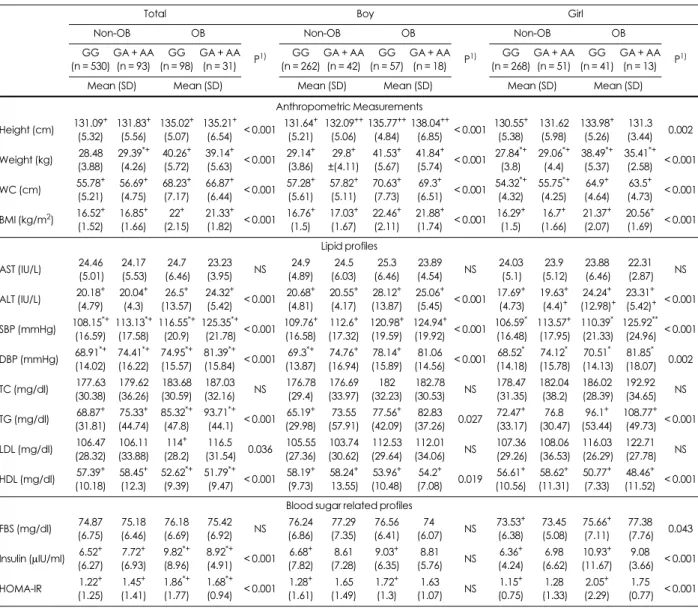
는 BMI85 백분위 기준으로 구분하였다. GG 유전자형을 가지고 있는 소아는 혈중 인슐린 및 FBS 등이 높은 경우 (high-카테고리)와 비만이 될 위험도가 유의적으로 증가하 였고 식이 콜레스테롤섭취가 감소할수록 엽산의 섭취가 적절할 경우 비만위험도는 감소하였다 (Fig. 2와 3). 반면, GA + AA 유전자형을 가지고 있는 소아는 혈중 지질수치 보다 식이섭취에 영향을 더 많이 받았다. 단, 유일하게 high-HDLc의 경우는 남녀 및 유전자형에 상관없이 비만 위험도가 0.378배 (95% CI: 0.187~0.785)로 감소하였다.
즉, GA + AA 유전자형을 가지고 있는 소아는 식이콜레스
테롤섭취가 medium-카테고리 (289~388 mg/day)시 위험 도가 5.523배 (95% CI: 1.134~26.887) 증가하였으며 나트 륨은 약 4,000 mg/day 이상 (high-카테고리) 섭취할 경우 비만위험도가 15.574배 (95% CI: 2.192~110.654) 증가하 였다. 특히 GA + AA 유전자형을 가진 남아는 고나트륨 섭 취시 22.84배 (95% CI: 1.566~333.469) 의 위험도가 증가 하고 GA + AA 유전자형을 가진 여아가 고나트륨 섭취시 9.23배 (95% CI: 1.262~68.817) 위험도가 증가하였다. 즉, GA + AA 유전자형을 가진 남아는 여아보다 나트륨 섭취 량에 따라 과체중이 될 확률이 더 높다는 것을 알 수 있다.
Table 2. Anthropometry and blood biochemistry in obese and non-obese boys and girls according to SLC12A3 rs11643718 genotypes
Total Boy Girl
Non-OB OB
P1)
Non-OB OB
P1)
Non-OB OB
P1) GG
(n = 530) GA + AA
(n = 93) GG (n = 98)
GA + AA (n = 31)
GG (n = 262)
GA + AA (n = 42)
GG (n = 57)
GA + AA (n = 18)
GG (n = 268)
GA + AA (n = 51)
GG (n = 41)
GA + AA (n = 13)
Mean (SD) Mean (SD) Mean (SD) Mean (SD) Mean (SD) Mean (SD)
Anthropometric Measurements Height (cm) 131.09+
(5.32) 131.83+
(5.56) 135.02+
(5.07) 135.21+
(6.54) < 0.001 131.64+ (5.21)
132.09++
(5.06) 135.77++
(4.84) 138.04++
(6.85) < 0.001 130.55+ (5.38)
131.62 (5.98)
133.98+ (5.26)
131.3 (3.44) 0.002 Weight (kg) 28.48
(3.88) 29.39*+
(4.26) 40.26+
(5.72) 39.14+
(5.63) < 0.001 29.14+ (3.86)
29.8+
±(4.11) 41.53+ (5.67)
41.84+
(5.74) < 0.001 27.84*+
(3.8) 29.06*+
(4.4) 38.49*+
(5.37) 35.41*+
(2.58) < 0.001 WC (cm) 55.78+
(5.21) 56.69+
(4.75) 68.23+
(7.17) 66.87+
(6.44) < 0.001 57.28+ (5.61)
57.82+ (5.11)
70.63+ (7.73)
69.3+
(6.51) < 0.001 54.32*+
(4.32) 55.75*+
(4.25) 64.9+ (4.64)
63.5+ (4.73) < 0.001 BMI (kg/m2) 16.52+
(1.52) 16.85+
(1.66) 22+ (2.15)
21.33+
(1.82) < 0.001 16.76+ (1.5)
17.03+ (1.67)
22.46+ (2.11)
21.88+
(1.74) < 0.001 16.29+ (1.5)
16.7+ (1.66)
21.37+ (2.07)
20.56+ (1.69) < 0.001 Lipid profiles
AST (IU/L) 24.46 (5.01)
24.17 (5.53)
24.7 (6.46)
23.23
(3.95) NS 24.9
(4.89) 24.5 (6.03)
25.3 (6.46)
23.89
(4.54) NS 24.03 (5.1)
23.9 (5.12)
23.88 (6.46)
22.31 (2.87) NS ALT (IU/L) 20.18+
(4.79) 20.04+
(4.3) 26.5+ (13.57)
24.32+
(5.42) < 0.001 20.68+ (4.81)
20.55+ (4.17)
28.12+ (13.87)
25.06+
(5.45) < 0.001 17.69+ (4.73)
19.63+ (4.4)+
24.24+ (12.98)+
23.31+ (5.42)+ < 0.001 SBP (mmHg) 108.15*+
(16.59) 113.13*+
(17.58) 116.55*+
(20.9) 125.35*+
(21.78) < 0.001 109.76+ (16.58)
112.6+ (17.32)
120.98+ (19.59)
124.94+
(19.92) < 0.001 106.59* (16.48)
113.57+ (17.95)
110.39* (21.33)
125.92**
(24.96) < 0.001 DBP (mmHg) 68.91*+
(14.02) 74.41*+
(16.22) 74.95*+
(15.57) 81.39*+
(15.84) < 0.001 69.3*+
(13.87) 74.76+ (16.94)
78.14+ (15.89)
81.06
(14.56) < 0.001 68.52* (14.18)
74.12* (15.78)
70.51* (14.13)
81.85* (18.07) 0.002 TC (mg/dl) 177.63
(30.38) 179.62 (36.26)
183.68 (30.59)
187.03
(32.16) NS 176.78 (29.4)
176.69 (33.97)
182 (32.23)
182.78
(30.53) NS 178.47 (31.35)
182.04 (38.2)
186.02 (28.39)
192.92 (34.65) NS TG (mg/dl) 68.87+
(31.81) 75.33+ (44.74)
85.32*+
(47.8) 93.71*+
(44.1) < 0.001 65.19+ (29.98)
73.55 (57.91)
77.56+ (42.09)
82.83
(37.26) 0.027 72.47+ (33.17)
76.8 (30.47)
96.1+ (53.44)
108.77+ (49.73) < 0.001 LDL (mg/dl) 106.47
(28.32) 106.11 (33.88)
114+ (28.2)
116.5
(31.54) 0.036 105.55 (27.36)
103.74 (30.62)
112.53 (29.64)
112.01
(34.06) NS 107.36 (29.26)
108.06 (36.53)
116.03 (26.29)
122.71 (27.78) NS HDL (mg/dl) 57.39+
(10.18) 58.45+
(12.3) 52.62*+
(9.39) 51.79*+
(9.47) < 0.001 58.19+ (9.73)
58.24+ 13.55)
53.96+ (10.48)
54.2+
(7.08) 0.019 56.61+ (10.56)
58.62+ (11.31)
50.77+ (7.33)
48.46+ (11.52) < 0.001 Blood sugar related profiles
FBS (mg/dl) 74.87 (6.75)
75.18 (6.46)
76.18 (6.69)
75.42
(6.92) NS 76.24 (6.86)
77.29 (7.35)
76.56 (6.41)
74
(6.07) NS 73.53+ (6.38)
73.45 (5.08)
75.66+ (7.11)
77.38 (7.76) 0.043 Insulin (µIU/ml) 6.52+
(6.27) 7.72+ (6.93)
9.82*+
(8.96) 8.92*+
(4.91) < 0.001 6.68+ (7.82)
8.61 (7.28)
9.03+ (6.35)
8.81
(5.76) NS 6.36+ (4.24)
6.98 (6.62)
10.93+ (11.67)
9.08 (3.66) < 0.001
HOMA-IR 1.22+
(1.25) 1.45+ (1.41)
1.86*+
(1.77) 1.68*+
(0.94) < 0.001 1.28+ (1.61)
1.65 (1.49)
1.72+ (1.3)
1.63
(1.07) NS 1.15+ (0.75)
1.28 (1.33)
2.05+ (2.29)
1.75 (0.77) < 0.001 1) P-value: Significantly differences of indicators among the 4 groups in total, boys and girls, NS: non-significant (p > 0.05)
*Significantly differences between GG and GA+AA in non-OB or OB groups (*p < 0.05, **p < 0.01).
Significantly differences between non-OB and OB groups in GG or GA+AA genotype (p < 0.05).
Abbreviation: WC, waist circumferences; BMI, body mass index; AST, aspartate transaminase; ALT, alanine transaminase; SBP, systolic blood pres- sure; DBP, diastolic blood pressure; TC, total cholesterol; TG, triacylglycrides; HDLc, high-density lipoprotein cholesterol; LDLc, low-density lipopro- tein cholesterol; FBS, fasting blood glucose; HOMA-IR, homeostasis model assessment of insulin resistance
(Fig. 3) 남아에서는 나트륨 섭취량이 medium–카테고리 (3,326~3,955 mg/day)에 속할 경우가 고나트륨 섭취자보 다 비만위험도 (OR: 54.01, 95% CI: 3.313~931.166)가 더 높았다. 나트륨 섭취정도에 따른 BMI 변화 또한 비만위험 도 (odd ratio)와 같은 경향을 보여주어서 소아에서 GA + AA 유전자형이 GG보다 나트륨섭취에 민감한 비만이 발 생할수 있음을 보여주었다.
고 찰
조사당시 대상자의 발육상태는 질병관리본부와 대한소 아과학회에서 발행한 표준성장도표와 비교하면 8~9세 남 녀의 체중 및 신장은 표준치 (남: 27.81 kg, 129.05 cm, 여:
26.93 kg, 127.76 cm)보다 높고 BMI 지수 또한 표준치인 (남: 16.97, 여: 16.51)보다 높았다. 허리둘레는 남아는 50 백분위수 (58.8 cm)보다 약간 높게 나타났지만, 여아는 50 백분위수 (57.1 cm)보다 약간 낮은 수치를 보였다.1전체적 으로 본 연구대상자가 한국 8~9세 남녀평균보다 발육상태 가 좋다.
전체적으로 남아가 여아보다, 과체중을 포함한 비만군 이 정상군보다 신체지수, 혈액지수, 식사섭취량이 여아보 다 높았다. 남녀 모두 비만군이 높은 TG와 낮은 HDLc를 보여주었지만 비만한 남아는 혈압에, 비만한 여아는 인슐
린저항성에 더 민감한 반응을 보였다. 본 연구결과 소아에 서의 고HDLc은 성인과 마찬가지로 비만을 해소하는 역할 뿐만 아니라 심혈관계질환의 위험을 낮추는 주요역할을 하므로 HDLc을 증가시키는 환경을 만드는 것이 중요하겠
다.30,31또한 소아비만의 경우에도 높은 BMI가 인슐린저
항성인자인 혈중 인슐린 및 HOMA-IR을 증가시키므로 소 아비만이 성인이 되는 과정에 빠르게 성인병이 나타나는 위험성을 제시한 것이다.4,32 본 연구에서는 leptin 등과의 상관관계를 확인하지는 않았지만 인슐린이 과체중과 비 만한 소아에서 유의적으로 높았으며 FBS, leptin과도 양의 상관관계가 있다는 보고가 있다.33 특히 소아비만군에서 비타민 C 섭취가 낮은 결과를 보였는데 비타민 C는 항산 화능을 가진 대표적인 미량영양소로서, 아디포넥틴과 정 의 상관관계, 렙틴, CRP (c-reactive protein)와 역의 상관관 계를 가지며, 렙틴과 상관성이 있는 비타민 A와 C 및 아연 등이 비만, 지방과다증과 관계가 있다고 보고되었다.33-35
사전연구에서 SLC12A3의 A allele를 가진 남아가 1일 5,000 mg/day 이상 나트륨을 섭취하면 혈압상승과 관계 없이 비만위험도 (OR)가 45.09배로 증가하였다.9본 연구 에서도 GA + AA 유전자형을 가진 남아는 고나트륨 섭취 (> 4,000 mg/day)시 혈압 상승과 함께 비만위험도가 22.84 배로 증가하였다. 따라서 SLC12A3 유전자변이를 가진 남 자가 나트륨 섭취를 증가시킬 때 더욱 민감하게 성별 차이
Fig. 2. Odd ratio of the risk of obesity by categories of plasma HDLc and insulin levels according to SLC12A3 genotypes, GG vs GA + AA.
Categories of HDLc levels or in each tertiles of total subjects are > 51.92, 51.92 ~ 60.34, ≥ 60.35 mg/day, insulin levels in each tertile are <
4.40, 4.41 ~ 7.33, ≥ 7.34 mg/day.
를 보이는 유전자임을 알 수 있었다. 본 연구에 사용된 SLC12A3의 rs11643718 SNP도 rs5804와 마찬가지로 혈압 과 관련성이 높으며 rs5804의 C allele은 고혈압의 위험도 를 감소하는 것과 연관이 있다고 하였다.36본 연구에서는 SLC12A3 (rs11643718)의 A allele을 가지고 있으면 혈압 이 높아지는 것으로 보인다. 반면, 소금민감성의 성별차이 를 보이는 ACE를 대상으로 다형성 (I/D)에 따른 분석을 시 도한 결과 D형을 가진 여자가 남자보다 고나트륨 섭취시 비만하여 성별차이가 다르게 나타났다.39이는 나트륨 이 외의 비만관련 식이 및 기타 환경도 영향을 주었을 것으로 생각된다. 예를 들면 GA + AA 유전자형을 가진 비만아동 이 GG 혹은 정상군보다 나트륨 섭취와 동시에 칼슘섭취 도 증가하였는데 칼슘은 혈압을 감소시키는 기능을 하기 때문에 나트륨섭취증가에 따른 혈압상승을 억제하기 위 한 항상성 효과로 보여진다. 12~17세 청소년기 남녀를 대 상으로 유제품과 혈압의 관계를 연구한 결과 청소년기 여 자는 유제품, 특히 칼슘 섭취와 혈압은 음의 상관관계를 가 지며, 이는 칼슘이 혈압을 감소시키는 효과가 있다고 하였 다.37또한, 8~10세의 소아를 대상으로 한 연구에서도 유제 품을 많이 섭취하면 혈압이 낮아지며, 유제품에 함유된 칼 슘의 효과로 보여진다.38 또한 식이 콜레스테롤과 엽산의 섭취가 BMI 변화에 유의적으로 영향을 미치는 것으로 확
인되었다. 엽산은 호모시스테인을 재메틸화하여 메티오닌 대사에 관여하는데 호모시스테인은 혈관내벽 손상, 평활근 증식, 프로코아귤런트 활성, 염증반응, 산화스트레스를 초 래하여 심혈관계질환 및 뇌졸중의 위험인자이다.40따라서 혈중 엽산은 소아와 청소년기 아이들에서 체지방량, BMI 와 혈청 호모시스테인 농도와 음의 상관관계가 있으며, 소 아비만에서 엽산섭취량이 낮다는 연구가 있다.41,42 이는 엽산이 결핍되면 활성산소생성을 유도하여 에너지 대사, 염증 반응에 영향을 미치고 지방합성에 의한 지방세포 증 식에 기여하여 비만의 위험도를 증가시킨다.43,44 따라서 엽산보충은 호모시스테인 수치를 감소시키서 심혈관계질 환 및 비만의 위험도를 억제한다.45그러나 이와 같은 엽산 의 효과는 GG형을 가진 소아에서만 영향력이 나타나므로 GA + AA형을 가진 소아가 고콜레스테롤 혹은 고나트륨 식이를 할 경우, 비만의 위험도가 증가하는 것으로 보여진 다.
본 연구에서 AA 유전자형 대상자가 적어서 GA와 합쳐 서 분석함으로써 wild, hetero 및 mutant types 간 비교가 불가능하였으며 비만위험도 검증 시 OR값들이 지나치게 큰 CI값을 가지고 있어서 유의성에 변수로 작용할 수 있다 는 제한점이 있다. 또한 소금민감성 유전자와 관련된 사전 연구가 미비하고 코호트연구가 아닌 단면연구로 진행되
Fig. 3. Odd ratio of the risk of obesity by categories of dietary factors according to SLC12A3 genotypes, GG vs GA + AA. Categories of dietary intakes in each tertile are < 288.48, 288.48 ~ 387.55, ≥ 387.56 mg/day for cholesterol, and < 206.54, 206.54 ~ 266.11, ≥ 266.12 ug/
day for folate, and < 3,326.73, 3,326.73 ~ 3955, ≥ 3,955.01 mg/day for sodium.
어 유전자와 환경인자 사이의 상관성 및 인과성 규명이 어 려웠고 기전규명은 더더욱 어려웠다. 따라서 향후 남녀 대 상자 집단을 추가하여 코호트 등 추적연구를 하는 것이 필 요하다고 보아진다.
요 약
소아기의 과체중 혹은 비만은 성인기의 만성질환의 onset 위험을 증가시키는 대사이상을 야기하므로 관련된 obesogenic 환경 (나트륨 섭취 등)을 제어할 필요가 있다. 본 연구에서는 소아기의 과도한 소금섭취가 신장의 재흡수 기능을 조절하는 SLC12A3기능장애로 이어져 고혈압 및 비만을 야기하는지를 확인하고자 하였다. 서울 구로구에 소재한 8~9세 초등학생 752명 (남학생: 379명 여학생: 373 명)을 대상으로 BMI가 85 percentiles이상을 비만군으로, 이하를 정상군으로 분류하였다. SLC12A3 rs11643718 유 전자형은 GG (wild)와 GA + AA로 분류하여 신체계측, 혈 액검사, 식이조사 등을 비교분석하였다
대상자의 남아가 여아보다, 비만군이 정상군보다 신체 지수, 혈액지수, 식사섭취량이 여아보다 높았다. 남녀 모두 비만군에서 높은 TG와 낮은 HDLc를 보여주었지만 비만 한 남아는 혈압에, 비만한 여아는 인슐린저항성에 더 민감 한 반응을 보였다. 비록 남녀차이는 있지만 비만군 및 정상 군 모두에서 SLC12A3의 GA + AA형이 GG형보다 혈압과 체중이 높았다. GG 유전자형을 가지고 있는 소아는 혈중 LDLc, FBS, insulin등이 높거나 식이 콜레스테롤섭취가 증가할수록 비만이 될 위험도가 증가하였고 엽산의 섭취 가 증가할수록 비만위험도는 감소하였다. 반면, GA + AA 유전자형을 가지고 있는 소아는 고나트륨 (> 4,000 mg/
day)섭취시 비만위험도 (odd ratio)가 15.57배 증가하였고 남아 (22.84배)에서 더욱 위험도가 높았다. HDLc의 경우는 유전자형에 관계없이 증가할수록 비만위험도가 감소하였 다. 결론적으로 SLC12A3 (rs11643718) 유전자의 A allele 를 가진 형이 나트륨에 특이적으로 반응하여 과체중위험 을 증가시키는 것으로 생각된다.
References
1. Ministry of Health and Welfare, Korea Centers for Disease Control and Prevention. Korea Health Statistics 2012: Korea National Health and Nutrition Examination Survey (KNHANES V-3).
Cheongwon: Korea Centers for Disease Control and Prevention;
2013.
2. Oh K, Jang MJ, Lee NY, Moon JS, Lee CG, Yoo MH, Kim YT.
Prevalence and trends in obesity among Korean children and ado-
lescents in 1997 and 2005. Korean J Pediatr 2008; 51(9): 950-955.
3. Korean Educational Development Institute. Statistics of school health examination survey: 2011. Seoul: Korean Educational Development Institute; 2011.
4. Kim JH, Kim EK. The relationship among insulin resistance, blood profiles and nutrient intake in overweight or obese children and adolescents. Korean J Community Nutr 2012; 17(5): 530-542.
5. Styne DM. Childhood and adolescent obesity. Prevalence and sig- nificance. Pediatr Clin North Am 2001; 48(4): 823-854.
6. Lee HH, Choi SK, Seo JS. Obesity index and related factors among elementary school students visiting pediatric department of gen- eral hospital. J Korean Diet Assoc 2012; 18(2): 186-199.
7. Lee SK, Kim MK. Relationship of sodium intake with obesity among Korean children and adolescents: Korea National Health and Nutrition Examination Survey. Br J Nutr 2016; 115(5): 834- 841.
8. Yoon YS, Oh SW. Sodium density and obesity; the Korea National Health and Nutrition Examination Survey 2007-2010. Eur J Clin Nutr 2013; 67(2): 141-146.
9. Lee M, Kim MK, Kim SM, Park H, Park CG, Park HK. Gender- based differences on the association between salt-sensitive genes and obesity in Korean children aged between 8 and 9 years. PLoS One 2015; 10(3): e0120111.
10. Lee J, Lee H, Kim K, Park JH, Kim S, Oh J. A higher salt intake leads to a lower rate of adequate blood pressure control. J Korean Med Sci 2014; 29 Suppl 2: S103-S108.
11. Intersalt: an international study of electrolyte excretion and blood pressure. Results for 24 hour urinary sodium and potassium excre- tion. Intersalt Cooperative Research Group. BMJ 1988; 297(6644):
319-328.
12. Libuda L, Kersting M, Alexy U. Consumption of dietary salt mea- sured by urinary sodium excretion and its association with body weight status in healthy children and adolescents. Public Health Nutr 2012; 15(3): 433-441.
13. Hoffmann IS, Cubeddu LX. Salt and the metabolic syndrome. Nutr Metab Cardiovasc Dis 2009; 19(2): 123-128.
14. World Health Organization. Guideline. Sodium intake for adults and children. Geneva: World Health Organization; 2012.
15. Lewington S, Clarke R, Qizilbash N, Peto R, Collins R; Prospec- tive Studies Collaboration. Age-specific relevance of usual blood pressure to vascular mortality: a meta-analysis of individual data for one million adults in 61 prospective studies. Lancet 2002;
360(9349): 1903-1913.
16. He FJ, MacGregor GA. Salt reduction lowers cardiovascular risk:
meta-analysis of outcome trials. Lancet 2011; 378(9789): 380-382.
17. Brater DC. Pharmacology of diuretics. Am J Med Sci 2000;
319(1): 38-50.
18. Fava C, Montagnana M, Rosberg L, Burri P, Almgren P, Jönsson A, Wanby P, Lippi G, Minuz P, Hulthèn LU, Aurell M, Melander O. Subjects heterozygous for genetic loss of function of the thia- zide-sensitive cotransporter have reduced blood pressure. Hum Mol Genet 2008; 17(3): 413-418.
19. Melander O, Orho-Melander M, Bengtsson K, Lindblad U, Râs- tam L, Groop L, Hulthén UL. Genetic variants of thiazide-sensitive NaCl-cotransporter in Gitelman’s syndrome and primary hyper- tension. Hypertension 2000; 36(3): 389-394.
20. Knoers NV, Levtchenko EN. Gitelman syndrome. Orphanet J Rare
Dis 2008; 3(1): 22.
21. Hoorn EJ, Ellison DH. WNK kinases and the kidney. Exp Cell Res 2012; 318(9): 1020-1026.
22. Mercier-Zuber A, O'Shaughnessy KM. Role of SPAK and OSR1 signalling in the regulation of NaCl cotransporters. Curr Opin Nephrol Hypertens 2011; 20(5): 534-540.
23. McCormick JA, Mutig K, Nelson JH, Saritas T, Hoorn EJ, Yang CL, Rogers S, Curry J, Delpire E, Bachmann S, Ellison DH. A SPAK isoform switch modulates renal salt transport and blood pressure. Cell Metab 2011; 14(3): 352-364.
24. Castañeda-Bueno M, Gamba G. Mechanisms of sodium-chloride cotransporter modulation by angiotensin II. Curr Opin Nephrol Hypertens 2012; 21(5): 516-522.
25. Arroyo JP, Lagnaz D, Ronzaud C, Vázquez N, Ko BS, Moddes L, Ruffieux-Daidié D, Hausel P, Koesters R, Yang B, Stokes JB, Hoover RS, Gamba G, Staub O. Nedd4-2 modulates renal Na+-Cl- cotransporter via the aldosterone-SGK1-Nedd4-2 pathway. J Am Soc Nephrol 2011; 22(9): 1707-1719.
26. Moon JS, Lee SY, Nam CM, Choi JM, Choe BK, Seo JW, Oh K, Jang MJ, Hwang SS, Yoo MH, Kim YT, Lee CG. 2007 Korean National Growth Charts: review of developmental process and an outlook. Korean J Pediatr 2008; 51(1): 1-25.
27. Friedewald WT, Levy RI, Fredrickson DS. Estimation of the con- centration of low-density lipoprotein cholesterol in plasma, with- out use of the preparative ultracentrifuge. Clin Chem 1972; 18(6):
499-502.
28. Matthews DR, Hosker JP, Rudenski AS, Naylor BA, Treacher DF, Turner RC. Homeostasis model assessment: insulin resistance and beta-cell function from fasting plasma glucose and insulin concen- trations in man. Diabetologia 1985; 28(7): 412-419.
29. Willett WC, Howe GR, Kushi LH. Adjustment for total energy intake in epidemiologic studies. Am J Clin Nutr 1997; 65(4 Suppl):
1220S-1228S.
30. Magnussen CG, Thomson R, Cleland VJ, Ukoumunne OC, Dwyer T, Venn A. Factors affecting the stability of blood lipid and lipopro- tein levels from youth to adulthood: evidence from the Childhood Determinants of Adult Health Study. Arch Pediatr Adolesc Med 2011; 165(1): 68-76.
31. Cesa CC, Sbruzzi G, Ribeiro RA, Barbiero SM, de Oliveira Petko- wicz R, Eibel B, Machado NB, Marques R, Tortato G, dos Santos TJ, Leiria C, Schaan BD, Pellanda LC. Physical activity and car- diovascular risk factors in children: meta-analysis of randomized clinical trials. Prev Med 2014; 69: 54-62.
32. Marcovecchio ML, Mohn A, Chiarelli F. Obesity and insulin resis- tance in children. J Pediatr Gastroenterol Nutr 2010; 51 Suppl 3:
S149-S150.
33. Bahrami E, Mirmoghtadaee P, Ardalan G, Zarkesh-Esfahani H, Tajaddini MH, Haghjooy-Javanmard S, Najafi H, Kelishadi R.
Insulin and leptin levels in overweight and normal-weight Iranian adolescents: the CASPIAN-III study. J Res Med Sci 2014; 19(5):
387-390.
34. Del Mar Bibiloni M, Maffeis C, Llompart I, Pons A, Tur JA.
Dietary factors associated with subclinical inflammation among girls. Eur J Clin Nutr 2013; 67(12): 1264-1270.
35. García OP, Ronquillo D, Caamaño Mdel C, Camacho M, Long KZ, Rosado JL. Zinc, vitamin A, and vitamin C status are associ- ated with leptin concentrations and obesity in Mexican women:
results from a cross-sectional study. Nutr Metab (Lond) 2012; 9(1):
59.
36. Wang YL, Qi Y, Bai JN, Qi ZM, Li JR, Zhao HY, Wang YF, Lu CZ, Xiao Y, Jia N, Wang B, Niu WQ. Tag polymorphisms of solute car- rier family 12 member 3 gene modify the risk of hypertension in northeastern Han Chinese. J Hum Hypertens 2014; 28(8): 504- 509.
37. Gopinath B, Flood VM, Burlutsky G, Louie JC, Baur LA, Mitchell P. Dairy food consumption, blood pressure and retinal microcircu- lation in adolescents. Nutr Metab Cardiovasc Dis 2014; 24(11):
1221-1227.
38. Yuan WL, Kakinami L, Gray-Donald K, Czernichow S, Lambert M, Paradis G. Influence of dairy product consumption on children's blood pressure: results from the QUALITY cohort. J Acad Nutr Diet 2013; 113(7): 936-941.
39. Yang SJ, Kim S, Park H, Kim SM, Choi KM, Lim Y, Lee M. Sex- dependent association between angiotensin-converting enzyme insertion/deletion polymorphism and obesity in relation to sodium intake in children. Nutrition 2013; 29(3): 525-530.
40. Enquobahrie DA, Feldman HA, Hoelscher DH, Steffen LM, Web- ber LS, Zive MM, Rimm EB, Stampfer MJ, Osganian SK. Serum homocysteine and folate concentrations among a US cohort of adolescents before and after folic acid fortification. Public Health Nutr 2012; 15(10): 1818-1826.
41. Hoey L, McNulty H, Askin N, Dunne A, Ward M, Pentieva K, Strain J, Molloy AM, Flynn CA, Scott JM. Effect of a voluntary food fortification policy on folate, related B vitamin status, and homocysteine in healthy adults. Am J Clin Nutr 2007; 86(5): 1405- 1413.
42. Gallistl S, Sudi K, Mangge H, Erwa W, Borkenstein M. Insulin is an independent correlate of plasma homocysteine levels in obese children and adolescents. Diabetes Care 2000; 23(9): 1348-1352.
43. Ullegaddi R, Powers HJ, Gariballa SE. B-group vitamin supple- mentation mitigates oxidative damage after acute ischaemic stroke. Clin Sci (Lond) 2004; 107(5): 477-484.
44. Folsom AR, Desvarieux M, Nieto FJ, Boland LL, Ballantyne CM, Chambless LE. B vitamin status and inflammatory markers. Ath- erosclerosis 2003; 169(1): 169-174.
45. Voutilainen S, Virtanen JK, Rissanen TH, Alfthan G, Laukkanen J, Nyyssönen K, Mursu J, Valkonen VP, Tuomainen TP, Kaplan GA, Salonen JT. Serum folate and homocysteine and the incidence of acute coronary events: the Kuopio Ischaemic Heart Disease Risk Factor Study. Am J Clin Nutr 2004; 80(2): 317-323.