This is an Open Access article distributed under the terms of the Creative Commons At- tribution Non-Commercial License (http://creativecommons.org/licenses/by-nc/3.0/) which permits unrestricted non-commercial use, distribution, and reproduction in any medium, provided the original work is properly cited.
Bone Mineral Density in Prediabetic Men
Ju Hee Lee1, Yun Hyeong Lee1, Kyoung Hye Jung1, Min Kyeong Kim1, Hye Won Jang1, Tae Kyun Kim1, Hyun Jin Kim1, Young Suk Jo1, Minho Shong1, Tae Yong Lee2, Bon Jeong Ku1
Departments of 1Internal Medicine, 2Preventive Medicine, Chungnam National University School of Medicine, Daejeon, Korea
Background: There are many studies regarding the effects of insulin on bone metabolism and changes in bone mineral density (BMD) in the setting of diabetes. The effect of prediabetes on BMD is not known.
Methods: A total of 802 men participated in the Korea Rural Genomic Cohort Study (in Geumsan County). According to the results of an oral glucose tolerance test, subjects were classified into normal, prediabetic, and diabetic categories. One hundred twenty-four subjects diagnosed with type 2 diabetes were excluded, leaving 678 subjects for the study inclusion. BMD was esti- mated with a quantitative ultrasonometer.
Results: The average BMD T scores of normal and prediabetic subjects were -1.34 ± 1.42 and -1.33 ± 1.30, respectively; there was no significant difference in the BMD T scores between these groups. The BMD T score was inversely associated with age and positively correlated with body weight, body mass index, total cholesterol, low density lipoprotein cholesterol, and HbA1c. On multiple linear regression analysis, low density lipoprotein cholesterol was the only statistically significant variable for prediabetes (β = 0.007, P = 0.005). On the stepwise regression analysis, age (β = -0.026, P < 0.001), the body mass index (β = 0.079, P < 0.001), and low density lipoprotein cholesterol (β = 0.004, P = 0.016) were significant variables for prediabetes.
Conclusions: There was no significant difference in the BMD T score between the normal and prediabetic subjects. Further stud- ies are needed regarding the association of fracture risk and changes in BMD with the development of overt diabetes.
Keywords: Bone density; Insulin; Prediabetic state
Corresponding author: Bon Jeong Ku
Department of Internal Medicine, Chungnam National University School of Medicine, 33 Munhwa-ro, Jung-gu, Daejeon 301-721, Korea
E-mail: [email protected]
INTRODUCTION
The incidence of diabetes in Korea is on the rise. According to the Korean National Health and Nutrition Examination Survey (KNHNES) in 2007, the rate of diabetes reached 9.7% in adults older than 30 years; impaired fasting glucose reached 16.1%.
Additionally, osteoporosis, and consequent fractures, are on the rise. In the KNHNES in 2008, the incidence of osteoporo- sis in postmenopausal women and males older than 50 years has been reported to be high as 19.3% [1]. Osteoporosis refers to the reduction of bone strength and causes an increased risk of fracture. The World Health Organization (WHO) defines osteoporosis as a bone mineral density (BMD) that falls 2.5 standard deviations below the mean for young healthy adults
of the same gender, also referred to as a T-score of -2.5 [2].
Several studies have reported on the effects of insulin and diabetes on bone metabolism. A meta-analysis of the studies found that BMD was decreased in type 1 diabetes, but that type 2 diabetes either did not significantly affect the BMD or was associated with a slightly increased BMD [3]. The mechanisms for these findings have not yet been elucidated. It is thought that insulin mediates anabolic effects on bone metabolism and that insulin may exert synergistic effects together with other anabolic agents, such as insulin-like growth factor (IGF)-I and parathyroid hormone [4]. Therefore, bone metabolism may be altered in patients with impaired fasting glucose (IFG) or im- paired glucose tolerance (IGT). However, studies of bone me- tabolism in prediabetic patients have not yet been conducted.
pISSN 1976-9180 · eISSN 2093-2650
Therefore, the current study examined the changes in BMD in patients with IFG or IGT.
METHODS
Participants
Among the 1,993 individuals who participated in the Korean Rural Genome Cohort Study from January 2005 to December 2006, 802 males were selected as the study subjects. Among these, we excluded 124 subjects who were diagnosed as diabetic.
The Korean Rural Genome Cohort Study was conducted on individuals between the ages of 40 to 70 years and who resided in Wonju-si, Pyeongchang-gun, and Gangneung-si in Gang- won-do, Geumsan-gun in Chungcheong-do, and Naju-si in Jeolla-do. The subjects of this study were recruited randomly from Geumsan-gun.
Based on the definition of the American Diabetes Associa- tion in 2004, subjects with either an IFG or an IGT were classi- fied as prediabetic. Cases with fasting blood glucose between 100 mg/dL and 126 mg/dL were diagnosed as IFG. Cases with blood glucose was between 140 mg/dL and 200 mg/dL at 2 hours after a 75 g oral glucose loading were diagnosed as IGT [5].
Methods
Physical measurements
Height and weight were measured by a single individual. The waist and hip circumference were measured with the subject standing straight. For obtaining the waist circumference, ac- cording to the method recommended by the WHO, the patients stood with legs 25–30 cm apart and, while distributing weight evenly, the middle area between the lowest rib and the pelvic iliac crest was measured during the end-expiration phase. The body mass index (BMI) was calculated by the formula: weight (kg)/height (m2).
Body fat measurement
The fat mass (kg), percent body fat (%), visceral fat (kg), and percent visceral fat (%) were measured by a body composition analyzer (InBody 4.0; Biospace Co., Seoul, Korea).
Evaluation of glucose metabolism
For all subjects, the glycosylated hemoglobin was measured and the blood glucose, as well as insulin, were measured after fasting (minimum 12 hours) and 120 minutes after the oral administration of 75 g of glucose. Insulin was measured by a
radioimmune assay (Biosource, Fleurus, Belgium). The intra- assay coefficient of variation was 2.41% and the inter-assay co- efficient of variation was 2.93%.
Blood chemistries
In all subject groups, after fasting for more than 12 hours, the blood urea nitrogen, serum creatine, serum cholesterol, triglyc- eride, low density lipoprotein cholesterol (LDL-C), high den- sity lipoprotein cholesterol, aspartate aminotransferase, and alanine transaminase were measured.
BMD
In all subjects, the BMD was measured in the calcaneus using an ultrasonographic bone densitometer (ACHILLES Express;
GE, Madison, WI, USA). Additionally, the T-score was divided into three groups according to the classification of the WHO as normal when greater than -1.0, osteopenia when it was between -2.5 and -1.0, and osteoporosis when it was less than -2.5.
Statistical analysis
All statistical procedures were carried out with SPSS for win- dows version 17.0 (SPSS Inc., Chicago, IL, USA). All values are presented as the mean ± standard deviation. Student’s t-test and the chi-square test were performed to compare the clinical characteristic of the two groups classified as the normal and prediabetic group. One-way ANOVA was applied for compar- ative analysis of the BMD. The Pearson’s correlation method was applied for analysis of the correlation of BMD with the various clinical characteristics. To determine the factors hav- ing the greatest effects on BMD, multiple regression analysis was performed and confirmed by correlation analysis; P values less than 0.05 were considered statistically significant.
RESULTS
Comparison of clinical characteristics and BMD
Among the 678 study patients, 406 were classified as normal and 272 were classified as prediabetic. Compared with the normal group, the prediabetic group had significantly higher values for fasting blood glucose concentration and blood glu- cose concentration 2 hours after a 75 g oral glucose load, serum insulin concentration 2 hours after a 75 g oral glucose load, and glycosylated hemoglobin (100.78 ± 11.03 mg/dL vs. 89.49
± 6.47 mg/dL, 147.22 ± 31.17 mg/dL vs. 102.12 ± 23.74 mg/dL, 32.71 ± 27.28 mU/L vs. 23.91 ± 22.28 mU/L, and 5.57 ± 0.45
mg/dL vs. 5.41 ± 0.36 mg/dL, respectively, P < 0.001). However, the fasting serum insulin concentration was not significantly different between these groups (7.63 ± 3.60 mU/L vs. 7.31 ±
4.05 mU/L, respectively, P = 0.295). There was no significant difference in age, BMI, percent body fat, and waist circumfer- ence between the two groups. The mean BMD T-score of the Table 1. Characteristics according to normal and prediabetic status
Group
P value Normal (n = 406) IFG or IGT (n = 272)
Age, yr 56.55 ± 7.36 57.49 ± 7.18 0.105a
Hypertension
Negative 331 (81.5) 206 (75.7) 0.069b
Positive 75 (18.5) 66 (24.3)
Dyslipidemia
Negative 387 (95.3) 254 (93.4) 0.276b
Positive 19 (4.7) 18 (6.6)
T score group
≥ -1.0 160 (40.2) 106 (38.5) 0.688b
-1.0 > ≥ -2.5 168 (42.2) 125 (45.5)
< -2.5 70 (17.6) 44 (16.0)
BMD T score -1.34 ± 1.42 -1.33 ± 1.30 0.924a
HbA1C, % 5.41 ± 0.36 5.57 ± 0.45 < 0.001a
Fasting insulin, mU/L 7.31 ± 4.05 7.63 ± 3.60 0.295a
Fasting glucose, mg/dL 89.49 ± 6.47 100.78 ± 11.03 < 0.001a
2 hr-insulin, mU/L 23.91 ± 22.28 32.71 ± 27.28 < 0.001a
2 hr- glucose, mg/dL 102.12 ± 23.74 147.22 ± 31.17 < 0.001a
Height, cm 166.26 ± 6.05 165.49 ± 5.97 0.102a
Weight, kg 64.72 ± 9.75 65.10 ± 9.51 0.619a
Body mass index, kg/m2 23.38 ± 3.02 23.72 ± 2.91 0.140a
Waist circumference, cm 87.02 ± 8.84 87.95 ± 8.45 0.171a
Percent body fat, % 21.5 ± 5.13 22.25 ± 4.79 0.715a
Visecral fat, kg 2.15 ± 1.30 2.18 ± 0.87 0.740a
Percent visceral fat, % 11.44 ± 2.38 11.73 ± 2.06 0.089a
Total cholesterol, mg/dL 204.57 ± 37.24 203.82 ± 38.10 0.797a
Triglyceride, mg/dL 169.93 ± 117.99 186.12 ± 116.53 0.079a
HDL-C, mg/dL 44.97 ± 11.54 44.22 ± 10.49 0.386a
LDL-C, mg/dL 118.28 ± 31.61 116.97 ± 33.34 0.606a
BUN, mg/dL 16.58 ± 4.53 16.50 ± 4.28 0.835a
Cr, mg/dL 1.08 ± 0.12 1.08 ± 0.12 0.811a
AST, IU/L 30.32 ± 17.27 34.06 ± 30.40 0.067a
ALT, IU/L 27.27 ± 14.89 29.36 ± 17.46 0.096a
Data are expressed as mean ± standard deviation or number (%). 2 hr-insulin and 2 hr-glucose represent the insulin and glucose concentra- tions 120 min after an oral glucose tolerance test.
IFG, impaired fasting glucose; IGT, impaired glucose tolerance; BMD, bone mineral density; HDL-C, high density lipoprotein cholesterol;
LDL-C, low density lipoprotein cholesterol; ALT, alanine transaminase; AST, aspartate aminotransferase.
aP values were calculated using an unpaired T-test, bP values were calculated by Pearson’s chi-square test.
normal group was -1.34 ± 1.42 while the BMD T-score of the prediabetic group was -1.33 ± 1.30; this difference was not sig- nificant (P = 0.924). On chi-square testing following classifica- tion of the BMD T-score according to WHO standards, no significant difference was found between the two groups (P = 0.688, Table 1).
Among the 272 prediabetic patients, excluding 9 patients who did not undergo the 75 g oral glucose tolerance test, a to-
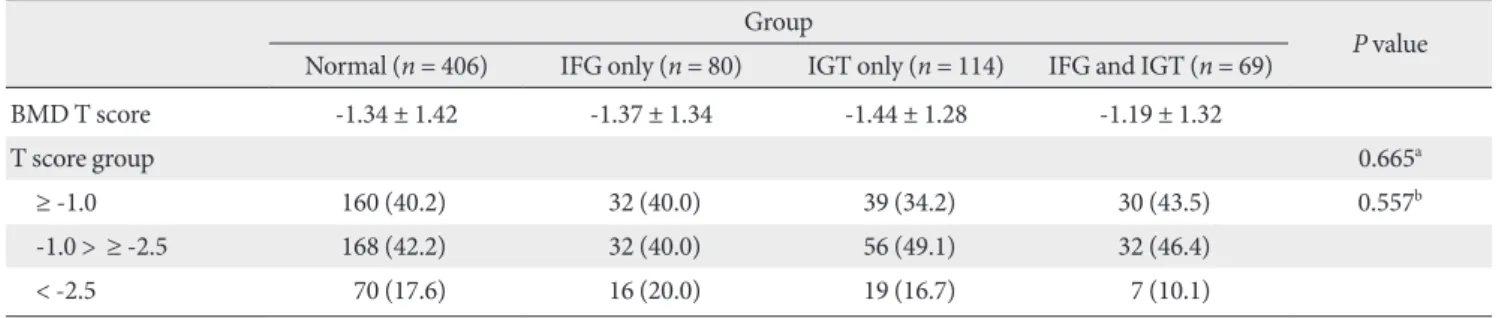
tal of 263 patients were divided to the three groups: cases with IFG only, cases with IGT only, and cases with both IFG and IGT. The BMD T-score of each of these groups was compared with the normal group; no significant difference was observed (Table 2).
Relationship of blood glucose and insulin with BMD No significant difference in the BMD between the normal Table 2. Subgroup analysis of BMD T-scores in prediabetics
Group
P value Normal (n = 406) IFG only (n = 80) IGT only (n = 114) IFG and IGT (n = 69)
BMD T score -1.34 ± 1.42 -1.37 ± 1.34 -1.44 ± 1.28 -1.19 ± 1.32
T score group 0.665a
≥ -1.0 160 (40.2) 32 (40.0) 39 (34.2) 30 (43.5) 0.557b
-1.0 > ≥ -2.5 168 (42.2) 32 (40.0) 56 (49.1) 32 (46.4)
< -2.5 70 (17.6) 16 (20.0) 19 (16.7) 7 (10.1)
Data are expressed as mean ± standard deviation or number (%).
BMD, bone mineral density; IFG, impaired fasting glucose; IGT, impaired glucose tolerance.
aP values were calculated by one-way ANOVA, bP values were calculated by Pearson’s chi-square test.
Table 4. BMD T-scores according to the fasting insulin levels in normal, prediabetic, and diabetic subjects Fasting insulin level
P value
< 25%
(≤ 5.2 mU/L ) 25-50%
(5.2 < ≤ 6.6 mU/L) 50-75%
(6.6 < ≤ 8.9 mU/L) > 75%
(> 8.9 mU/L )
BMD T score -1.53 ± 1.28 -1.48 ± 1.47 -1.16 ± 1.37 -1.16 ± 1.31 0.004a
T score group < 0.001b
≥ -1.0 63 (31.7) 68 (34.2) 88 (43.9) 95 (47.5)
-1.0 < ≤ -2.5 97 (48.7) 92 (46.2) 86 (42.8) 77 (38.5)
< -2.5 39 (19.6) 39 (19.6) 27 (13.4) 28 (14.0)
Data are expressed as mean ± standard deviation or number (%). 2 hr-insulin represents the insulin concentrations at 120 min after an oral glu- cose tolerance test.
BMD, bone mineral density.
aP values were calculated by one-way ANOVA, bP values were calculated by linear association analysis.
Table 3. BMD T-scores in the normal, prediabetic, and diabetic subjects Group
P value Normal (n = 406) Prediabetes (n = 272) DM (n = 123)
BMD T score -1.31 ± 1.42 -1.36 ± 1.30 -1.30 ± 1.34 0.870a
T score group
≥ -1.0 160 (40.2) 106 (39.0) 48 (39.0) 0.558b
-1.0 < ≤ -2.5 168 (42.2) 126 (46.3) 57 (46.3)
< -2.5 70 (17.6) 40 (14.7) 18 (14.6)
Data are expressed as mean ± standard deviation or number (%).
BMD, bone mineral density; DM, diabetes mellitus.
aP values were calculated by one-way ANOVA, bP values were calculated by linear association analysis.
group, the prediabetic group, and the diabetic group was ob- served (Table 3). All subjects were divided into quartiles based on the fasting insulin and insulin levels 2 hours after a 75 g oral glucose load, and the BMD of each group was compared. As the concentration of fasting insulin increased, the mean BMD T-score also increased (P = 0.004). Additionally, on chi-square
testing following classification of the BMD according to WHO standards, the subjects with high concentrations of fasting in- sulin belonged to the groups with higher BMD T-scores (P <
0.001, Table 4). When comparing these groups based on the insulin levels 2 hours after oral administration of 75 g glucose, no significant difference in the mean BMD T-score was found.
Table 5. BMD T-scores according to the 2 hr-insulin levels in normal, prediabetic, and diabetic subjects 2 hr-insulin level
P value
< 25%
(≤ 12.1 mU/L) 25-50%
(12.1 < ≤ 20.5 mU/L ) 50-75%
(20.5 < ≤ 35.4 mU/L ) > 75%
(> 35.4 mU/L )
BMD T score -1.39 ± 1.34 -1.46 ± 1.32 -1.33 ± 1.57 -1.17 ± 1.19 0.199a
T score group 0.017b
≥ -1.0 65 (35.1) 66 (35.1) 78 (41.1) 82 (43.6)
-1.0 < ≤ -2.5 2.5 85 (45.9) 89 (47.3) 74 (38.9) 87 (46.3)
< -2.5 35 (18.9) 33 (17.6) 38 (20.0) 19 (10.1)
Data are expressed as mean ± standard deviation or number (%). 2 hr-insulin represents the insulin concentrations 120 min after an oral glu- cose tolerance test.
BMD, bone mineral density.
aP values were calculated by one-way ANOVA, bP values were calculated by linear association analysis.
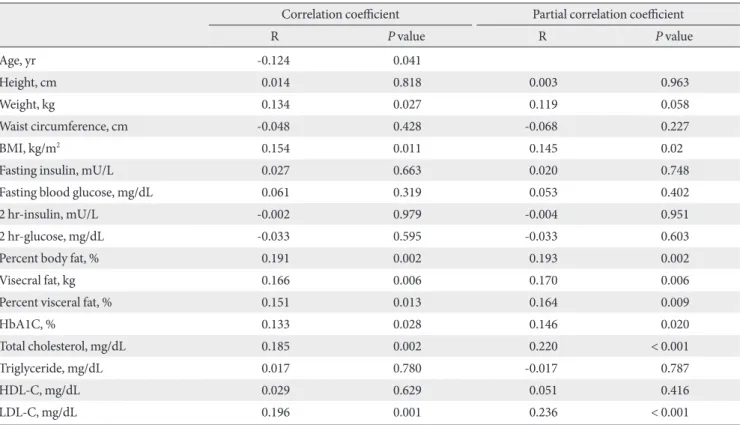
Table 6. Univariate analysis of associations between the BMD T-score and clinical and laboratory parameters in the prediabetic subjects
Correlation coefficient Partial correlation coefficient
R P value R P value
Age, yr -0.124 0.041
Height, cm 0.014 0.818 0.003 0.963
Weight, kg 0.134 0.027 0.119 0.058
Waist circumference, cm -0.048 0.428 -0.068 0.227
BMI, kg/m2 0.154 0.011 0.145 0.02
Fasting insulin, mU/L 0.027 0.663 0.020 0.748
Fasting blood glucose, mg/dL 0.061 0.319 0.053 0.402
2 hr-insulin, mU/L -0.002 0.979 -0.004 0.951
2 hr-glucose, mg/dL -0.033 0.595 -0.033 0.603
Percent body fat, % 0.191 0.002 0.193 0.002
Visecral fat, kg 0.166 0.006 0.170 0.006
Percent visceral fat, % 0.151 0.013 0.164 0.009
HbA1C, % 0.133 0.028 0.146 0.020
Total cholesterol, mg/dL 0.185 0.002 0.220 < 0.001
Triglyceride, mg/dL 0.017 0.780 -0.017 0.787
HDL-C, mg/dL 0.029 0.629 0.051 0.416
LDL-C, mg/dL 0.196 0.001 0.236 < 0.001
Data are given as Pearson’s correlation (R) coefficients with adjustment for age (r). 2 hr-insulin and 2 hr-glucose represent the insulin and glu- cose concentrations 120 min after an oral glucose tolerance test.
BMD, bone mineral density; BMI, body mass index; HDL-C, high density lipoprotein cholesterol; LDL-C, low density lipoprotein cholesterol.
P < 0.01, P < 0.05.
Nonetheless, on chi-square testing performed after classifying the BMD T-score according to WHO standards, patients with higher insulin concentrations belonged to the group with high- er T-scores (P = 0.017, Table 5).
Correlation of BMD with clinical characteristics in the prediabetic group
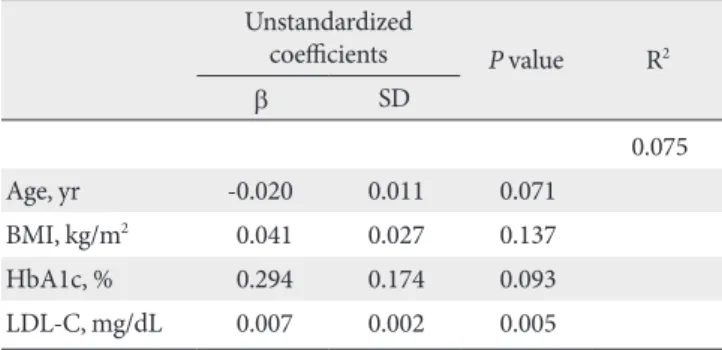
In the prediabetic group, the BMD demonstrated a statistically significant inverse correlation with age (r = -0.124, P = 0.041) and positive correlations with weight (r = 0.134, P = 0.027), BMI (r = 0.154, P = 0.011), percent body fat (r = 0.191, P = 0.002), percent visceral fat (r = 0.151, P = 0.013), total cholesterol (r = 0.185, P = 0.002), and the LDL-C (r = 0.196, P = 0.001). Howev- er, the correlation coefficients for these associations were be- tween 0.1 and 0.3, and thus, the correlations were not very strong. No relationship was observed between the BMD and fasting insulin levels, fasting blood glucose, and the insulin and blood glucose levels 2 hours after oral administration of 75 g of glucose. The BMD also demonstrated a positive corre- lation with glycosylated hemoglobin; again, the correlation was not strong (r = 0.133, P = 0.028). Adjustment for age did not alter the results (Table 6). As age, BMI, glycosylated hemo- globin, and LDL-C all demonstrated a correlation with BMD in the prediabetic group, a multiple regression analysis with these variables was performed. Only the LDL-C was found to be a significant variable (β = 0.007, P = 0.005) (Table 7). How- ever, on a step-wise multiple regression model, age (β = -0.026, P < 0.001), BMI (β = 0.079, P < 0.001), and LDL-C (β = 0.004, P = 0.016) were found to be significant variables (Table 8).
DISCUSSION
It is well known that insulin plays a critical role in glucose me- tabolism. Upon recognition that it also exerts anabolic effects on bone metabolism, diabetes has become a subject of interest in bone metabolism studies. The direct effect of insulin on bone metabolism has not yet been determined, but a high level of expression of insulin receptors on osteoblasts has been report- ed [6]. It was observed that the binding of insulin to insulin receptors accelerated cell proliferation, collagen synthesis, production of alkaline phosphatase, and glucose intake [7-10].
In addition to the direct effects of insulin on osteoblasts, insu- lin has been found to render osteoblasts more sensitive to IGF by the suppression of IGFBP-1; this induces a synergistic effect with the actions of parathyroid hormone and induces indirect synergistic effects with other substances that mediate anabolic effects on bone metabolism [11,12].
The anabolic effects of insulin on bone metabolism can be confirmed in animals with experimentally induced diabetes.
Maor et al. [13] observed that IGF-1, IGF-1 receptor, and in- sulin receptor were reduced in the skeletal growth centers of diabetic rats. Insulin receptor transduces intracellular signals through insulin receptor substrate (IRS), and IRS-1 and IRS-2 have been revealed to play an important role in bone turnover and bone formation, respectively [14]. With the observations that the insulin receptor was also detected in osteoclasts and that insulin suppresses osteoclast activity, the effects of insulin on reducing bone resorption could be predicted and studied [15]. Additionally, non-osmotic hypercalciuria was observed in diabetic rats, and has been reported to induce the effects of calcium deficiency [16]. It has also been reported that when hy- Table 7. Variables identified by multivariate linear regression
analysis as being predictive of the BMD T-score in prediabetic subjects
Unstandardized
coefficients P value R2
β SD
0.075
Age, yr -0.020 0.011 0.071
BMI, kg/m2 0.041 0.027 0.137
HbA1c, % 0.294 0.174 0.093
LDL-C, mg/dL 0.007 0.002 0.005
Data are expressed as standardized coefficients (β) using multivariate regression analysis.
BMD, bone mineral density; SD, standard deviation; BMI, body mass index; LDL-C, low density lipoprotein cholesterol.
P < 0.01.
Table 8. Variables identified by stepwise regression analysis as being predictive of the BMD T-score in prediabetic subjects
Unstandardized
coefficients P value R2
β SD
0.068
Age, yr -0.026 0.007 < 0.001
BMI, kg/m2 0.079 0.018 < 0.001
LDL-C, mg/dL 0.004 0.002 0.016
Data are expressed as standardized coefficients (β) using multivariate regression analysis.
BMD, bone mineral density; SD, standard deviation; BMI, body mass index; LDL-C, low density lipoprotein cholesterol.
P < 0.01, P < 0.05.
perglycemia is persistent, advanced glycation end-products ac- cumulate and result in the reduction of bone formation by os- teoblasts and an increase in bone resorption by osteoclasts [17].
Several studies focusing on changes in BMD and risks for bone fracture have been conducted in diabetic patients. Prior studies have found that BMD was decreased in type 1 diabetes though it was unchanged or increased in type 2 diabetes. In type 2 diabetes, adjustment for BMI did not alter these results.
Insulin secretion is decreased in type 1 diabetes, but increased in type 2 diabetes. Therefore, the anabolic effects of insulin could be confirmed. However, in both type 1 and type 2 diabetes, the relative risk for hip fracture was increased by 6.3-6.9 times and 1.4-1.7 times, respectively. In type 2 diabetes, the BMD was increased as did the risk for fracture. A possible explanation for this may be an increased number of falls due to deterioration of visual acuity or proprioception caused by diabetes [18].
We conducted comparative studies on the changes in BMD in the normal and prediabetic groups using an ultrasono- graphic bone densitometer. We noted no significant difference in BMD between these groups. The BMD demonstrated sig- nificant correlations with age, BMI, percent of body fat, per- cent visceral fat, and cholesterol. The subjects were divided into quartiles according to the concentration of insulin in the normal, prediabetic, and diabetic groups. The BMD T-scores were divided to three groups according to the WHO stan- dards. Chi-square analysis was performed between the insulin groups and the BMD T-score groups. Interestingly, as the con- centration of insulin increased, more patients were assigned to the groups with higher BMD T-scores. Therefore, it was con- firmed that insulin exerts anabolic effects on bone metabo- lism. However, there was no significant difference in BMD be- tween the prediabetic and normal group. There have been conflicting reports in the previous studies of type 2 diabetic; in some studies, the BMD was reduced while in others it was in- creased or unchanged [19]. This is thought to be secondary to numerous factors, other than insulin, affecting BMD [3]. Addi- tionally, in a study that examined the differences in BMD be- tween males and females with type 2 diabetes patients, the BMD was found to be increased in females, while the BMD of males was not significantly changed; this result is consistent with the current study which included only males [20].
In the Rotterdam study, the BMD and risk of fracture were examined in 792 male and female diabetic patients older than 55 years. They compared subjects with type 2 diabetes with the subjects without diabetes. Subset analyses were performed, di-
viding the subjects on the basis of the glucose tolerance test, into already treated diabetes, newly diagnosed diabetes, IGT, and normal glucose tolerance groups. Even after adjustment for age and gender, the femur neck BMD of the diabetic and IGT groups was significantly increased [21], yet in the IGT group, the change in the lumbar spine BMD was not statisti- cally significant. Similarly, the change in femur BMD was not significant after adjustment for BMI, impairment of the lower extremities, smoking, and the use of diuretics, in addition to adjustments for age and gender. That study included both males and females and researchers used a dual energy X-ray absorp- tiometry (DXA) for assessing the BMD. Strotmeyer et al. [22]
examined BMD and fracture risk in 2,797 males and females between 70 and 79 years of age using DXA. These investigators found that in both males and females, the BMD of the hip joint was statistically increased in the IFG group.
Korean studies on the correlation of diabetes with osteopo- rosis are rare. Kim et al. [23] examined the correlation of non- insulin dependent diabetes with osteoporosis in 63 postmeno- pausal women using DXA. These authors found that the lum- bar spine and femur BMD of the diabetic group was signifi- cantly higher than that of the normal group. Even after adjust- ment for BMI and postmenopausal status, the BMD differenc- es remained significant. Park et al. [24] measured the BMD of 30 male and 30 female diabetic patients suspected as having diabetic foot disease as well 30 male and 30 female normal in- dividuals using DXA. They found that the forefoot BMD of the diabetic group was significantly lower than that of the con- trol group. Yet, in this study, the foot BMD of the patients sus- pected as having diabetic foot disease was evaluated, and so the study may have limitations in assessing the association of diabetes with osteoporosis.
Although it is well known that age and weight are factors that mediate effects on BMD, there are no studies that have ana- lyzed the factors mediating effects on BMD in prediabetics. In the current study, correlation analysis performed in the predi- abetic group found that age, BMI, glycosylated hemoglobin, and LDL-C are factors that mediate effects on BMD. In a mul- tiple regression analysis, only the LDL-C levels were found to be a significantly correlated factor. In a step-wise multiple re- gression model, age and weight were found to be significantly associated factors with BMD. It is anticipated that if an in- creased number of subjects are included in future studies, age may also be found to be a significant factor.
Depending on the particular study, cholesterol has been re-
ported as having a positive, inverse, or no correlation with BMD [25-27]. It has recently been reported that 3-hydroxy-3-meth- ylglutaryl (HMG)-CoA reductase inhibitors increase BMD and aid in fracture healing; this has been demonstrated to be independent of lipid reductions and rather due to enhancing the expression of osteoblasts through bone morphogenetic protein-2. Additionally, HMG-CoA reductase inhibitor sup- presses osteoclast activity and may act as an anti-bone resorp- tion agent [28]. As cholesterol increases, it may be a marker for relatively good nutrition and so may be a factor that increases the BMI. Hence, the effects of cholesterol on BMD need to be considered. The positive correlation of cholesterol with BMD observed in our study warrants further investigation.
The current study has several limitations. This is a cross- sectional study. Ultrasonography was used to determine BMD instead of DXA. Additionally, bone turnover markers and an- drogen concentrations were not measured. Finally, the major risk factors for male osteoporosis (drinking, smoking, and physi- cal activity) were not analyzed.
Our study is important as it is the first Korean study that has examined the changes in BMD in prediabetic patients. Further studies are required to elucidate the associations between the risk level of actual fracture and changes in BMD during the progression from a prediabetic state to frank diabetes.
REFERENCES
1. Ministry for Health, Welfare and Family Affairs: The Third Ko- rea National Health and Nutrition Examination Survey (KNHANES III). Available from: http://knhanes.cdc.go.kr (updated 2009 Mar 19).
2. World Health Organization. Assessment of fracture risk and its application to screening for postmenopausal osteoporosis. Ge- neva: World Health Organization; 1994.
3. Vestergaard P. Discrepancies in bone mineral density and frac- ture risk in patients with type 1 and type 2 diabetes: a meta- analysis. Osteoporos Int 2007;18:427-44.
4. Thrailkill KM, Lumpkin CK Jr, Bunn RC, Kemp SF, Fowlkes JL.
Is insulin an anabolic agent in bone? Dissecting the diabetic bone for clues. Am J Physiol Endocrinol Metab 2005;289:
E735-45.
5. American Diabetes Association. Diagnosis and classification of diabetes mellitus. Diabetes Care 2004;27(Suppl 1):S5-10.
6. Thomas DM, Hards DK, Rogers SD, Ng KW, Best JD. Insulin receptor expression in bone. J Bone Miner Res 1996;11:1312-20.
7. Wergedal JE, Baylink DJ. Characterization of cells isolated and cultured from human bone. Proc Soc Exp Biol Med 1984;176:
60-9.
8. Canalis EM, Dietrich JW, Maina DM, Raisz LG. Hormonal control of bone collagen synthesis in vitro. Effects of insulin and glucagon. Endocrinology 1977;100:668-74.
9. Canalis E. Effect of hormones and growth factors on alkaline phosphatase activity and collagen synthesis in cultured rat cal- variae. Metabolism 1983;32:14-20.
10. Hahn TJ, Westbrook SL, Sullivan TL, Goodman WG, Halstead LR. Glucose transport in osteoblast-enriched bone explants:
characterization and insulin regulation. J Bone Miner Res 1988;
3:359-65.
11. Conover CA, Lee PD, Riggs BL, Powell DR. Insulin-like growth factor-binding protein-1 expression in cultured human bone cells: regulation by insulin and glucocorticoid. Endocrinology 1996;137:3295-301.
12. Suzuki K, Miyakoshi N, Tsuchida T, Kasukawa Y, Sato K, Itoi E.
Effects of combined treatment of insulin and human parathy- roid hormone (1-34) on cancellous bone mass and structure in streptozotocin-induced diabetic rats. Bone 2003;33:108-14.
13. Maor G, Karnieli E. The insulin-sensitive glucose transporter (GLUT4) is involved in early bone growth in control and dia- betic mice, but is regulated through the insulin-like growth factor I receptor. Endocrinology 1999;140:1841-51.
14. Ogata N, Chikazu D, Kubota N, Terauchi Y, Tobe K, Azuma Y, Ohta T, Kadowaki T, Nakamura K, Kawaguchi H. Insulin re- ceptor substrate-1 in osteoblast is indispensable for maintain- ing bone turnover. J Clin Invest 2000;105:935-43.
15. Kitamura T, Kitamura Y, Nakae J, Giordano A, Cinti S, Kahn CR, Efstratiadis A, Accili D. Mosaic analysis of insulin receptor function. J Clin Invest 2004;113:209-19.
16. Ward DT, Yau SK, Mee AP, Mawer EB, Miller CA, Garland HO, Riccardi D. Functional, molecular, and biochemical character- ization of streptozotocin-induced diabetes. J Am Soc Nephrol 2001;12:779-90.
17. Yamagishi S, Nakamura K, Inoue H. Possible participation of advanced glycation end products in the pathogenesis of osteo- porosis in diabetic patients. Med Hypotheses 2005;65:1013-5.
18. Rakel A, Sheehy O, Rahme E, LeLorier J. Osteoporosis among patients with type 1 and type 2 diabetes. Diabetes Metab 2008;
34:193-205.
19. Barrett-Connor E, Holbrook TL. Sex differences in osteoporo- sis in older adults with non-insulin-dependent diabetes melli- tus. JAMA 1992;268:3333-7.
20. Janghorbani M, Van Dam RM, Willett WC, Hu FB. Systematic review of type 1 and type 2 diabetes mellitus and risk of fracture.
Am J Epidemiol 2007;166:495-505.
21. de Liefde II, van der Klift M, de Laet CE, van Daele PL, Hof- man A, Pols HA. Bone mineral density and fracture risk in type-2 diabetes mellitus: the Rotterdam Study. Osteoporos Int 2005;16:1713-20.
22. Strotmeyer ES, Cauley JA, Schwartz AV, Nevitt MC, Resnick HE, Bauer DC, Tylavsky FA, de Rekeneire N, Harris TB, New- man AB. Nontraumatic fracture risk with diabetes mellitus and impaired fasting glucose in older white and black adults:
the health, aging, and body composition study. Arch Intern Med 2005;165:1612-7.
23. Kim KS, Choi SN, Bae HC, Kim JT, Chung HK, Oh YS, Shinn SH. NIDDM and BMD in postmenopausal women. J Korean Diabetes Assoc 1996;20:273-81.
24. Park JM, Kang SJ, Kim KW, Park RW, Kim JW. Diagnosis of os-
teoporosis of the foot in patients with diabetes mellitus using bone densitometry. J Korean Acad Rehabil Med 2000;24:311-7.
25. Cui LH, Shin MH, Chung EK, Lee YH, Kweon SS, Park KS, Choi JS. Association between bone mineral densities and se- rum lipid profiles of pre- and post-menopausal rural women in South Korea. Osteoporos Int 2005;16:1975-81.
26. Orozco P. Atherogenic lipid profile and elevated lipoprotein (a) are associated with lower bone mineral density in early post- menopausal overweight women. Eur J Epidemiol 2004;19:
1105-12.
27. Samelson EJ, Cupples LA, Hannan MT, Wilson PW, Williams SA, Vaccarino V, Zhang Y, Kiel DP. Long-term effects of serum cholesterol on bone mineral density in women and men: the Framingham Osteoporosis Study. Bone 2004;34:557-61.
28. Jadhav SB, Jain GK. Statins and osteoporosis: new role for old drugs. J Pharm Pharmacol 2006;58:3-18.