Copyright © 2019 The Korean Society for Bone and Mineral Research
This is an Open Access article distributed under the terms of the Creative Commons Attribution Non-Commercial Li- cense (http://creativecommons.org/licenses/by-nc/4.0/) which permits unrestricted non-commercial use, distribu- tion, and reproduction in any medium, provided the original work is properly cited.
Is There a Difference in Serum Vitamin D Levels and Bone Mineral Density According to Body Mass Index in Young Adult Women?
Hee-Sook Lim1, Dong Won Byun2, Kyo Il Suh2, Hyeong Kyu Park2, Hye Jeong Kim2, Tae-Hee Kim3, Hae-Hyeog Lee3
1Department of Food and Nutrition, Yeonsung University, Anyang;
2Division of Endocrinology and Metabolism, Department of Internal Medicine, Soonchunhyang University College of Medicine, Seoul;
3Department of Obstetrics and Gynecology, Soonchunhyang University College of Medicine, Bucheon, Korea
Background: In the life cycle, bone mineral density (BMD) is the most optimal condition in the 20s. In Korea, vitamin D deficiency status is very serious in Korean women due to recent lack of activity, weight polarization, and inadequate nutritional intake. The pur- pose of this study was to compare serum vitamin D and BMD according to obesity status in Korean young adult women. Methods: A total of 143 female college students partici- pated in the research. Body fat and lean body status were analyzed using a body com- position analyzer. Nutrient intakes of the subjects were assessed by 3-days food record method. The BMDs was measured by dual energy X-ray absorptiometry. The subjects were divided into normal weight group and obesity group on their body mass index.
Results: Obesity group showed significantly higher weight, body fat (%), and body fat (kg) than normal weight group and T-scores of lumbar-2 spines were significantly lower.
Obesity group showed high triglyceride and low-density lipoprotein cholesterol levels and vitamin D levels were significantly lower. Physical fitness and activity status showed that sit and reach and sit up were significantly lower in obesity group. The intake of car- bohydrates was higher in the obesity group than in the normal weight group, and the intake of vitamin C and vitamin D was significantly lower. Factors affecting serum vita- min D were analyzed as body fat (%), lumbar-2 T-score, triglyceride, and carbohydrate intake. Conclusions: Obese women need more effort to manage their serum vitamin D status and balanced nutrition to prevent bone loss.
Key Words: Body mass index · Bone density · Nutritional status · Obesity · Vitamin D
INTRODUCTION
Vitamin D is known to play a major role in the development and maintenance of the skeleton and muscles in our body because of its ability to regulate calcium and phosphorus absorption.[1] The incidence rate of vitamin D deficiency in Ko- rea has been steadily increasing. The rate of vitamin D deficiency was reported to have increased to 77.9% in 2010 to 2014; the cost of medical treatment has also increased. The rate of vitamin D deficiency is higher in women in the 10 to 20-year age group than in those in other age groups.[2]
Serum vitamin D levels are known to be influenced by sun exposure, season, di- Corresponding author
Dong Won Byun
Division of Endocrinology and Metabolism, Department of Internal Medicine, Soonchunhyang University Seoul Hospital, 59 Daesagwan-ro, Yongsan-gu, Seoul 04401, Korea
Tel: +82-2-709-9493 Fax: +82-2-709-9083 E-mail: [email protected] Received: May 7, 2019 Revised: July 20, 2019 Accepted: August 6, 2019
Original Article
pISSN 2287-6375 eISSN 2287-7029
etary intake, obesity, and age. In particular, pregnancy, lac- tation, and estrogen secretion have been known to affect vitamin D levels in women.[3] Many studies have been conducted on the health effects of vitamin D, and recently, a relationship has been reported between vitamin D and obesity.[4,5] Adults with vitamin D deficiency had a high risk of chronic disease [6] and a high body fat percentage in the group with deficient vitamin D.[7]
In pre-menopausal women, vitamin D deficiency was positively correlated with body mass index (BMI). US stud- ies have shown that the risk of vitamin D deficiency is 3 times higher in individuals with high levels of obesity than in individuals with normal weight.[8] Vitamin D status of young women is important because women need to main- tain adequate levels of vitamin D during pregnancy, child- birth, and menopause.[9] In general, increased exposure to sunshine and intake of food or supplements with high vitamin D content are recommended for maintaining suffi- cient vitamin D levels.[10] But, adolescents and young adults, who need to maintain maximum bone mass due to low activity and unbalanced dietary intake, are vulnerable to vitamin D deficiency.[11,12] However, most studies on this subject have been limited to post-menopausal women and elderly patients and studies on nutritional intake are lack.
In this study, we aimed to examine the differences in vi- tamin D levels, bone density, and nutritional intake in young women according to BMI. We intend to use these results as basic data for emphasizing prevention and management of obesity and promotion of bone health in young women.
METHODS
1. Study subjectThis study recruited 156 healthy students from domestic universities. The exclusion criteria were as follows. Those who have usual illness (n=2), those who intake bone-re- lated medication, vitamin D and calcium supplements (n=9), those who have a weight change of more than 10%
over the last 6 months (n=2) were excluded from the study.
Therefore, only 143 data were used for the analysis of re- sults except for 13 subjects. The subject, purpose, and con- tent of the study were explained to all subjects, and they agreed to participate in the study. The design and progress of the overall study was approved by the Institutional Re- view Board of Soonchunhyang University.
2. Study variables
BMI was calculated by measuring height and weight us- ing an automatic composition analyzer (X-SCAN PLUS; Ja- won Medical Co., Seoul, Korea); body fat percentage, body fat mass, and fat mass were also calculated. Bone mineral density (BMD) was measured using dual energy X-ray ab- sorptiometry (DXA; Lunar Prodigy Advance; GE Lunar, Madi- son, WI, USA). Osteopenia, BMD T-score below -1.0, and os- teoporosis, BMD T-score below -2.5, were diagnosed on at any site of the lumbar spine, femur neck and total hip lum- bar spine BMD according to World Health Organization cri- teria.[13] Blood samples were collected from the subjects after they had fasted for 8 hr, and the samples were ana- lyzed using an automatic blood analyzer (Hitachi 760-210;
Hitachi Co., Tokyo, Japan). Triglyceride, total cholesterol, high-density lipoprotein cholesterol, low-density lipopro- tein (LDL) cholesterol, fasting blood glucose, and serum vi- tamin D levels were measured. Vitamin D status was cate- gorized as follows: “deficient”=vitamin D level <20 ng/
mL; “relatively insufficient”=vitamin D level ≥20 ng/mL and <30 ng/mL; and “sufficient”=vitamin D level ≥30 ng/
mL.[14]
Physical fitness and physical activity were also investi- gated; these procedures followed the suggestion of the Young Men’s Christian Association.[15] The sit-and-reach method was used to measure flexibility of the hamstring muscles and lower back. Standing long jump was used to measure the muscular fitness of leg muscles. The tests were repeated thrice, and the best performance was re- corded. We also measured the number of times a subject could sit and stand per minute. Grip strength was mea- sured using a digital dynamometer (TKK 5401; Takei, Ni- igata, Japan). After explaining the types of muscle and aer- obic exercise, we collected information about the number of exercises performed per week.
Data on dietary intake amount were collected using 3-days food record method for 3 days and intakes of nutri- ents were analyzed with the CAN program (The Korean Nutrition Society, ver. 5.0). The subjects were classified into 2 groups: the obesity group, subjects with BMI ≥25 kg/m2 [16] and the normal weight group, subjects with BMI <25 kg/m2. In this study, pre-obesity subjects were included as normal weight group to more clearly evaluate the results according to obesity.
3. Statistical analysis
The mean and standard deviation were calculated using SPSS software program ver. 18.0 (SPSS Inc., Chicago, IL, USA). We performed the Kolmogorov-Smirnov test to check whether the continuous variables were normal distribu- tion. All data were reported as mean±standard deviation or as numbers and percentages. Groups comparisons used χ2 tests for qualitative variables and independent t-test for quantitative variables. All results were considered statisti- cally significant when P<0.05.
RESULTS
Of the total subjects, normal weight group was 62.2%
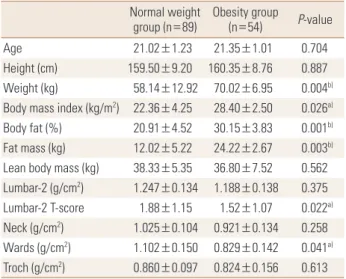
(n=89) and obesity group was 37.8% (n=54). Body weight, BMI, body fat percentage, and body fat mass were signifi-
cantly higher in the obesity group than in the normal wei- ght group; contrastingly, lumbar T-score and wards bone density were significantly lower in the obesity group than in the normal weight group (Table 1). Compared to stan- dard values, blood parameters were normal in both groups;
however, triglyceride and LDL cholesterol levels were sig- nificantly higher in the obesity group than in the normal weight group. Vitamin D was found to be deficient in both groups, and the concentration of obesity group was signif- icantly lower (Table 2).
With regards to physical activity, the scores of the sit-
Table 1. Comparisons of body composition and bone density between normal and obese young adults
Normal weight
group (n=89) Obesity group
(n=54) P-value
Age 21.02±1.23 21.35±1.01 0.704
Height (cm) 159.50±9.20 160.35±8.76 0.887 Weight (kg) 58.14±12.92 70.02±6.95 0.004b) Body mass index (kg/m2) 22.36±4.25 28.40±2.50 0.026a) Body fat (%) 20.91±4.52 30.15±3.83 0.001b) Fat mass (kg) 12.02±5.22 24.22±2.67 0.003b) Lean body mass (kg) 38.33±5.35 36.80±7.52 0.562 Lumbar-2 (g/cm2) 1.247±0.134 1.188±0.138 0.375 Lumbar-2 T-score 1.88±1.15 1.52±1.07 0.022a) Neck (g/cm2) 1.025±0.104 0.921±0.134 0.258 Wards (g/cm2) 1.102±0.150 0.829±0.142 0.041a) Troch (g/cm2) 0.860±0.097 0.824±0.156 0.613
a)P<0.05. b)P<0.01.
Table 2. Comparisons of biochemical profile between normal and obese young adults
Normal weight
group (n=89) Obesity group (n=54) P-value Triglycerides (mg/dL) 106.22±41.55 158.97±70.26 0.004b) Total cholesterol (mg/dL) 148.81±25.90 159.38±58.92 0.152 HDL cholesterol (mg/dL) 49.13±10.87 45.24±8.40 0.470 LDL cholesterol (mg/dL) 88.65±21.24 107.52±28.36 0.010a) Fasting glucose (mg/dL) 92.02±11.05 93.09±20.82 0.626 25(OH)D, total (ng/mL) 16.06±12.51 12.15±10.27 0.019a)
a)P<0.05. b)P<0.01
HDL, high-density lipoprotein; LDL, low-density lipoprotein; 25(OH)D, 25-hydroxy-vitamin D.
Table 3. Comparisons of health-related fitness and physical activity status between normal and obese young adults
Normal weight
group (n=89) Obesity group (n=54) P-value Sit and reach (cm) 7.70±6.15 4.50±5.90 0.028a) Standing long jump (cm) 180.30±15.20 168.20±11.90 0.337 Sit-up (n/min) 25.30±8.19 16.00±12.02 0.019a) Grip strength (kg) 22.70±5.52 20.40±3.05 0.610 Muscle exercise (n/week) 0.40±0.82 0.20±0.03 0.361 Aerobic exercise (n/week) 0.70±0.20 0.50±28.36 0.253
a)P<0.05.
Table 4. Comparisons of nutrient intake between normal and obese young adults
Normal weight
group (n=89) Obesity group
(n=54) P-value Energy (kcal) 1,598.41±208.54 1,759.65±272.80 0.028 Protein (g) 61.70±5.21 65.93±17.00 0.610
Fat (g) 51.83±11.52 54.31±18.51 0.450
Carbohydrate (g) 212.54±46.26 253.40±71.22 0.011a)
Fiber (g) 15.06±2.83 13.52±4.12 0.192
Calcium (mg) 408.78±134.47 376.26±121.24 0.443 Phosphorous (mg) 925.71±274.01 1,010.04±154.85 0.378
Iron (mg) 15.79±5.30 14.27±4.73 0.614
Sodium (mg) 5,034.12±1,220.02 4,893.08±1,495.75 0.585 Potassium (mg) 2,312.30±901.25 2,650.69±754.76 0.304
Zinc (mg) 9.40±4.84 8.90±4.30 0.414
Vitamin A (μgRE) 620±156 603±241 0.672
Vitamin B1 (mg) 1.20±0.59 1.21±0.32 0.801 Vitamin B2 (mg) 1.31±0.41 1.22±0.25 0.542 Vitamin B6 (mg) 1.13±0.61 1.14±0.34 0.716 Vitamin C (mg) 90.74±34.45 63.95±26.23 0.030a) Folic acid (mg) 347.88±152.76 301.43±110.62 0.428 Vitamin E (mg) 14.02±4.73 13.17±7.95 0.390 Vitamin D (µg) 2.85±2.21 1.62±2.86 0.042a)
a)P<0.05.
and-reach and sit-up tests were significantly lower in the obesity group than in the normal weight group. Exercise frequency was very low in both groups (Table 3). On com- paring nutritional status between the 2 groups, we found that carbohydrate intake was significantly higher and vita- min C and D intakes were significantly lower in the obesity group than in the normal weight group. Other nutrient in- takes were not significantly different between the 2 groups (Table 4).
Body fat percentage, Lumbar-2 T-score, triglyceride lev- els, and carbohydrate intake were found to be the major determinants of serum vitamin D levels in the obesity group (Table 5).
DISCUSSION
Recently, there has been an emphasis on the importance of vitamin D as it has been reported that vitamin D defi- ciency can increase the risk of various chronic diseases, along with influencing bone metabolism.[17] Sufficient Vi- tamin D intake and appropriate physical activity are effec- tive countermeasures for preventing exposure to vitamin D deficiency.[18] The purpose of this study was to investi- gate vitamin D deficiency status in young adult women ac- cording to the obesity index and to analyze factors affect- ing vitamin D deficiency.
Body fat percentage and body fat mass were significant- ly higher in obesity group than normal weight group. The results were not significant, but the lean body mass of obesity group was slightly less. Obesity is associated with metabolic syndrome and oeteopenia due to lack of physi- cal activity, changes in hormones, and imbalance in nutri- tion.[19] Although we cannot confirm whether obesity group is sarcopenic obesity, obesity group seems to need efforts to reduce body fat and increase muscle mass. Al-
though the value of lumbar-2 T-score was significantly lower in the obesity group, the mean value of lumbar 1-4 was not significantly different and the results of BMD were normal in both groups. Previous studies have shown that adipokines are associated with bone metabolism [20] and that central obesity increases osteopenia or osteoporosis due to decreasing bone density seen with increasing waist-to-hip ratio, an index of central obesity.[21] However, more research is needed on the physiological mechanisms and causes of this relationship.
Triglyceride and LDL cholesterol levels were slightly high- er whereas vitamin D levels were significantly lower in the obesity group than in the normal weight group. Especially, the subjects were “deficient” for vitamin D. Recently, the expression of enzymes affecting vitamin D metabolism has been demonstrated in adipocytes, and the relationship between obesity and vitamin D is increasing.[20] Obesity is known to decrease vitamin D synthesis by increasing the expression of enzymes that adversely affect vitamin D me- tabolism.[22,23]
Studies involving adults in Europe have also reported that vitamin D levels tend to decrease with increasing BMI.
[24] In addition, physical activity and physical strength were lower in the obesity group than in the normal weight group; vitamin D intake was also insufficient in the obesity group. Therefore, various factors were expected to influ- ence vitamin D levels. In addition, young women have a perception that ultraviolet rays are harmful to the skin, and therefore, health awareness to raise the vitamin D level should also be improved when considering the prelimi- nary study that 85% [2]; however, we did not analyze this factor in this study.
Nutrient intakes were lower in the 2 groups than in the younger group, which was estimated to be 2,100 kcal; di- etary fiber, calcium, vitamin C, folic acid, and vitamin E lev- els were inadequate in both groups.[25] Vitamin C and D intakes were significantly lower in the obesity group than in the normal weight group. In domestic study, obesity women have been associated with higher health risk due to lower variability of food intake than normal weight wom- en.[26] In this study, we could not find the cause of lack of vitamin C and vitamin D intake in obesity group because food intake was not investigated concurrently. Because calcium and vitamin D are very important for skeletal health, it is necessary to emphasize intake of calcium- and vitamin Table 5. Factor affecting serum vitamin D status in obese young adults
according various factors
Variables Coefficient SE P-value
Vitamin D
Body fat (%) -0.315 0.217 0.003b)
Lumbar-2 T-score -0.327 0.028 0.001b)
Triglycerides -0.056 0.034 0.032a)
Carbohydrate -0.022 0.011 0.045a)
a)P<0.05. b)P<0.01.
SE, standard error.
D-containing food that can satisfy it; furthermore, aware- ness for increasing antioxidant nutrient intake is necessary.
Factors affecting serum vitamin D levels in the obesity group included body fat percentage, bone density, triglyc- eride, and carbohydrate intake. Recently, health concerns have increased with the increase in sugar consumption in the younger generation.[27] In the past, many studies re- ported that nutrient and carbohydrate intakes were lower in the low BMD group than in the normal BMD group.[28]
Balanced dietary intake should be emphasized for pre- venting osteoporosis rather than the effects of excess/defi- cient carbohydrate intake on bone density.
Our data had certain limitations as it did not reflect fac- tors such as sunlight exposure, sunscreen use, season, smok- ing status, and do not represent young adult women. Fur- thermore, there is no clear explanation for the causal rela- tionship between low vitamin D levels in the obesity group and the effects of potential confounding factors.
CONCLUSION
In conclusion, obese women had lower levels of serum vitamin D and lumbar-2 T-score than normal weight wom- en. Therefore, not only to maintain normal weight for health, but also nutritional status and physical activity should be managed in multiple way. Future continuous and prospec- tive studies are needed.
DECLARATIONS
Ethics approval and consent to participate This study was approved by the Ethical Committee of Soonchunhyang University. All patients provided informed consent prior to entering the study.
Conflict of interest
No potential conflict of interest relevant to this article was reported.
ORCID
Hee-Sook Lim https://orcid.org/0000-0003-0745-8906 Dong Won Byun https://orcid.org/0000-0001-5110-1221 Kyo Il Suh https://orcid.org/0000-0001-7858-0920 Hyeong Kyu Park https://orcid.org/0000-0002-1832-7410 Hye Jeong Kim https://orcid.org/0000-0003-1010-9803
Tae-Hee Kim https://orcid.org/0000-0003-3478-9102 Hae-Hyeog Lee https://orcid.org/0000-0003-4876-2912
REFERENCES
1. Sassi F, Tamone C, D'Amelio P. Vitamin D: Nutrient, hor- mone, and immunomodulator. Nutrients 2018;10.
2. Lee I, Kang H. Association of physical activity and body fatness with vitamin D deficiency in older adults. Korean J Obes 2016;25:24-30.
3. Al-Raddadi R, Bahijri S, Borai A, et al. Prevalence of lifestyle practices that might affect bone health in relation to vita- min D status among female Saudi adolescents. Nutrition 2018;45:108-13.
4. Pantovic A, Zec M, Zekovic M, et al. Vitamin D Is inversely related to obesity: Cross-sectional study in a small cohort of serbian adults. J Am Coll Nutr 2019;38:405-14.
5. Moschonis G, Androutsos O, Hulshof T, et al. Vitamin D in- sufficiency is associated with insulin resistance indepen- dently of obesity in primary schoolchildren. The healthy growth study. Pediatr Diabetes 2018;19:866-73.
6. Soares MJ. Calcium and vitamin D for chronic disease: a time for action. Eur J Clin Nutr 2011;65:985.
7. Oliai Araghi S, van Dijk SC, Ham AC, et al. BMI and body fat mass is inversely associated with vitamin D levels in older individuals. J Nutr Health Aging 2015;19:980-5.
8. Winters SJ, Chennubhatla R, Wang C, et al. Influence of obesity on vitamin D-binding protein and 25-hydroxy vi- tamin D levels in African American and white women. Me- tabolism 2009;58:438-42.
9. Jolfaie NR, Rouhani MH, Onvani S, et al. The association between vitamin D and health outcomes in women: A re- view on the related evidence. J Res Med Sci 2016;21:76.
10. Spector TD, Levy L. Should healthy people take a vitamin D supplement in winter months? BMJ 2016;355:i6183.
11. Hill TR, Flynn A, Kiely M, et al. Prevalence of suboptimal vi- tamin D status in young, adult and elderly Irish subjects. Ir Med J 2006;99:48-9.
12. Bohaty K, Rocole H, Wehling K, et al. Testing the effective- ness of an educational intervention to increase dietary in- take of calcium and vitamin D in young adult women. J Am Acad Nurse Pract 2008;20:93-9.
13. Kanis JA, Melton LJ 3rd, Christiansen C, et al. The diagnosis of osteoporosis. J Bone Miner Res 1994;9:1137-41.
14. Thacher TD, Clarke BL. Vitamin D insufficiency. Mayo Clin
Proc 2011;86:50-60.
15. Belza B, Petrescu-Prahova M, Kohn M, et al. Adoption of evidence-based health promotion programs: Perspectives of early adopters of enhance((R))fitness in YMCA-affiliated sites. Front Public Health 2014;2:164.
16. Korean Society for the Study of Obesity. Clinical guidelines of treatment of obesity 2018. 2018 [cited by 2019 Jul 3].
Available from: http://www.kosso.or.kr/file/file180614.pdf 17. Boucher BJ. Vitamin D status and its management for achi- eving optimal health benefits in the elderly. Expert Rev Endocrinol Metab 2018;13:279-93.
18. Cardwell G, Bornman JF, James AP, et al. A review of mush- rooms as a potential source of dietary vitamin D. Nutrients 2018;10.
19. Tournadre A, Vial G, Capel F, et al. Sarcopenia. Joint Bone Spine 2019;86:309-14.
20. Lenchik L, Register TC, Hsu FC, et al. Adiponectin as a nov- el determinant of bone mineral density and visceral fat.
Bone 2003;33:646-51.
21. Kinjo M, Setoguchi S, Solomon DH. Bone mineral density in adults with the metabolic syndrome: analysis in a pop- ulation-based U.S. sample. J Clin Endocrinol Metab 2007;
92:4161-4.
22. Harris SS, Dawson-Hughes B. Reduced sun exposure does
not explain the inverse association of 25-hydroxyvitamin D with percent body fat in older adults. J Clin Endocrinol Metab 2007;92:3155-7.
23. Lim HS, Kim TH, Lee HH, et al. Relationship between se- rum 25-hydroxy-vitamin D concentration and risk of met- abolic syndrome in patients with fatty liver. J Bone Metab 2017;24:223-8.
24. Jorde R, Sneve M, Emaus N, et al. Cross-sectional and lon- gitudinal relation between serum 25-hydroxyvitamin D and body mass index: the Tromso study. Eur J Nutr 2010;
49:401-7.
25. Ministry of Health & Welfare, The Korean Nutrition Society.
Dietary reference intakes for Koreans. Sejong: Ministry of Health & Welfare, The Korean Nutrition Society; 2015.
26. Park JY, Heo YR. Relationship of vitamin D status and obe- sity index in Korean women. J Nutr Health 2016;49:28-35.
27. Kessaram T, McKenzie J, Girin N, et al. Overweight, obesity, physical activity and sugar-sweetened beverage consump- tion in adolescents of Pacific islands: results from the glob- al school-based student health survey and the youth risk behavior surveillance system. BMC Obes 2015;2:34.
28. Mazidi M, Kengne AP, Vatanparast H. Association of dietary patterns of American adults with bone mineral density and fracture. Public Health Nutr 2018;21:2417-23.