INTRODUCTION
Diabetes is a major worldwide health epidemic that affected nearly 415 million people in 2015. Poorly managed diabetes leads to serious complications and early death in most countries, but with good self-management and health professional support, people with diabetes can live long, healthy lives [1]. Complications related to both
type 1 and type 2 diabetes can be reduced by better regulation of blood glucose [2]. Self-monitoring of blood glucose (SMBG) enables diabetes patients to effectively control their blood glucose levels. Moreover, management of diabetes through diet, exercise, and chemical treatment can delay degeneration of the disease or arrival of complications. The blood glucose test thus is considered one of the most important point-of-care tests [3,4].
Performance Evaluation of B. Braun Omnitest 5 Blood Glucose Monitoring System for
Self-Monitoring of Blood Glucose
Kyungso Jeon 1 and Miseon Shin 2
1
Department of Laboratory Medicine and
2Division of Endocrinology and Metabolism, Hanil General Hospital, Seoul, Korea
Background: We evaluated the accuracy of the B. Braun Omnitest 5 blood glucose monitoring system (BGMS; Infopia Co. Ltd., Korea), which was recently developed for self- monitoring of blood glucose.
Methods: Precision was assessed according to Clinical and Laboratory Standards Institute guideline EP5-A3 with control materials containing low, normal, and high levels of glucose.
Linearity was evaluated over the range of 52.5–548.0 mg/dL prepared from patient samples.
For system accuracy, 100 capillary blood samples measured by the B. Braun Omnitest 5 BGMS were compared to plasma-equivalent blood glucose values of the fingertip blood samples measured by the YSI 2300 STAT PLUS glucose analyser (YSI Life Sciences, USA).
Accuracy was evaluated according to the International Organization for Standardization (ISO) 15197: 2013 criteria.
Results: The range for the total coefficient of variation (%) was 1.5%–4.9% for three lots of strips. Both within-run precision and within-laboratory precision fulfilled the manufacturer’s claim. ISO 15197: 2013 states that more than 95% of blood glucose measurement values must be within ±15 mg/dL for ranges below 100 mg/dL and ±15% for ranges above 100 mg/
dL. Each of B. Braun Omnitest 5 lots satisfied ISO 15197: 2013, as 98.5% (197/200), 97.0%
(194/200), and 99.5% (199/200) of values were within range. In consensus error grid analysis, respectively, 99.5%, 99.0%, and 100.0% of measurement values of each lot were within zone A, indicating that an average of over 99.0% of values were within zone A.
Conclusions: B. Braun Omnitest 5 provided reliable results and satisfied the ISO 15197: 2013 accuracy criteria. This test is an appropriate BGMS for the self-monitoring of blood glucose.
(J Lab Med Qual Assur 2016;38:234-242)
Key Words: Blood glucose monitoring system, Self-monitoring of blood glucose, Accuracy, Evaluation
Corresponding author:
Kyungso Jeon
Department of Laboratory Medicine, Hanil General Hospital, 308 Uicheon-ro, Dobong-gu, Seoul 01450, Korea Tel: +82-2-901-3720
Fax: +82-2-901-3606 E-mail: jks3393@hanmail.net pISSN: 2384-2458
eISSN: 2288-7261 Received April 12, 2016, Revision received August 22, 2016, Accepted September 9, 2016
The analytical performance of blood glucose monitoring systems (BGMSs) is critical because their accuracy can affect decisions regarding glycaemic control, such as insulin dosage [5].
The International Organization for Standardization (ISO) 15197: 2013 standard recommends that two minimum criteria be fulfilled for a system to be considered accurate [6]. One criterion specifies that the overall difference in 95.0% of values should be within ±15 mg/dL for concentrations <100 mg/dL and ±15% for those ≥100 mg/dL; the other is that 99.0% of measured values fall within zones A and B of the consensus error grid (CEG) for type 1 diabetes.
The B. Braun Omnitest 5 BGMS (Infopia Co. Ltd., Anyang, Korea) was recently developed for SMBG.
It is composed of B. Braun Omnitest 5 Blood Glucose Test Strips and a B. Braun Omnitest 5 Blood Glucose Test Meter, and adopts the GDH-FAD (flavin adenine dinucleotide-dependent glucose dehydrogenase) method and bio-sensor technology with electrochemical components to determine glucose levels. Designed to provide plasma-calibrated glucose values to patients in self-testing, the B. Braun Omnitest 5 BGMS requires a relatively small volume of whole blood (0.5 mL) for analysis and requires approximately 5 seconds for measurement.
The purpose of this study was to assess the performance of the B. Braun Omnitest 5 BGMS for SMBG.
MATERIALS AND METHODS
1. Subject
The study was conducted from November 3-30, 2015 at the Hanil General Hospital, a 500-bed general hospital in Seoul, Korea. Subjects who had received a diagnosis of type 1 or type 2 diabetes were recruited from the Division of Endocrinology at Hanil General Hospital. A total of 120 subjects were enrolled in this study; however, data analysis was performed on capillary blood samples from 100 different subjects because 20 subjects were excluded based on the exclusion criteria of the study. Data were excluded from statistical analysis if (1) a handling error occurred, (2) no reference value was available, (3) a
technical error occurred, (4) haematocrit value was outside the validated range of the respective BGMS, (5) the drift between the first and second reference measurement was
>4 mg/dL at blood glucose concentrations ≤100 mg/dL, or >4% at blood glucose concentrations >100 mg/dL, or (6) the maximum number of samples in a given blood glucose concentration category was already reached.
All subjects provided written informed consent, and the study protocol was conducted with institutional review board approval of Hanil General Hospital (KMC-2015- ME-001).
2. Methods 1) Precision
Precision testing was conducted in accordance with Clinical and Laboratory Standards Institute (CLSI) EP05-A3 [7]. Glucose levels were measured in duplicate in each run, and two runs per day for 20 days were performed for three concentrations of control materials. B.
Braun Omnitest 5 glucose control solution was supplied by the manufacturer. The calculated total coefficients of variation (CV) and SD were compared with the manufacturer’s claims for precision.
2) Linearity
Linearity testing was conducted in accordance with CLSI EP06-A [8]. During linearity testing, specimens with the highest and lowest glucose concentrations were selected from the EDTA-containing whole blood specimens remaining after routine testing (elapsed time until completion of the test was less than 1 hour). The two specimens were mixed at ratios of 5:0, 4:1, 3:2, 2:3, 1:4, and 0:5, and these six concentrations were then measured in quadruplicate.
3) Method comparison and system accuracy
Finger-stick extraction of blood was performed on each
subject using a lancing device and their blood glucose
levels were tested using Meter 1 and Meter 2 to test the
same drop of blood. Capillary blood samples were collected
into two capillary tubes of blood for measurement of
haematocrit levels and the YSI 2300 STAT PLUS (YSI
Life Sciences, Yellow Springs, OH, USA) glucose reference measurement. Using one tube, haematocrit was analysed using the ADVIA 2120i Automated Hematology System (Siemens, Munich, Germany). Glucose measurement of the B. Braun Omnitest 5 BGMS was found to be within the valid haematocrit range of 20%-60%. All data from haematocrit measurements fell within this claimed range.
The other tube was then immediately centrifuged at 2,260 g for 5 minutes. Glucose levels were measured by glucose oxidase assay on the YSI 2300 STAT PLUS in duplicate.
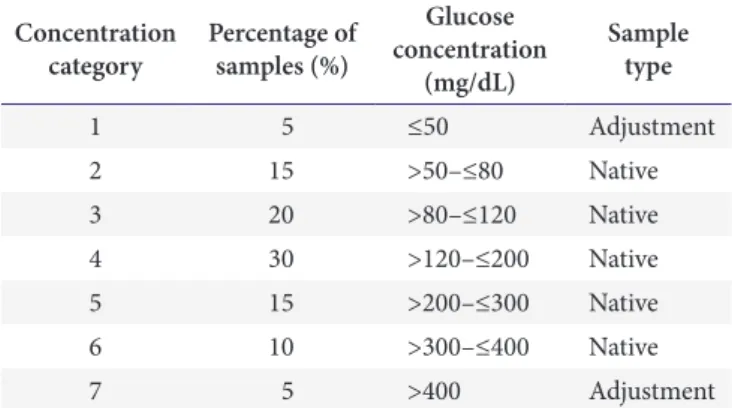
The ISO 15197 standard specifies that the blood glucose concentrations of blood samples should be distributed as follows: 5% <50 mg/dL, 15% ≥50 to <80 mg/dL, 20% ≥ 80 to <120 mg/dL, 30% ≥120 to <200 mg/dL, 15% ≥200 to <300 mg/dL, 10% ≥300 to <400 mg/dL, and 5% >400 mg/dL.
If sufficient numbers of native samples with blood glucose concentrations <50 mg/dL were not available, adjusted capillary blood samples were prepared as follows: blood samples were collected in lithium heparin tubes, incubated at 25
oC to allow for glycolysis, and gently mixed before testing. If sufficient numbers of native samples with blood glucose concentrations >400 mg/dL were not available, additional samples were prepared as follows: blood samples were collected in lithium heparin tubes, supplemented with concentrated glucose solution (40,000 mg/dL glucose in 0.9% NaCl), and gently mixed before testing [9]. In this study, the blood samples were distributed into different concentration categories based on the mean blood glucose reference values of the reference method (Table 1).
Native capillary samples were used at blood glucose concentrations of >50 mg/dL to ≤400 mg/dL and adjusted capillary blood was used at blood glucose concentrations of
≤50 mg/dL and >400 mg/dL in this study.
Tests using the B. Braun Omnitest 5 BGMS were performed by a well-trained technician to minimize user error and inter-user variance. BGMS tests were performed with three reagent system lots (F2QF03, F2QF04, and F2QF05). Two samples were excluded because of haemolysis and 18 samples were excluded because the concentration category was already filled. To
minimize the time between the duplicate measurements, two measurements were performed for each reagent system lot.
Estimated differences with 95% confidence intervals between the test and reference methods were derived from the linear regression method [10]. In addition, CEG analysis was performed and system accuracy was evaluated in conformance with the ISO 15197: 2013 standard.
The accuracy of the reference instrument was verified in accordance with the National Institute of Standards and Technology (Gaithersburg, MD, USA) reference material. Measurements taken by the reference method were performed at the clinical laboratory of Hanil General Hospital.
3. Statistical Analysis
System accuracy was assessed by comparing the BGMS measurement results with the respective mean result of the reference measurements. The data obtained from the B. Braun Omnitest 5 were plotted against the YSI 2300 STAT PLUS reference values and linear regression and CEG analyses were performed. Minimum system accuracy criteria were applied according to the ISO 15197: 2013 standard, by which the BGMS should meet the following criteria. (1) Criterion A: 95.0% of the measured glucose values should fall within either ±15 mg/dL of the average comparison measurement result at glucose concentrations
Table 1. Capillary samples for the evaluation of system accuracy according to International Organization for Standardization 15197:
2013 standard Concentration
category Percentage of samples (%)
Glucose concentration
(mg/dL)
Sample type
1 5 ≤50 Adjustment
2 15 >50–≤80 Native
3 20 >80–≤120 Native
4 30 >120–≤200 Native
5 15 >200–≤300 Native
6 10 >300–≤400 Native
7 5 >400 Adjustment
<100 mg/dL or within 15% at glucose concentrations ≥ 100 mg/dL. Each lot should pass acceptability criterion A. (2) Criterion B: 99.0% of individual glucose measured values should fall within zones A and B of the CEG [11].
Microsoft Excel 2010 (Microsoft Co., Redmond, WA, USA) was used for data analysis.
RESULTS
1. Precision
The range for total CV was 1.5%-4.9% for the three lots of strips. In terms of both within-run precision and within- laboratory precision, the manufacturer’s claims were fulfilled (Table 2): SDs for each glucose concentration
<100 mg/dL should be below 5 mg/dL and CV for each glucose concentration ≥100 mg/dL should be below 5%.
2. Linearity
Over the concentration range of 52.5-548.0 mg/dL, the coefficients of determination ( R
2) with the three reagent system lots were 0.9963, 0.9986, and 0.9962 (Fig. 1).
3. Method Comparison and System Accuracy
The glucose reference values ranged from 35 to 482 mg/dL. Two test strips from three individual strip lots (F2QF03, F2QF04, and F2QF05) were tested for each patient, for a total of 200 glucose meter results per lot.
Statistics showing combined lot agreement of the B.
Table 2. Precision of B. Braun Omnitest 5 blood glucose monitoring system by using three levels of control material on three lots Strip lot
Test result (n=80) Claim of manufacturer
Control solution
(mg/dL) Within-run precision Within-laboratory precision Within-laboratory precision
SD (mg/dL) CV (%) SD (mg/dL) CV (%) SD (mg/dL) CV (%)
F2QF03 Level 1 (35–65) 1.6 2.9 2.2 4.0 <5.0
Level 2 (102–136) 2.2 2.0 3.2 2.9 <5.0
Level 3 (295–399) 4.9 1.7 6.2 2.2 <5.0
F2QF04 Level 1 (35–65) 1.5 2.8 1.6 2.9 <5.0
Level 2 (102–136) 2.8 2.7 3.4 3.2 <5.0
Level 3 (295–399) 5.1 1.8 6.8 2.4 <5.0
F2QF05 Level 1 (35–65) 1.9 3.5 2.3 4.1 <5.0
Level 2 (102–136) 3.2 2.7 4.1 3.5 <5.0
Level 3 (295–399) 4.5 1.5 6.4 2.2 <5.0
Measured value (mg/dL)
600 500 400 300 200 100
200 400 600
A
Expected value (mg/dL)
y=0.964x 2.5453=0.9963 R2
Measured value (mg/dL)
600 500 400 300 200 100
200 400 600
B
Expected value (mg/dL)
y=0.9778x 6.7776=0.9986 R2
Measured value (mg/dL)
600 500 400 300 200 100
200 400 600
C
Expected value (mg/dL)
y=0.9941x 15.033=0.9962 R2
0 0 0
Fig. 1. Linearity of glucose concentrations measured by the three reagent system lots, B. Braun Omnitest 5. (A) F2QF03. (B)
F2QF04. (C) F2QF05.
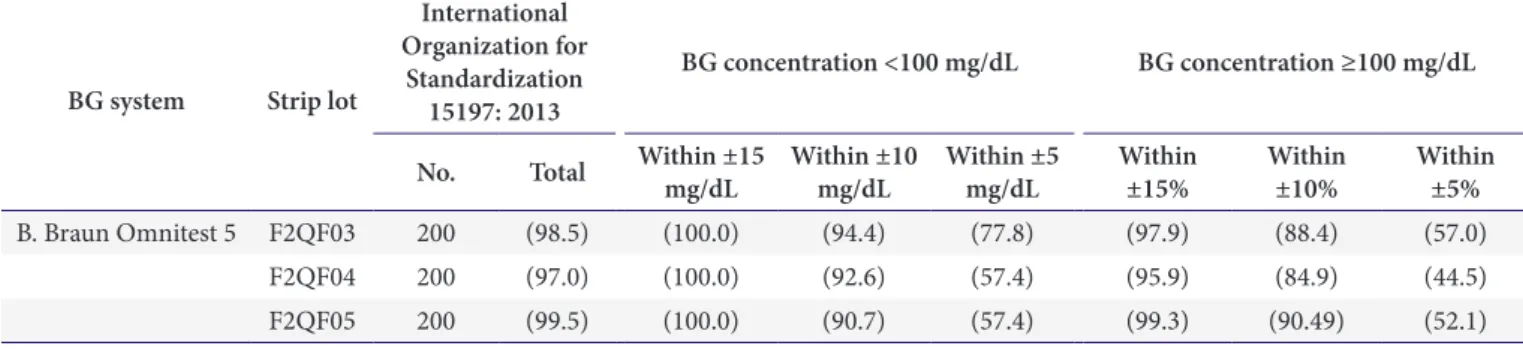
Braun Omnitest 5 BGMS results are shown in Table 3 and Fig. 2. When applying the system accuracy criteria of ISO 15197: 2013, 100% (54/54), 100% (54/54), and 100% (54/54) of B. Braun Omnitest 5 BGMS values were within ±15 mg/dL ( <100 mg/dL) for the three strip lots (F2QF03, F2QF04, and F2QF05), respectively.
Additionally, 97.9% (143/146), 95.9% (140/146), and 99.3% (145/146) were within ±15% (≥100 mg/dL) of the
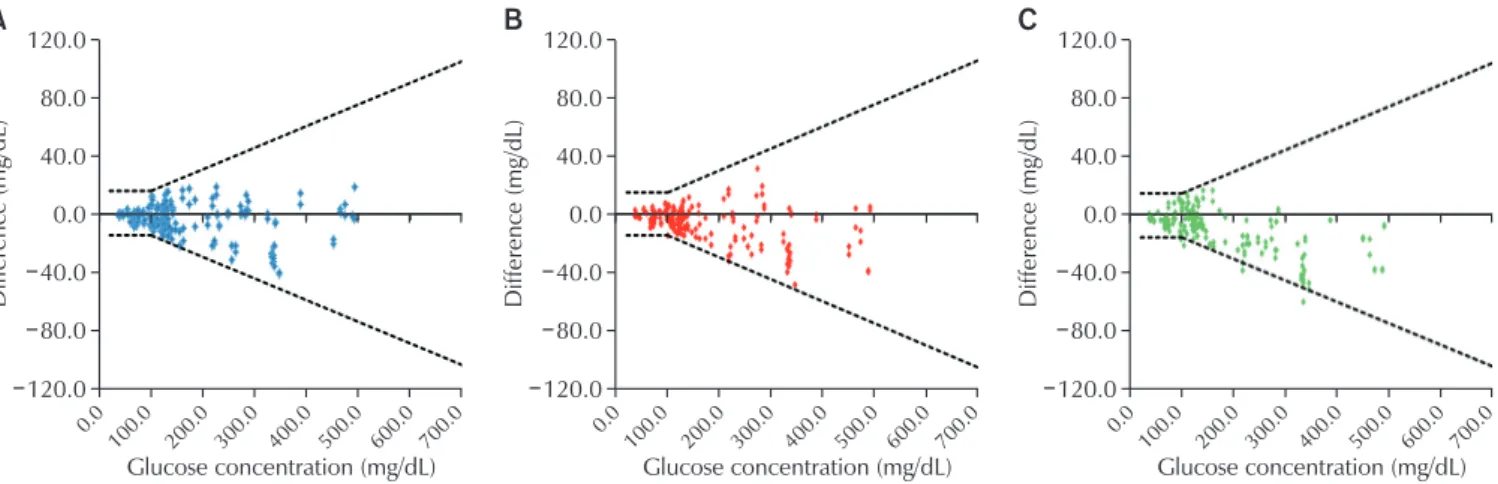
average reference value. For the overall concentrations, 98.5% (197/200), 97.0% (194/200), and 99.5% (199/200) of specimens met these criteria (Table 4, Fig. 3). In CEG analyses, 100% of the values were within zones A and B of the consensus error grid for the system (Table 5, Fig. 4).
Table 4. System accuracy between B. Braun Omnitest 5 blood glucose monitoring system and YSI 2300 STAT PLUS auto analyser (N=200)
BG system Strip lot
International Organization for
Standardization 15197: 2013
BG concentration <100 mg/dL BG concentration ≥100 mg/dL No. Total Within ±15
mg/dL Within ±10
mg/dL Within ±5
mg/dL Within
±15% Within
±10% Within
±5%
B. Braun Omnitest 5 F2QF03 200 (98.5) (100.0) (94.4) (77.8) (97.9) (88.4) (57.0)
F2QF04 200 (97.0) (100.0) (92.6) (57.4) (95.9) (84.9) (44.5)
F2QF05 200 (99.5) (100.0) (90.7) (57.4) (99.3) (90.49) (52.1)
Values are presented as number or (%).
Abbreviation: BG, blood glucose.
Table 3. Method comparison between B. Braun Omnitest 5 blood glucose monitoring system, and YSI 2300 STAT PLUS auto analyser (N=200)
Strip lot Linear regression 95% CI slope 95% CI intercept R
2No.
F2QF03 y=0.9454x+3.6801 (0.931–0.960) (0.761–6.599) 0.9887 200
F2QF04 y=0.9299x+4.5905 (0.916–0.943) (1.807–7.374) 0.9893 200
F2QF05 y=0.9436x+5.1553 (0.931–0.956) (5.658–7.653) 0.9916 200
Abbreviation: CI, confidence interval.
A
B . Braun Omnites t 5 (mg/dL)
700
500 400 300 200 100
100.0 200.0 300.0 400.0 500.0 600.0 700.0 YSI 2300 (mg/dL)
y=0.9454x+3.6801
=0.9887 R2
600
B
B . Braun Omnites t 5 (mg/dL)
700
500 400 300 200 100
100.0 200.0 300.0 400.0 500.0 600.0 700.0 YSI 2300 (mg/dL)
y=0.9299x+4.5905
=0.9893 R2
600
C
B . Braun Omnites t 5 (mg/dL)
700
500 400 300 200 100
100.0 200.0 300.0 400.0 500.0 600.0 700.0 YSI 2300 (mg/dL)
y=0.9436x+5.1553
=0.9916 R2
600
0 0 0
Fig. 2. Scatter plot of expected and measured glucose levels from method comparison test of Omnitest 5 blood glucose
monitoring system (200 data points, duplicate measurements on a sample with each test strip lot, are shown). Solid lines indicate
the limits stipulated in the International Organization for Standardization 15197: 2013. (A) F2QF03. (B) F2QF04. (C) F2QF05.
Table 5. Consensus error grid analysis of glucose levels measured by B. Braun Omnitest 5 blood glucose monitoring system against YSI 2300 STAT PLUS auto analyser (N=200)
Blood glucose system Strip lot Consensus error grid zone
Zone A Zone B Zone C Zone D Zone E
B. Braun Omnitest 5 F2QF03 199/200 (99.5) 1/200 (0.5) 0/200 (0) 0/200 (0) 0/200 (0)
F2QF04 198/200 (99.0) 2/200 (1.0) 0/200 (0) 0/200 (0) 0/200 (0)
F2QF05 200/200 (100.0) 0/200 (0) 0/200 (0) 0/200 (0) 0/200 (0)
Values are presented as number (%).
A
Difference (mg/dL)
120.0 120.0
40.0 0.0 40.0 80.0
0.0 100.0 200.0 300.0 400.0 500.0 600.0 700.0 Glucose concentration (mg/dL) 80.0
B C
Difference (mg/dL)
120.0 120.0
40.0 0.0 40.0 80.0
0.0 100.0 200.0 300.0 400.0 500.0 600.0 700.0 Glucose concentration (mg/dL) 80.0
Difference (mg/dL)
120.0 120.0
40.0 0.0 40.0 80.0
0.0 100.0 200.0 300.0 400.0 500.0 600.0 700.0 Glucose concentration (mg/dL) 80.0
Fig. 3. Absolute difference plot between the blood glucose concentration results measured by the systems and respective comparison values measured with YSI 2300 STAT PLUS (200 data points, duplicate measurements on a sample with each test strip lot, are shown). Solid lines indicate the limits stipulated in the International Organization for Standardization 15197: 2013. (A) F2QF03. (B) F2QF04. (C) F2QF05.
A B C
0 600 500 400 300 200 100
200 400 600
100 300 500
B . Braun Omnites t 5 (mg/dL)
YSI 2300 STAT Plus (mg/dL)
600 500 400 300 200 100
200 400 600
100 300 500
B . Braun Omnites t 5 (mg/dL)
YSI 2300 STAT Plus (mg/dL)
600 500 400 300 200 100
200 400 600
100 300 500
B . Braun Omnites t 5 (mg/dL)
YSI 2300 STAT Plus (mg/dL)
E D C B A
A
B
C
D
E D C B A
A
B
C
D
B
C
D A
A
E D C B
0 0
Fig. 4. Consensus error grid analysis of capillary blood glucose results. Each specimen was measured in duplicate by each
method. Zone A, clinically accurate (no effect on clinical action); zone B, clinically acceptable (altered clinical action-little or no
effect on clinical outcome); zone C, altered clinical action-likely to affect clinical outcome; zone D, altered clinical action-may
have significant medical risk; and zone E, altered clinical action-may have dangerous consequences. (A) F2QFO3. (B) F2QF04. (C)
F2QF05.
DISCUSSION
Accurate performance of glucose meters is the most critical factor of glycaemic control for a diabetic patient.
Hence, the criteria for the performance evaluation of glucose meters have become more stringent as required by regulatory agencies [12]. Most glucose meters are calibrated using capillary blood, after which reference equipment is employed to calibrate the plasma. Therefore, the glucose meter and reference equipment should utilise capillary blood for accurate performance evaluation.
The blood glucose concentration levels and quantities manipulated in the evaluation should be in compliance with ISO 15197. Occasionally, it is difficult for the subject (participant who donates the blood) to measure the capillary blood with the reference equipment. Thus, in common domestic evaluations, the blood glucose meter is evaluated using capillary blood, whereas the reference equipment is assessed using venous blood [13,14].
Nevertheless, this study evaluated ISO 15197: 2013 by employing capillary blood for both the evaluation criteria and the exclusion criteria applied in data analysis.
Upon measurement of the capillary blood collected from participants, the blood sample was tested again using the reference equipment. For glucose concentrations below 100 mg/dL, the difference between two measurements determined using the reference equipment should be less than 4 mg/dL and should be within the range of max bias ±4% for glucose concentrations above 100 mg/
dL. Otherwise, the subject should be excluded from the analysis. This is to minimize variance in the reference equipment. ISO 15197 states that samples with glucose concentrations under 50 mg/dL and over 400 mg/dL can be replaced with manipulated blood during evaluation.
However, this is done for extreme cases of patients with severe hypoglycaemia. Blood samples can be manipulated by decreasing sugar levels by approximately 7 mg/dL each hour, and samples of 50 mg/dL glucose concentration can be produced through glycolysis after collecting capillary blood. When glucose concentration exceeds 400 mg/dL, a 40,000 mg/dL stock solution is prepared for addition into the blood. After setting the target for blood glucose
concentration, the blood glucose concentration in the collected sample is measured. The formula applied multiplies the difference in blood glucose concentrations (current volume subtracted from target volume) and divides the product by the stock concentration. With the exception of the sample described above, all blood samples were evaluated utilizing non-manipulated blood.
In blood glucose measurement, Parkes proposed consensus error grid analysis techniques in the 2000s to improve the error grid analysis techniques first introduced by Clarke in the mid-1980s [11]. Consensus error grid analysis is a method that plots measured values in 5 error regions (zone A, B, C, D, and E). Based on the consensus of survey participants, glucose results in zones A and B lead to little or no effect on clinical outcome, whereas results in zones C to E lead to an increased risk of an adverse outcome. Evaluation of a BGMS requires the use of the prevailing method of error grid analysis, as regression analysis and the absolute value of the difference or percentage techniques analyse the measurement error from different concentrations with the same standard and do not reflect the importance of measurement values according to blood glucose concentration.
Hence, the ISO/DIS 15197: 2013, consensus error grid analysis is required and 99% of measurement values must be within zone A or B. Consensus error grid analysis demonstrated no risk of adverse effects of medical decisions in treatment, as outlier values of the B. Braun Omnitest 5 measurements were within zone B. A similar pattern of difference was observed in comparisons between the B. Braun Omnitest 5 BGMS and YSI 2300 Stat Plus.
All 600 tests fell in zone A or B of the consensus error grid. Thus, differences in results would not affect clinical actions (for zone A) or have little or no effect on clinical outcomes, even with altered clinical action (for zone B).
In addition to the accuracy test, comprehensive assessment of precision and linearity showed that the diagnostic equipment and other factors displayed outstanding performance.
In conclusion, the B. Braun Omnitest 5 provided
reliable results and satisfied the ISO 15197: 2013 accuracy
criteria, demonstrating good performance in terms of
precision and linearity. Therefore, the B. Braun Omnitest 5 is expected to be useful in self-testing by a BGMS.
ACKNOWLEDGEMENTS
The authors would like to thank In Suk Kim and Sang Won Kim for their help with this study.
This study was supported by Infopia Co. Ltd., Anyang, Korea.
REFERENCES
1. International Diabetes Federation. IDF diabetes atlas. 7th ed. Brussels: International Diabetes Federation, 2015.
2. American Diabetes Association. Standards of medical care in diabetes 2015: glycemic targets. Diabetes Care 2015;38(Suppl 1):S33-S40.
3. The Diabetes Control and Complications Trial Research Group. The effect of intensive treatment of diabetes on the development and progression of long-term complications in insulin-dependent diabetes mellitus. N Engl J Med 1993;329:977-86.
4. UK Prospective Diabetes Study (UKPDS) Group.
Intensive blood-glucose control with sulphonylureas or insulin compared with conventional treatment and risk of complications in patients with type 2 diabetes (UKPDS 33). Lancet 1998;352:837-53.
5. Virdi NS, Mahoney JJ. Importance of blood glucose meter and carbohydrate estimation accuracy. J Diabetes Sci Technol 2012;6:921-6.
6. International Organization for Standardization. In vitro diagnostic test systems: requirements for blood
glucose monitoring systems for self-testing in managing diabetes mellitus. Geneva: International Organization for Standardization, 2013.
7. Clinical and Laboratory Standards Institute. Evaluation of precision of quantitative measurement procedures:
approved guideline. 3rd ed. Wayne (PA): Clinical and Laboratory Standards Institute, 2014.
8. Clinical and Laboratory Standards Institute. Evaluation of linearity of quantitative measurement procedures: a statistical approach: approved guideline. Wayne (PA):
Clinical and Laboratory Standards Institute, 2003.
9. Khan MI, Weinstock RS. Carbohydrates. In: Henry JB, editor. Clinical diagnosis and management by laboratory methods. 22nd ed. Philadelphia (PA): WB Saunders, 2011:210-25.
10. Clinical and Laboratory Standards Institute. Method comparison and bias estimation using patient samples:
approved guideline. 2nd ed. Wayne (PA): Clinical and Laboratory Standards Institute, 2010.
11. Parkes JL, Slatin SL, Pardo S, Ginsberg BH. A new consensus error grid to evaluate the clinical significance of inaccuracies in the measurement of blood glucose.
Diabetes Care 2000;23:1143-8.
12. Thorpe GH. Assessing the quality of publications evaluating the accuracy of blood glucose monitoring systems. Diabetes Technol Ther 2013;15:253-9.
13. Lee JH, Cha YJ. Performance evaluation of BAROZEN H, a networking blood glucose monitoring system for medical institutions. Lab Med Online 2015;5:69-76.
14. Kim YB, Seo JY, Lee SY, Park HD. Performance evaluation of glucometer Barozen H based on ISO 15197 standards.
Lab Med Online 2015;5:6-14.
자가혈당측정기 B. Braun Omnitest 5 성능평가